. 2020 Oct 26;3(1):615.
doi: 10.1038/s42003-020-01333-1.

Osteopontin binds ICOSL promoting tumor metastasis

Affiliations

Osteopontin binds ICOSL promoting tumor metastasis

Davide Raineri et al. Commun Biol. .

Abstract

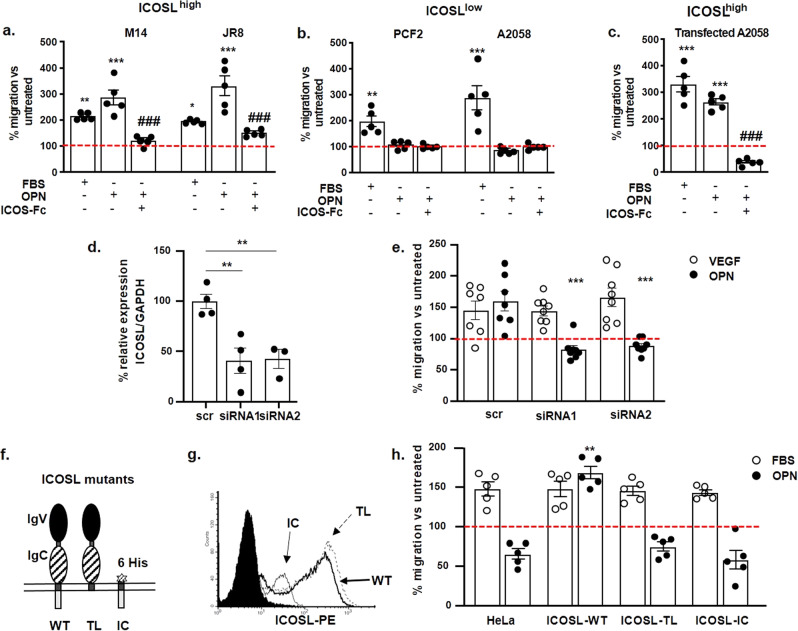
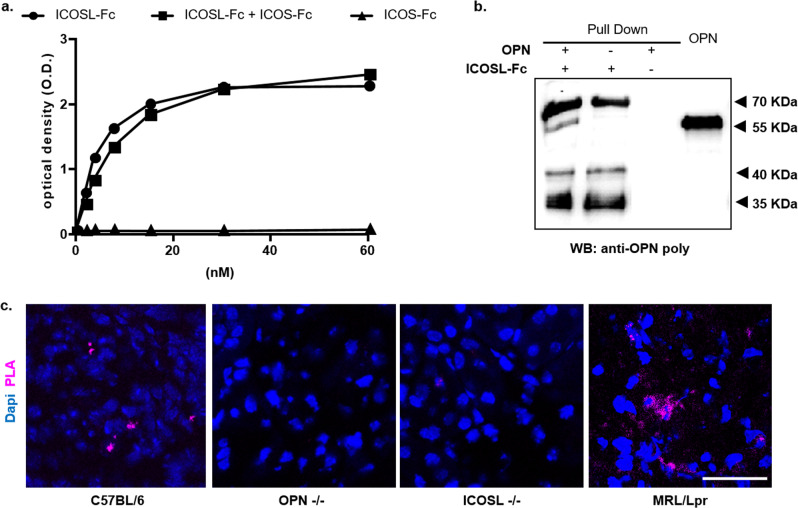
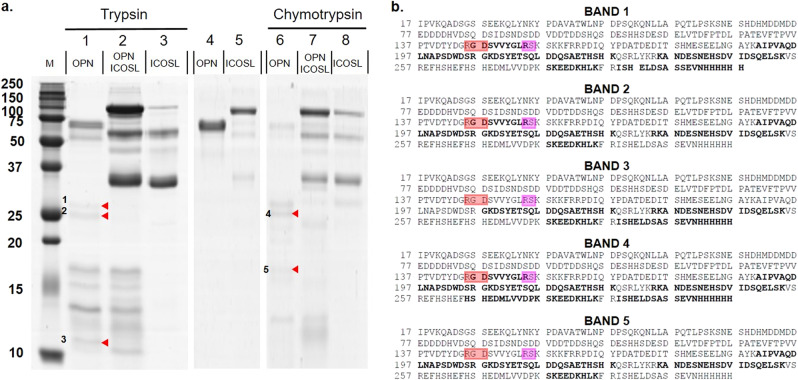
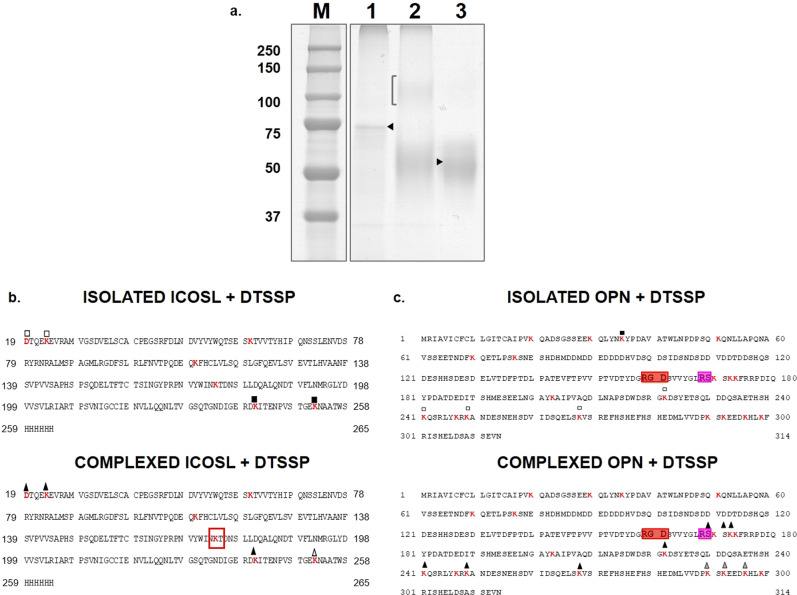
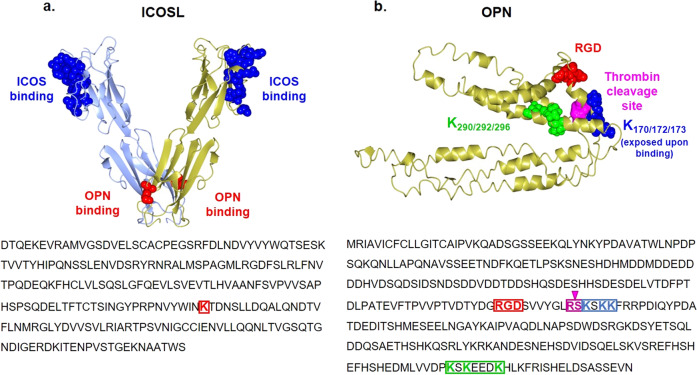
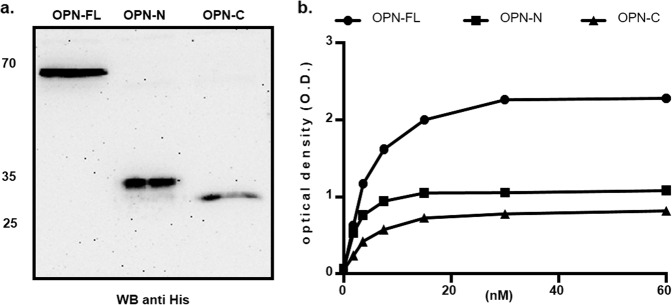
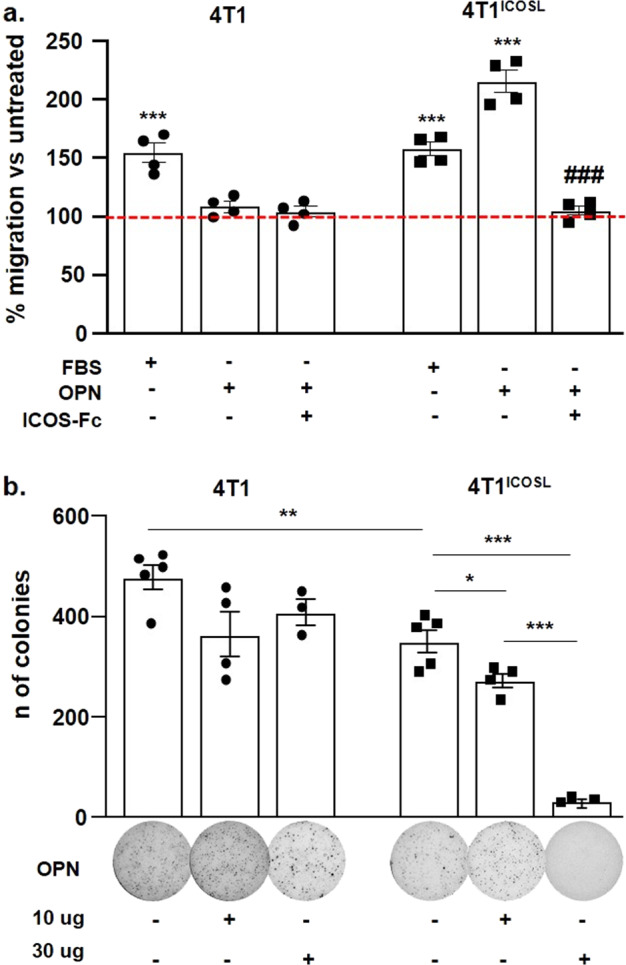
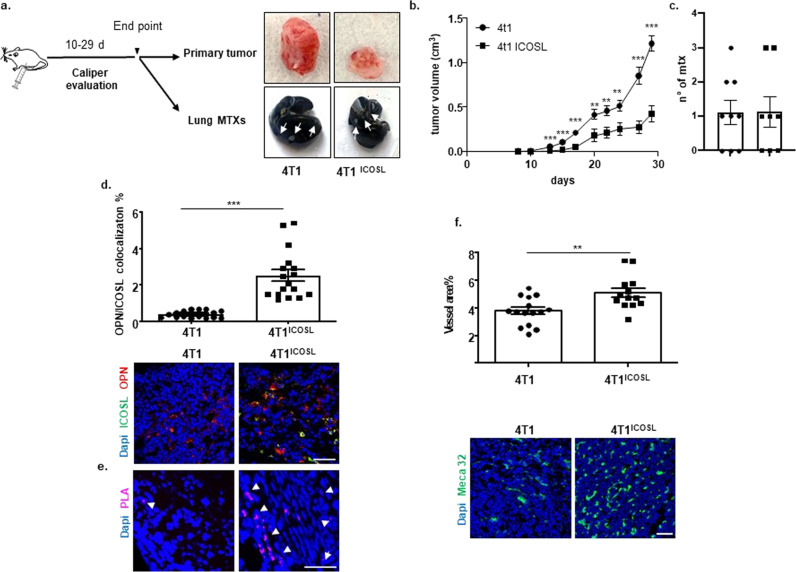
ICOSL/ICOS are costimulatory molecules pertaining to immune checkpoints; their binding transduces signals having anti-tumor activity. Osteopontin (OPN) is here identified as a ligand for ICOSL. OPN binds a different domain from that used by ICOS, and the binding induces a conformational change in OPN, exposing domains that are relevant for its functions. Here we show that in vitro, ICOSL triggering by OPN induces cell migration, while inhibiting anchorage-independent cell growth. The mouse 4T1 breast cancer model confirms these data. In vivo, OPN-triggering of ICOSL increases angiogenesis and tumor metastatization. The findings shed new light on ICOSL function and indicate that another partner beside ICOS may be involved; they also provide a rationale for developing alternative therapeutic approaches targeting this molecular trio.


Conflict of interest statement

A.C., U.D., C.D., E.B., and C.L.G. are listed as inventors on the patent PCT/IB2019/050154 “Novel anti-tumor therapeutic agents”. E.B., U.D., and C.L.G. are founders of an UPO Spinoff (NOVAICOS). All other authors declare no competing interests.

Figures

Fig. 1
Fig. 1. Expression of ICOSL is required for OPN-mediated cell migration and is blocked by ICOS-Fc.
a M14 and JR8 cell lines with high expression of ICOSL (ICOSLhigh), b PCF2 and A2058 cell lines with low ICOSL expression (ICOSLlow), and c A2058 ICOSLhigh-transfected cells were treated or not with ICOS-Fc (2 μg ml−1) and then plated onto the apical side of Matrigel-coated filters in 50 μl serum-free medium. The cells were allowed to migrate for 8 h to the lower chamber containing 10 μg ml−1 OPN or 20% FBS as chemotactic stimuli. The cells that migrated to the bottom of the filters were stained using crystal violet and all counted (quadruplicate filter) using an inverted microscope. Dotted line refers to untreated cells (NT). Data are expressed as the number of migrated cells per high-power field (***P < 0.001 refers baseline, ##P < 0.001 refers to OPN-induced migration (n = 5 technical replicate). d Relative quantification of ICOSL gene in silenced HUVEC using siRNA1 and siRNA2; cells treated with non-specific siRNA (SCR-siRNAscr) served as controls. Data are shown as gene expression relative to the expression of the endogenous control GAPDH (2−ΔCtmethod) and T test was used; **P < 0.01 (n = 3–4 technical replicate). e Assessment of migration of silenced HUVECs, via a Boyden chamber assay, in response to OPN and VEGF (***P < 0.001 refers to OPN-mediated migration in scr sample) (n = 7–8 technical replicate). f Schematic overview of the three different mutants of ICOSL generated. g ICOSL expression on transfected HeLa cells as assessed by flow cytometry. In the dot plots, gray, gray dotted, and black lines indicate the intracytoplasmic mutant (IC), the tailless mutant (TL), and the wild-type molecule (WT), respectively. The black filled histogram shows the negative control. h HeLa migration induced by OPN or FBS was assessed via a Boyden chamber assay. Cells migration was evaluated as described in a, b, and c (**P < 0.01 refers to baseline) (n = 5 technical replicate). All data are expressed as means ± standard error. For migration experiments one-way ANOVA with post-hoc Tukey multi-comparison test was used.
Fig. 2
Fig. 2. OPN binds the extracellular portion of ICOSL.
a ELISA-based interaction assay. Recombinant OPN was used as capture protein on 96 well plates and the binding of titrated amounts of soluble recombinant ICOSL-Fc was evaluated alone (black circle) or mixed 1:1; with ICOS-Fc (black square) or of ICOS-Fc alone (black triangle). Data are expressed as means ± standard error (n = 3 technical replicate). b Pull-down assay. Schematic presentation of the pull-down assay used to detect ICOSL/OPN binding, in which ICOSL-Fc was used as a Sepharose-bound bait protein incubated (first lane) with OPN. The second (ICOSL-Fc) and third lanes (OPN) represent the negative controls in which only one of the two interactors were present. The membrane was blotted with an anti-OPN polyclonal antibody. A representative immunoblot of two independent experiment is shown (uncropped blot is shown in Supplementary Fig. 6). c Proximity Ligation Assay (PLA) in mice kidneys. PLA signal (violet) shows protein-protein interactions between ICOSL and OPN; C57BL/6J and MRL/Lpr chosen as positive controls, while OPN-/- and ICOSL-/- as negative ones. Four images at a magnification of ×40 were analyzed for each sample, considering 3 mice per group (n = 3 biological replicate).
Fig. 3
Fig. 3. Conformational analysis of the OPN/ICOSL complex by limited proteolysis.
a SDS-PAGE of proteolytic mixture of OPN, ICOSL-Fc, and their complex, after 30 min of proteolysis with trypsin (left panel) and chymotrypsin (right panel). Lane M: molecular weight markers; lane 1: OPN (5 µg) digested with trypsin, E:S 1:5000; lane 2: OPN/ICOSL complex digested with trypsin, E:S 1:5000; lane 3: ICOSL (5 µg) digested with trypsin, E:S 1:100; lane 4: OPN (2 µg); lane 5: ICOSL (2 µg); lane 6: OPN (5 µg) digested with chymotrypsin, E:S 1:5000; lane 7: OPN–ICOSL 2:1 complex digested with chymotrypsin, E:S 1:5000; lane 8: ICOSL (5 µg) digested with chymotrypsin, E:S 1:100. b Sequence coverages obtained by tryptic mass mapping experiments performed on bands 1, 2, 3, 4, and 5 which were discriminant among isolated proteins and complex. In bold the regions mapped by LC-MS/MS analyses. RGD is boxed in red and Thrombin cleavage site in pink.
Fig. 4
Fig. 4. Conformational analysis of the OPN/ICOSL complex by cross-linking experiments.
a Non-reducing SDS-PAGE of DTSSP treated samples. Lane 1: GST-OPN; lane 2: complex GST-OPN–ICOSL; lane 3: ICOSL. The bracket indicates the presence of a faint band, migrating as per the electrophoretic mobility expected for the complex GST-OPN–ICOSL. ICOSL b and OPN c sequences with all lysine residues indicated in red, and lysines modified with squares and triangles, in both the isolated proteins (upper panels) and the complex (lower panels). Filled squares indicate lysines modified as dead-end by DTSSP; empty squares indicate those modified as dead-ends or intra-molecule cross-linking. Black triangles on OPN/ICOSL complex indicate lysines found modified in the complex, before and after the REDCAM reaction. Gray triangles represent lysines found modified only in the complex after the REDCAM reaction. Empty triangles are lysines found modified only before the REDCAM reaction. RGD is boxed in green and thrombin cleavage site in orange.
Fig. 5
Fig. 5. Conformational analysis of the OPN/ICOSL complex.
a Model for ICOSL created with the SWISS-MODEL server using 4f9p.1.A (CD277/Butyrophilin-3) as a template. Residues buried at the interface with ICOS are blue stained, K174 is red stained. b OPN is an intrinsically disordered protein that simultaneously exhibits extended, random coil-like conformations and stable, cooperatively-folded conformations. OPN model from Dianzani et al., 2017. RGD in red, K170, K172, and K172 in blue, while K290, K292, and K296 are in green. Thrombin cleavage site (RS) is shown in pink.
Fig. 6
Fig. 6. ICOSL binds both the N-term and the C-term thrombin-generated fragments of OPN.
a Western blot showing the OPN recombinant proteins (FL: full length, N and C-terminal fragments) probed with the anti-His-tag antibody (uncropped blot is shown Supplementary Fig. 6); b ELISA-based interaction assay. The graph shows the interaction of titrated amounts of soluble ICOSL-Fc with a fixed amount of OPN-FL, OPN N- or C-fragments coated on the plate. (black circle) shows OPN full length, (black square) OPN-N and (black triangle) OPN-C. Data are expressed as means ± standard error (n = 3 technical replicates).
Fig. 7
Fig. 7. ICOSL expression promotes tumor-cell migration while inhibiting anchorage-independent cell growth.
a Migration assay of 4T1 and 4TICOSL cells in response to OPN or ICOS-Fc, assessed via a Boyden chamber assay. 4T1 and 4TICOSL cells were plated onto the apical side of Matrigel-coated filters in 50 μl serum-free medium in the presence or not of ICOS-Fc (2 μg ml−1). OPN or FBS loaded in the basolateral chamber as chemotactic stimulus. The cells that migrated to the bottom of the filters were stained with crystal violet and all counted (quadruplicates filters) using an inverted microscope. The dotted line refers to untreated cells (NT). Data are expressed as the number of migrated cells per high-power field, ***P < 0.001 refers to baseline, ###P < 0.001 refers to OPN-induced migration, one-way ANOVA with the post-hoc Tukey multi-comparison test was used (n = 4 technical replicate); b Anchorage-independent growth soft agar assay of 4T1 and 4T1ICOSL transfected cells in response to OPN or PBS (NT). Colonies were counted using Image J Software. The images from one representative experiment are also shown. Please note that images are not fully self-explanatory of each histogram. For the comparison of 4T1 vs 4T1ICOSL cells, the T test was used. For the comparison of 4T1ICOSL, 4T1ICOSL + OPN one-way ANOVA with the post-hoc Tukey multi-comparison test was used (*P < 0.05, ** P < 0.01, *** P < 0.001). (n = 3–5 technical replicate). All data are expressed as means ± standard error.
Fig. 8
Fig. 8. OPN/ICOSL binding modulates tumor growth, angiogenesis, and metastatization in vivo.
a Schematic illustration of experimental in vivo approach and images of excised 4T1and 4TICOSL tumors, where white arrows indicate metastases. b Primary tumor growth of 4T1 cells in comparison with 4TICOSL cells. 0.1 × 106 4T1 and 4T1ICOSL cells were subcutaneously injected into the mammary fat pad of Balb/c mice (n = 8–9 biological replicate per group). Tumor growth was monitored using a caliper by measuring tumor size in 3 cross-directions. The Mann–Whitney test was used to compare differences in tumor growth between the two groups per day, **P < 0.01, ***P < 0.001. c Numbers of 4T1 and 4T1ICOSL tumor lung metastases at the end point (day 29). d OPN and ICOSL protein level and localization were evaluated by confocal analysis. Images were quantified using ImageJ software which permits to calculate the ratio between red (OPN) and green (ICOSL) channels; values are expressed as percentage of red-green co-staining. Dot plot shows OPN and ICOSL fluorescence intensity colocalization (3–4 biological replicate) and the Mann–Whitney test was used. e PLA on primary tumor specimens showing OPN–ICOSL interaction. f As assessed by confocal analysis of Meca32 immunostaining, vessel density in 4T1ICOSL tumors was significantly increased (by 26%) compared with wild-type 4T1. The percentage of surface area occupied by vessels was quantified as Meca32 positive staining. Results have been analyzed using unpaired Mann–Whitney U test. Scale bars: 50 μm (n = 3–4 biological replicate). Four images at a magnification of ×40 were analyzed for each sample, considering three mice per treatment group. All data are expressed as means ± standard error.

References

    1. Buonfiglio D, et al. Characterization of a novel human surface molecule selectively expressed by mature thymocytes, activated T cells and subsets of T cell lymphomas. Eur. J. Immunol. 1999;29:2863–2874. doi: 10.1002/(SICI)1521-4141(199909)29:09<2863::AID-IMMU2863>3.0.CO;2-W. - DOI - PubMed
    1. Hutloff A, et al. ICOS is an inducible T-cell co-stimulator structurally and functionally related to CD28. Nature. 1999;397:263–266. doi: 10.1038/16717. - DOI - PubMed
    1. Redoglia V, et al. Characterization of H4: a mouse T lymphocyte activation molecule functionally associated with the CD3/T cell receptor. Eur. J. Immunol. 1996;26:2781–2789. doi: 10.1002/eji.1830261134. - DOI - PubMed
    1. Dianzani C, et al. B7h triggering inhibits the migration of tumor cell lines. J. Immunol. 2014;192:4921–4931. doi: 10.4049/jimmunol.1300587. - DOI - PubMed
    1. Swallow MM, Wallin JJ, Sha WC. B7h, a novel costimulatory homolog of B7.1 and B7.2, is induced by TNFalpha. Immunity. 1999;11:423–432. doi: 10.1016/S1074-7613(00)80117-X. - DOI - PubMed

Publication types