. 2021 Jan;5(1):92-100.
doi: 10.1038/s41559-020-01320-z. Epub 2020 Oct 26.

Timing the origin of eukaryotic cellular complexity with ancient duplications

Affiliations

Timing the origin of eukaryotic cellular complexity with ancient duplications

Julian Vosseberg et al. Nat Ecol Evol. 2021 Jan.

Abstract

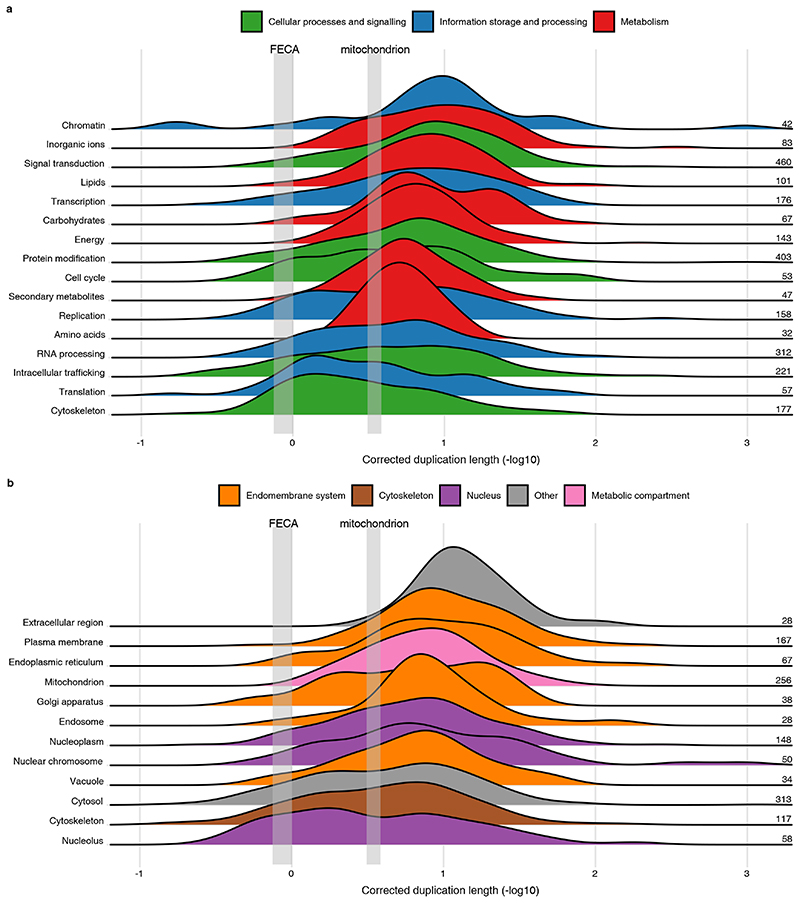
Eukaryogenesis is one of the most enigmatic evolutionary transitions, during which simple prokaryotic cells gave rise to complex eukaryotic cells. While evolutionary intermediates are lacking, gene duplications provide information on the order of events by which eukaryotes originated. Here we use a phylogenomics approach to reconstruct successive steps during eukaryogenesis. We find that gene duplications roughly doubled the proto-eukaryotic gene repertoire, with families inherited from the Asgard archaea-related host being duplicated most. By relatively timing events using phylogenetic distances, we inferred that duplications in cytoskeletal and membrane-trafficking families were among the earliest events, whereas most other families expanded predominantly after mitochondrial endosymbiosis. Altogether, we infer that the host that engulfed the proto-mitochondrion had some eukaryote-like complexity, which drastically increased upon mitochondrial acquisition. This scenario bridges the signs of complexity observed in Asgard archaeal genomes to the proposed role of mitochondria in triggering eukaryogenesis.


Conflict of interest statement

Competing interests

The authors declare no competing interests.

Figures

Extended Data Fig. 1
Extended Data Fig. 1. Estimating the number of LECA genes from the number of Pfam domains with linear regression.
Scatter plot showing the number of Pfam domains and protein-coding genes in present-day eukaryotes, with each dot representing one genome. The regression line (black) and its 95% confidence (filled grey) and prediction intervals (dashed grey) are depicted. The vertical line corresponds to the obtained number of LECA Pfam domains.
Extended Data Fig. 2
Extended Data Fig. 2. Effect of a different phylogenetic position of the eukaryotic root.
a, Number of inferred LECA families considering different root positions. These numbers are based on phylogenetic trees from Pfams that are only present in eukaryotes. Besides the Opimoda and Diphoda groups, two other group definitions were used to identify bidirectional best hits (BBHs) and select sequences for tree inference. Names of root positions indicate either the lineage at one side of the root or the position of the split (ADis-DiaM: Amorphea+Discoba – Diaphoretickes+Metamonada; AM-DiaDis: Amorphea+Metamonada – Diaphoretickes+Discoba). Excavate sequences, especially from Metamonada species, are rarely involved in BBHs, unless specifically searched for (Excavata in BBHs 5 groups; Discoba and Metamonada in BBHs 4 groups). b, Distribution of duplication lengths obtained using different root positions for eukaryote-only trees based on the four group BBHs. The difference between distributions is not statistically significant according to the Kruskal-Wallis test.
Extended Data Fig. 3
Extended Data Fig. 3. Fraction of LECA families resulting from inventions.
a, Contribution of inventions to LECA families performing different functions. 82% of pairwise comparisons were significantly different (Supplementary Fig. 3). b, Fraction of LECA families resulting from either an invention or duplication – a eukaryotic innovation – according to functional category. 84% of pairwise comparisons were significantly different (Supplementary Fig. 5). c, Contribution of inventions to LECA families performing their function in different cellular components. 51% of pairwise comparisons were significantly different (Supplementary Fig. 4). d, Fraction of LECA families resulting from an innovation according to cellular localisation. 74% of pairwise comparisons were significantly different (Supplementary Fig. 6). a-d, Dashed lines indicate the overall invented or innovated fraction.
Extended Data Fig. 4
Extended Data Fig. 4. Phylogenetic origin of acquired Pfams.
a, b, Phylogeny of the prokaryotes (a) and Asgard archaea (b) present in our dataset based on the NCBI taxonomy. The branch widths and numbers indicate the number of acquisitions from a group. c, Number of acquisitions from different alphaproteobacterial orders or a combination of multiple orders (‘Alphaproteobacteria’).
Extended Data Fig. 5
Extended Data Fig. 5. Effect of duplications on branch lengths.
a, b, Distribution of alphaproteobacterial (a) and Asgard archaeal (b) stem lengths (sl’s) for acquisitions without and with duplications. Two alphaproteobacterial sl’s from acquisitions with Magnetococcales as sister group were removed based on the previously inferred phylogenetic position of mitochondria8. c, d, Distribution of Asgard archaeal sl’s for information storage and processing (c) and cellular processes and signalling families (d), comparing those without and with duplications. Upon removal of the outliers, the difference in cellular processes and signalling families no longer reached statistical significance. e, Distribution of Asgard archaeal sl’s for duplicated acquisitions, in which homomer-to-heteromer transitions had occurred compared to the other duplicated acquisitions. f, Distribution of vertebrate sl’s for families without and with duplications. g, Distribution of duplication lengths (dl’s) grouped according to the lineage in which the duplication occurred. All pairwise comparisons were significantly different (Mann-Whitney U tests). h, Distribution of differences in log-transformed dl values for all pairwise comparisons between chordate duplications according to age and functional annotation. All groups are significantly different (Mann-Whitney U tests). a-f, P values of Mann-Whitney U tests are shown. c-e, The minimal sl via each duplication node is plotted.
Extended Data Fig. 6
Extended Data Fig. 6. Effect of branch length normalisation and functional divergence.
a, Ridgeline plot showing the distribution of uncorrected stem (rsl) or duplication lengths (rdl). Numbers indicate the number of acquisitions or duplications for which the branch lengths were included. The low peaks at very short branch lengths are an artefact from near-zero branch lengths. Groups are ordered based on the median value of rsl’s and rdl’s. b, Ridgeline plot showing the distribution of sls for non-duplicated acquisitions that share the same functional annotation of the prokaryotic sister group and are therefore expected to have undergone little functional divergence during eukaryogenesis. a, b, Branch lengths are depicted as the additive inverse of the log-transformed values. Pairwise comparisons that did not give a significant P value (Mann-Whitney U tests) are shown.
Fig. 1
Fig. 1. Characterisation of duplications during eukaryogenesis.
a, Density plot showing the distribution of the number of Pfam domains in present-day prokaryotes (green) and eukaryotes (purple) in comparison with the acquisition, invention and LECA estimates obtained from phylogenetic trees (see inset). b, Number of acquisitions or inventions that gave rise to a particular number of LECA families, demonstrating the skewedness of duplications across protein families. c, Odds of duplication for LECA families according to KOG functional categories. 81% of pairwise comparisons were significantly different (Supplementary Fig. 1). The poorly characterised categories and functions of very few families (cell motility, extracellular structures and nuclear structure) are not depicted. d, Odds of duplication for LECA families according to cellular localisation. 54% of pairwise comparisons were significantly different (Supplementary Fig. 2). c-d, Numbers on the right side indicate the number of LECA families and dashed lines indicate the odds of all LECA families in total.
Fig. 2
Fig. 2. Contribution of different phylogenetic origins to duplications during eukaryogenesis.
a, Duplication tendency as fraction of clades having undergone at least one duplication. b, Multiplication factors, defined as the number of LECA families divided by the number of acquisitions or inventions. These numbers are shown beside the corresponding bar. a, b, Dashed lines indicate the duplication tendency and multiplication factor for all acquisitions and LECA families. The four (a) and three (b) pairwise comparisons that did not give a significant P value (χ2 contingency table test) are shown. Prokaryotic: unclear prokaryotic ancestry (could not be assigned to a domain or lower taxonomic level).
Fig. 3
Fig. 3. Timing of acquisitions and duplications from different phylogenetic origins during eukaryogenesis.
Ridgeline plot showing the distribution of corrected stem or duplication lengths, depicted as the additive inverse of the log-transformed values. Consequently, longer branches have a smaller value and vice versa. For clarity, a peak of near-zero branch lengths is not shown (see Extended Data Fig. 6). Numbers indicate the number of acquisitions or duplications for which the branch lengths were included. Groups of stem and duplication lengths are ordered based on the median value. The tree illustrates how the stem and duplication lengths were calculated; the symbols and colour schemes are identical to Fig. 1a. The phylogenetic distances between the acquisition or duplication and LECA were normalised by dividing it by the median branch length between LECA and the eukaryotic terminal nodes. In case of duplications the shortest of the possible normalised paths was used. Pairwise comparisons that did not give a significant P value (Mann-Whitney U test) are shown.
Fig. 4
Fig. 4. Timing of duplications during eukaryogenesis according to function and localisation.
a, b, Ridgeline plots showing the distribution of duplication lengths for different functional categories (a) and cellular localisations (b). To enable a comparison with the timing of acquisitions, the binomial-based 95% confidence interval of the median of the Asgard archaeal (FECA) and alphaproteobacterial stem lengths (mitochondrion) are depicted in grey, indicating the divergence of eukaryotes from their Asgard archaea-related and Alphaproteobacteria-related ancestors, respectively. Groups are ordered based on the median value. For significant differences between groups, see Supplementary Fig. 7–8.

References

    1. Dacks JB, et al. The changing view of eukaryogenesis – fossils, cells, lineages and how they all come together. J Cell Sci. 2016;129:3695–3703. - PubMed
    1. Shiratori T, Suzuki S, Kakizawa Y, Ishida K. Phagocytosis-like cell engulfment by a planctomycete bacterium. Nat Commun. 2019;10:1–11. - PMC - PubMed
    1. Koumandou VL, et al. Molecular paleontology and complexity in the last eukaryotic common ancestor. Crit Rev Biochem Mol Biol. 2013;48:373–396. - PMC - PubMed
    1. Szathmáry E. Toward major evolutionary transitions theory 2.0. Proc Natl Acad Sci U S A. 2015;112:10104–10111. - PMC - PubMed
    1. Spang A, et al. Complex archaea that bridge the gap between prokaryotes and eukaryotes. Nature. 2015;521:173–179. - PMC - PubMed

Publication types