. 2020 Nov;52(11):1219-1226.
doi: 10.1038/s41588-020-00710-0. Epub 2020 Oct 26.

Cancer therapy shapes the fitness landscape of clonal hematopoiesis

Kelly L Bolton  1 Ryan N Ptashkin #  2 Teng Gao #  3 Lior Braunstein  4 Sean M Devlin  5 Daniel Kelly  6 Minal Patel  7 Antonin Berthon  3 Aijazuddin Syed  2 Mariko Yabe  8 Catherine C Coombs  9 Nicole M Caltabellotta  7 Mike Walsh  10 Kenneth Offit  10 Zsofia Stadler  11 Diana Mandelker  2 Jessica Schulman  7 Akshar Patel  7 John Philip  12 Elsa Bernard  3 Gunes Gundem  3 Juan E Arango Ossa  7 Max Levine  13 Juan S Medina Martinez  13 Noushin Farnoud  7 Dominik Glodzik  3 Sonya Li  10 Mark E Robson  10 Choonsik Lee  14 Paul D P Pharoah  15   16 Konrad H Stopsack  10 Barbara Spitzer  13 Simon Mantha  17 James Fagin  10   18 Laura Boucai  19 Christopher J Gibson  20 Benjamin L Ebert  20 Andrew L Young  21 Todd Druley  22 Koichi Takahashi  23 Nancy Gillis  24   25 Markus Ball  25   26 Eric Padron  25 David M Hyman  10   27 Jose Baselga  28 Larry Norton  10   27 Stuart Gardos  10   27 Virginia M Klimek  10   27 Howard Scher  10   27 Dean Bajorin  10   27 Eder Paraiso  19   29 Ryma Benayed  2 Maria E Arcila  2 Marc Ladanyi  2 David B Solit  10   19   30 Michael F Berger  2   19   30 Martin Tallman  1 Montserrat Garcia-Closas  14 Nilanjan Chatterjee  31 Luis A Diaz Jr  10   32   33 Ross L Levine  1 Lindsay M Morton  14 Ahmet Zehir #  34 Elli Papaemmanuil #  35
Affiliations

Cancer therapy shapes the fitness landscape of clonal hematopoiesis

Kelly L Bolton et al. Nat Genet. 2020 Nov.

Abstract

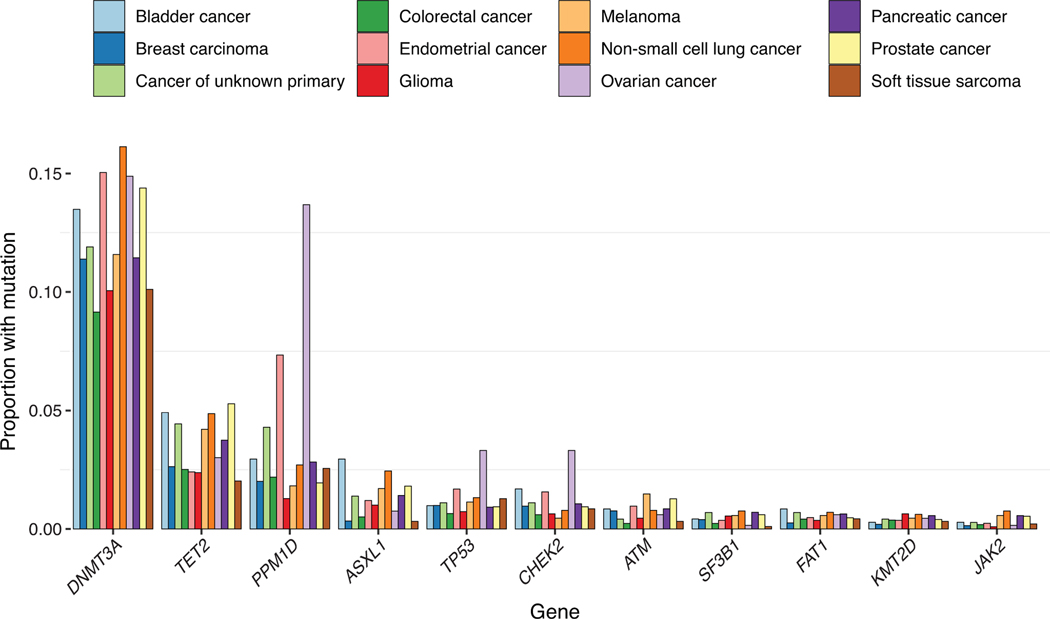
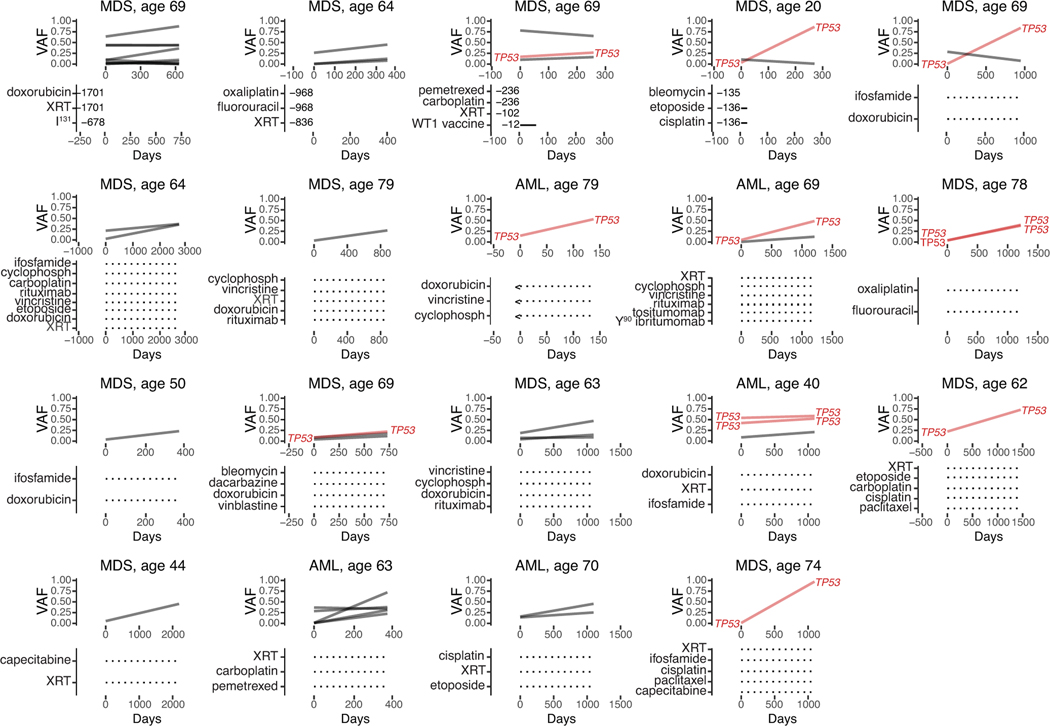
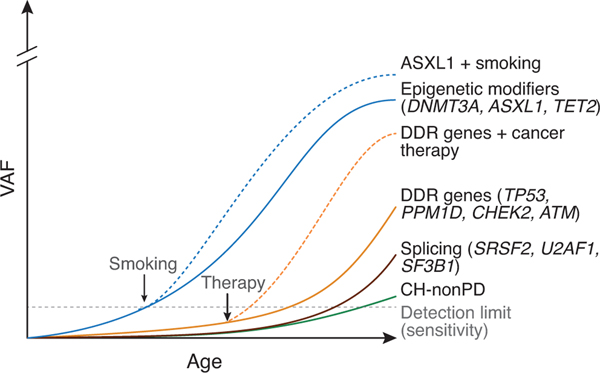
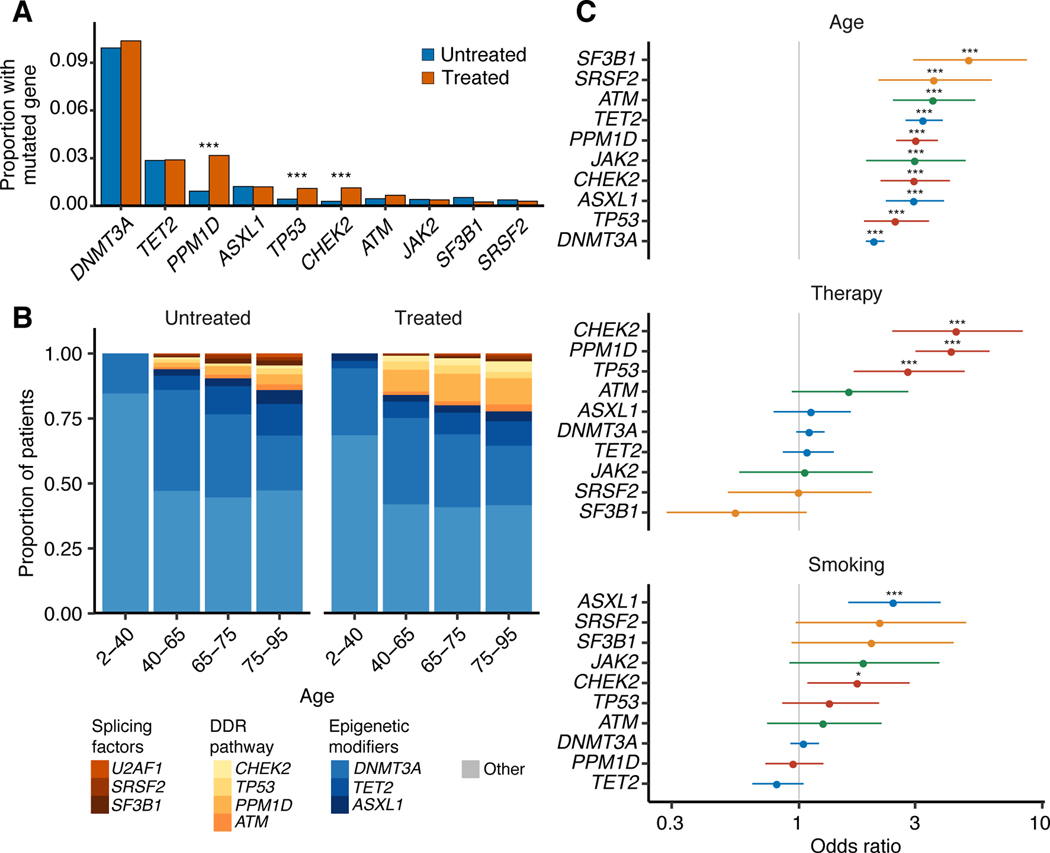
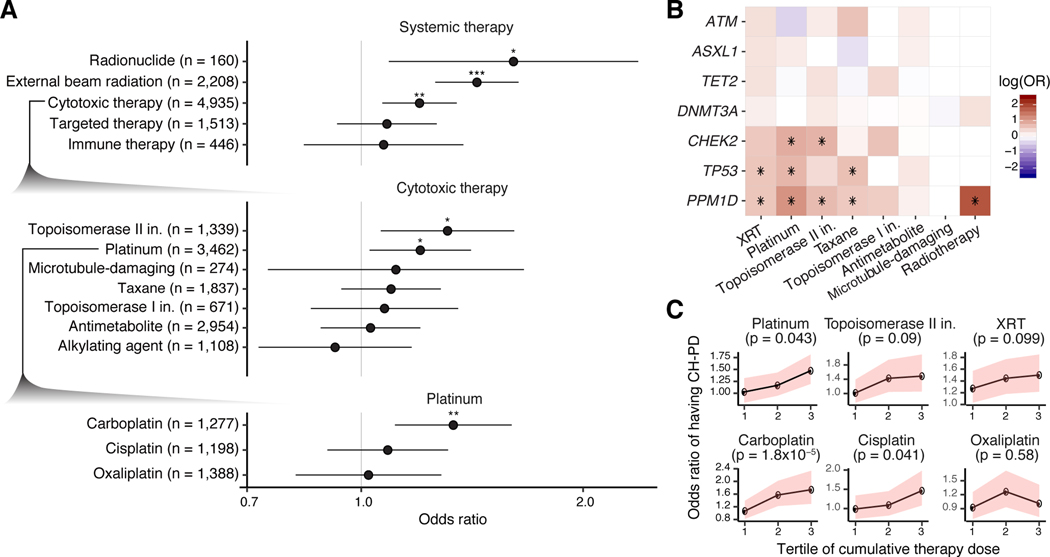
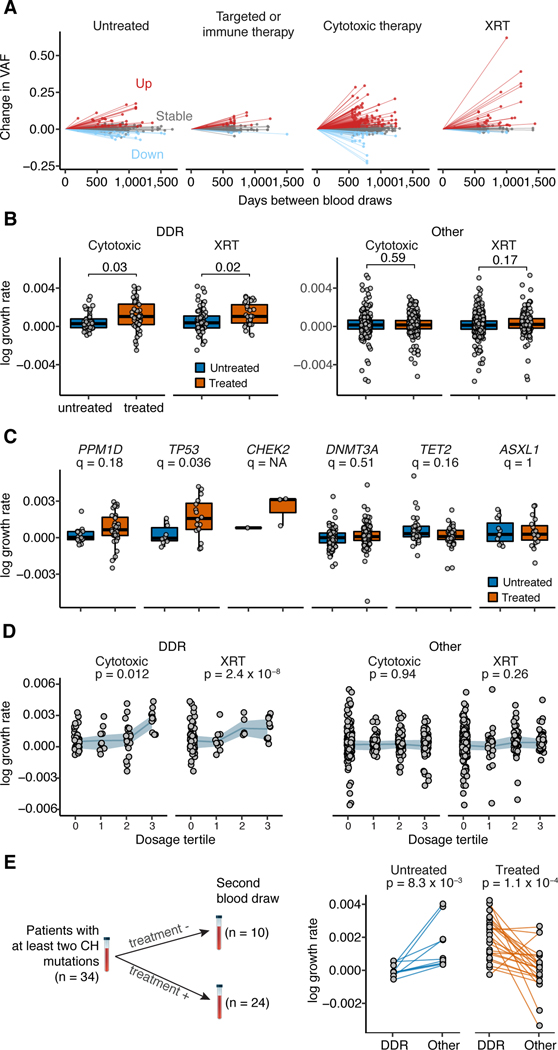
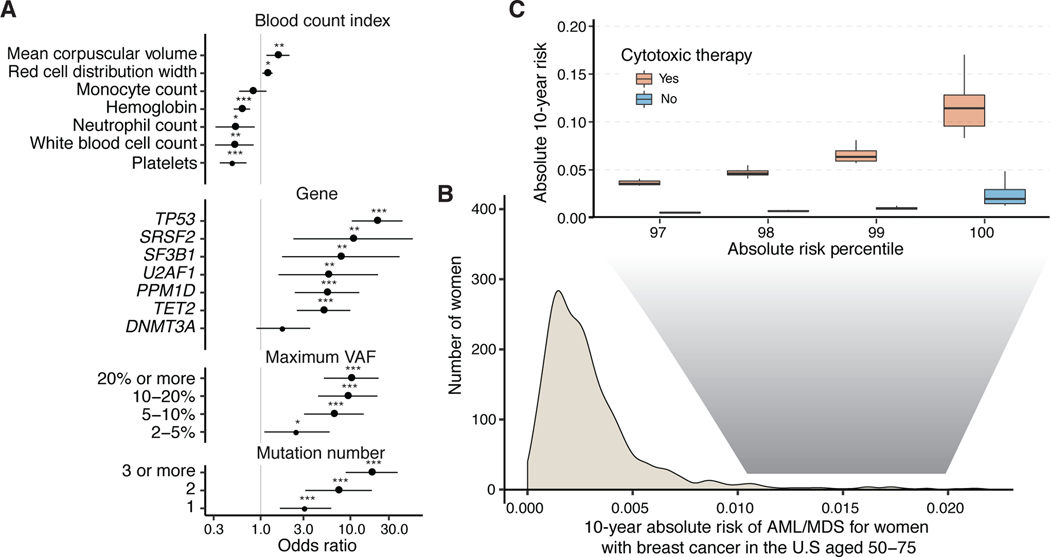
Acquired mutations are pervasive across normal tissues. However, understanding of the processes that drive transformation of certain clones to cancer is limited. Here we study this phenomenon in the context of clonal hematopoiesis (CH) and the development of therapy-related myeloid neoplasms (tMNs). We find that mutations are selected differentially based on exposures. Mutations in ASXL1 are enriched in current or former smokers, whereas cancer therapy with radiation, platinum and topoisomerase II inhibitors preferentially selects for mutations in DNA damage response genes (TP53, PPM1D, CHEK2). Sequential sampling provides definitive evidence that DNA damage response clones outcompete other clones when exposed to certain therapies. Among cases in which CH was previously detected, the CH mutation was present at tMN diagnosis. We identify the molecular characteristics of CH that increase risk of tMN. The increasing implementation of clinical sequencing at diagnosis provides an opportunity to identify patients at risk of tMN for prevention strategies.


Conflict of interest statement

COMPETING INTEREST DECLARATION

The remaining authors declare no competing interests.

Figures

Extended Data Figure 1.
Extended Data Figure 1.. Distribution of cancer therapy received prior to blood collection for sequencing.
A) Frequency of patients receiving systemic therapy or external beam radiation therapy by primary tumor type. B) Frequency of patients receiving specific classes of systemic therapy by primary tumor type. C) Frequency of patients receiving top ten subclasses of cytotoxic therapy. Most patients (91%) who received at least one of these cytotoxic therapy classes received multiple classes.
Extended Data Figure 2.
Extended Data Figure 2.. Association between primary tumor site and CH-PD.
Odds ratios (circle) and 95% confidence intervals for CH-PD in selected primary tumor types with at least 100 subjects compared to breast cancer (n=3540) in a logistic regression model adjusted for age. * p<0.05, ** p<0.01, *** p<0.001.
Extended Data Figure 3.
Proportion of patients with common CH-PD mutations by primary tumor sites. Genes mutated in at least 75 individuals and the top 12 primary tumor sites are shown.
Extended Data Figure 4.
Extended Data Figure 4.. Variant frequencies (VAF) at time of pre-tMN testing and tMN diagnosis.
Plots show changes in mutational frequencies in relation to cancer therapy exposure in 19 CH cases. Below each graph are listed treatments received prior to pre-tMN testing and the number of days between the end of treatment and the pre-tMN sample.
Extended Data Figure 5.
Extended Data Figure 5.. Differences in the fitness effect of CH mutations and the environment shape clonal dominance over an individual’s lifetime.
Conceptual graph illustrating how associations between specific exposures and CH mutations may shape clonal dominance over an individual’s lifetime. AML, acute myeloid leukemia; cyclophosph, cyclophosphamide; MDS, myelodysplastic syndrome.
Figure 1.
Figure 1.. Specific molecular subtypes of CH-PD correlate with age, prior therapy exposure and smoking history.
(A) Proportion of patients with CH-PD mutations in specific genes among treated and untreated patients. Multivariable logistic regression was used to test whether the odds of having a specific gene mutated differed between treated (n=5,978) and untreated (n=4,160) patients after adjustment for age, gender, smoking and ethnicity. * p<0.05, ** p<0.01, *** p<0.001 (B) Among patients with CH-PD, the proportion with mutations in specific genes, by age group and treatment status. (C) Odds ratio with 95% confidence interval for CH-PD mutation in the ten most commonly mutated genes with top, increasing age (n=10,138); middle, for patients previously exposed to cancer therapy (n=5,978) compared to those with no exposure (n=4160); bottom, for current/former smokers (n=4,989) compared to non-smokers (n=5,145) in multivariable logistic regression models adjusted for therapy, smoking, ethnicity, age, gender and time from diagnosis to blood draw. *, q-value (FDR-corrected p-value) <0.05, ** q<0.01, *** q<0.001. Age is expressed as the mean centered values.
Figure 2.
Figure 2.. Association between CH-PD and prior exposure to cancer therapy.
(A) Odds ratios (OR) and 95% confidence intervals for CH-PD and specific classes of cancer therapy in multivariable logistic regression adjusted for each other, smoking, ethnicity, gender and time from diagnosis to blood draw. Top, OR for broad classes of cancer therapy; middle. OR between CH-PD and prior exposure to subclasses of cytotoxic therapy; bottom, OR between CH-PD and exposure to specific platinum-based drugs. (B) OR between prior receipt of cancer therapy and CH-PD stratified by tertile of cumulative exposure for the agent. Multivariable logistic regression was used adjusted as in (A) but with cumulative weight-adjusted dose of systemic therapy classes and cumulative radiation dose (as expressed in EQD2. The p-trend was calculated to test for association between CH and increasing tertiles of cumulative cancer therapy exposure among those who received the therapy in the multivariable model. Shaded bands indicate 95% confidence intervals. (C) Heatmap showing the log(OR) between CH-PD in specific genes and prior exposure to the major classes of cytotoxic therapy and radiation therapy in logistic regression models adjusted for therapy subclass, smoking, ethnicity, gender and time from diagnosis to blood draw. * q (FDR-corrected p-value) <0.05, ** q<0.01, *** q<0.001.
Figure 3.
Figure 3.. Clonal evolution of CH mutations under the selective pressure of cancer therapy.
(A) Change in VAF for CH mutations from initial to follow-up sequencing for patients stratified by type of therapy received during the follow-up period. XRT, external beam radiation. (B) Change in growth rate for DDR and non-DDR CH mutations among those who received XRT (n=167) or cytotoxic therapy (n=285) during the follow-up period. Shown are the p-values generated from t-tests comparing the growth rate of CH mutations among patients exposed to either of these therapies compared to untreated patients. (C) Change in growth rate for specific CH mutations stratified by whether patients received cytotoxic or radiation therapy (n=268) or no therapy (n=177) during the follow-up period. Shown are the FDR-corrected p-values (q-value) from a t-test comparing the growth rate of mutations in treated and untreated patients. (D) Change in growth rate for DDR and non-DDR CH mutations stratified by tertile of cumulative exposure to cytotoxic therapy and XRT. Shown are the p-values for a trend test for increasing growth rate of CH with increasing tertile of therapy exposure using generalized linear regression adjusted for age, gender and smoking. Shaded bands indicate interquartile ranges. Intra-subject competition between DDR and non-DDR CH mutations. Connecting lines show the difference in growth rate between DDR vs. other genes in patients who received XRT or cytotoxic therapy vs. those who did not receive such therapy during the follow-up period. A paired t-test was used to test for significance in the difference between growth rates of DDR and non-DDR CH mutations within individuals. All p-values are two-sided.
Figure 4.
Figure 4.. Risk of AML or MDS by clinical and CH-PD mutational characteristics in patients with solid tumors.
(A) Hazard ratio and 95% confidence intervals from Cox regression for blood count indexes, and CH-PD mutational characteristics for therapy-related myeloid neoplasms (tMN; AML or MDS, n=75). All models were adjusted for age and gender and stratified by study center. Blood counts are expressed as the mean centered score (the OR is per 1 SD of the blood count). * p<0.05, ** p<0.01, *** p<0.001. (B) Projected distribution of absolute 10-year risk of AML or MDS for women after a breast cancer diagnosis in the United States aged 50–75 at presentation based on our synthetic model. (C) Comparison of distribution of absolute 10-year risk of AML or MDS among women at the top percentiles of risk between those who go on to receive adjuvant cytotoxic chemotherapy and those who receive surgery only. n=9,437.

Comment in

References

    1. Armitage P & Doll R The Age Distribution of Cancer and a Multi-stage Theory of Carcinogenesis. British Journal of Cancer vol. 8 1–12 (1954). - PMC - PubMed
    1. Greaves M & Maley CC Clonal evolution in cancer. Nature 481, 306–313 (2012). - PMC - PubMed
    1. Alexandrov LB et al. The Repertoire of Mutational Signatures in Human Cancer. doi:10.1101/322859. - DOI - PMC - PubMed
    1. Sabarinathan R et al. The whole-genome panorama of cancer drivers. doi:10.1101/190330. - DOI
    1. Yates LR & Campbell PJ Evolution of the cancer genome. Nature Reviews Genetics vol. 13 795–806 (2012). - PMC - PubMed

METHODS-ONLY REFERENCES

    1. Cheng DT et al. Memorial Sloan Kettering-Integrated Mutation Profiling of Actionable Cancer Targets (MSK-IMPACT): A Hybridization Capture-Based Next-Generation Sequencing Clinical Assay for Solid Tumor Molecular Oncology. J. Mol. Diagn. 17, 251–264 (2015). - PMC - PubMed
    1. Schmieder R & Edwards R Quality control and preprocessing of metagenomic datasets. Bioinformatics 27, 863–864 (2011). - PMC - PubMed
    1. Tate JG et al. COSMIC: the Catalogue Of Somatic Mutations In Cancer. Nucleic Acids Res. 47, D941–D947 (2019). - PMC - PubMed
    1. Papaemmanuil E et al. Identification of Novel Somatic Mutations in SF3B1, a Gene Encoding a Core Component of RNA Splicing Machinery, in Myelodysplasia with Ring Sideroblasts and Other Common Cancers. European Journal of Cancer vol. 47 7 (2011).
    1. Campo E et al. WHO Classification of Tumours of Haematopoietic and Lymphoid Tissues. (IARC Who Classification of Tum, 2017).

Publication types

MeSH terms

Substances