. 2020 Dec;21(12):1496-1505.
doi: 10.1038/s41590-020-00813-0. Epub 2020 Oct 26.

A new neutrophil subset promotes CNS neuron survival and axon regeneration

Affiliations

A new neutrophil subset promotes CNS neuron survival and axon regeneration

Andrew R Sas et al. Nat Immunol. 2020 Dec.

Abstract

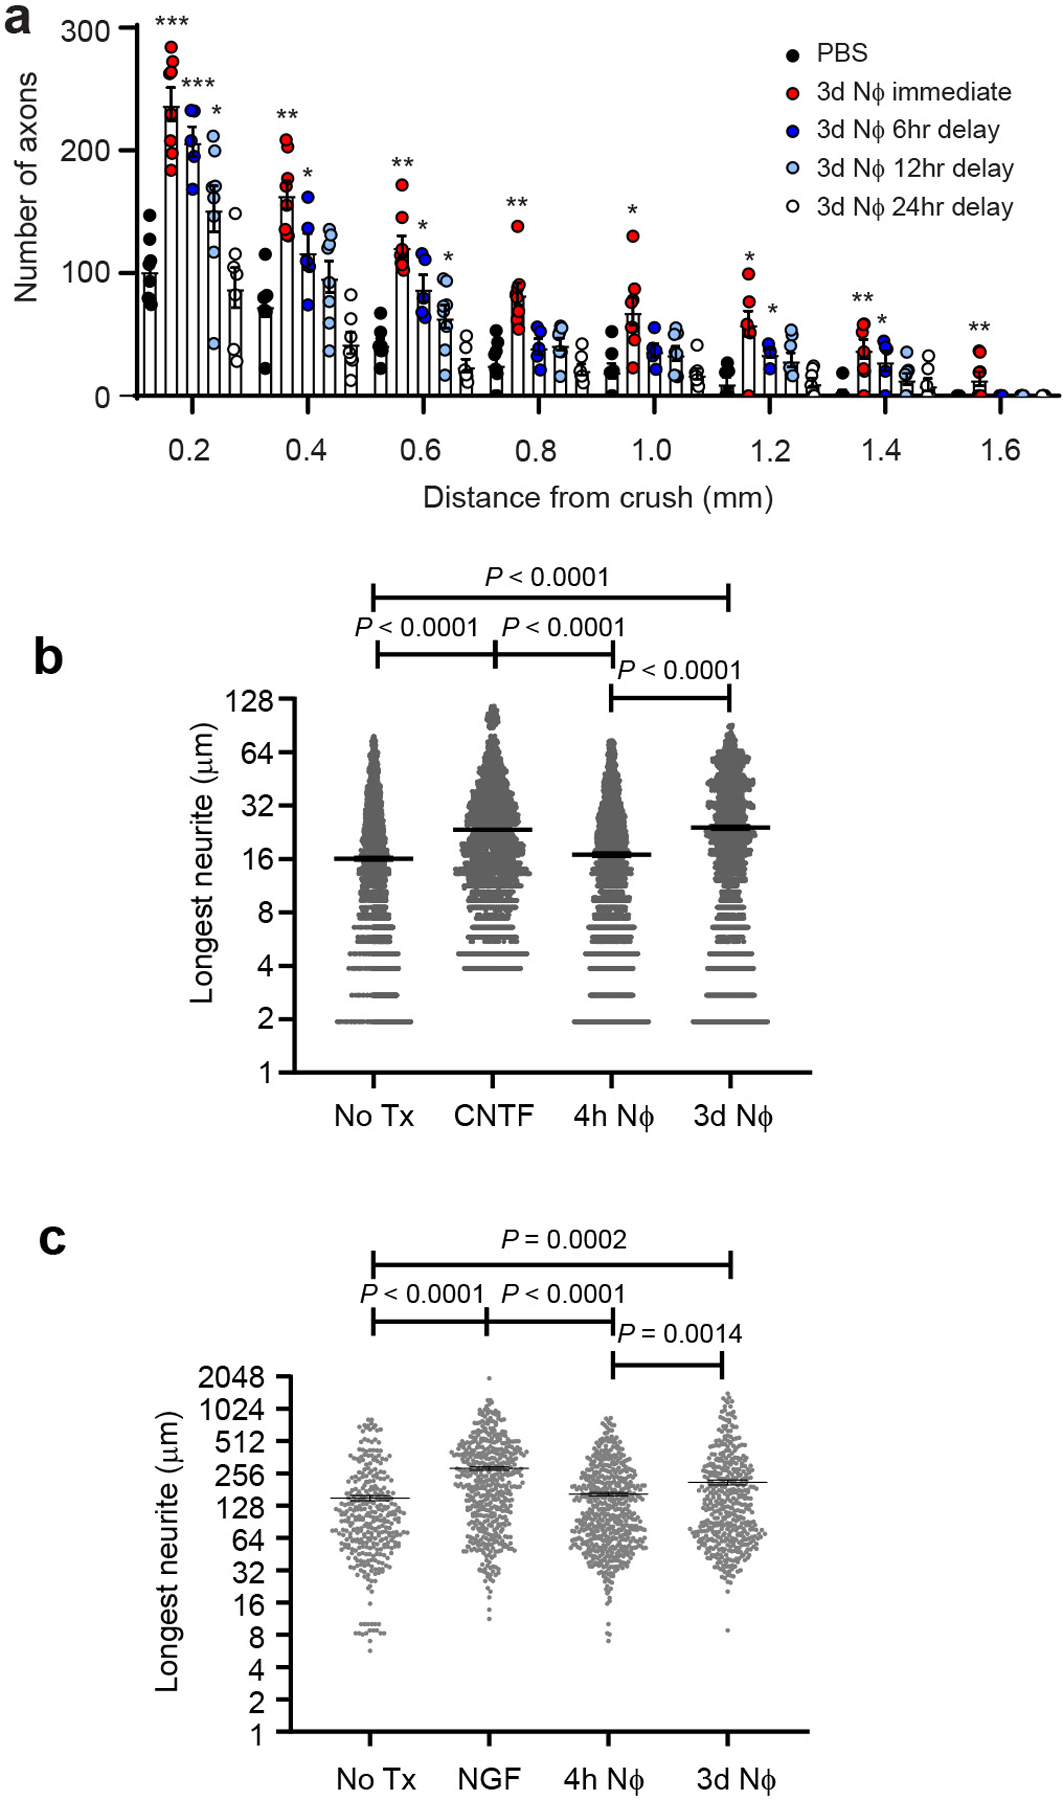
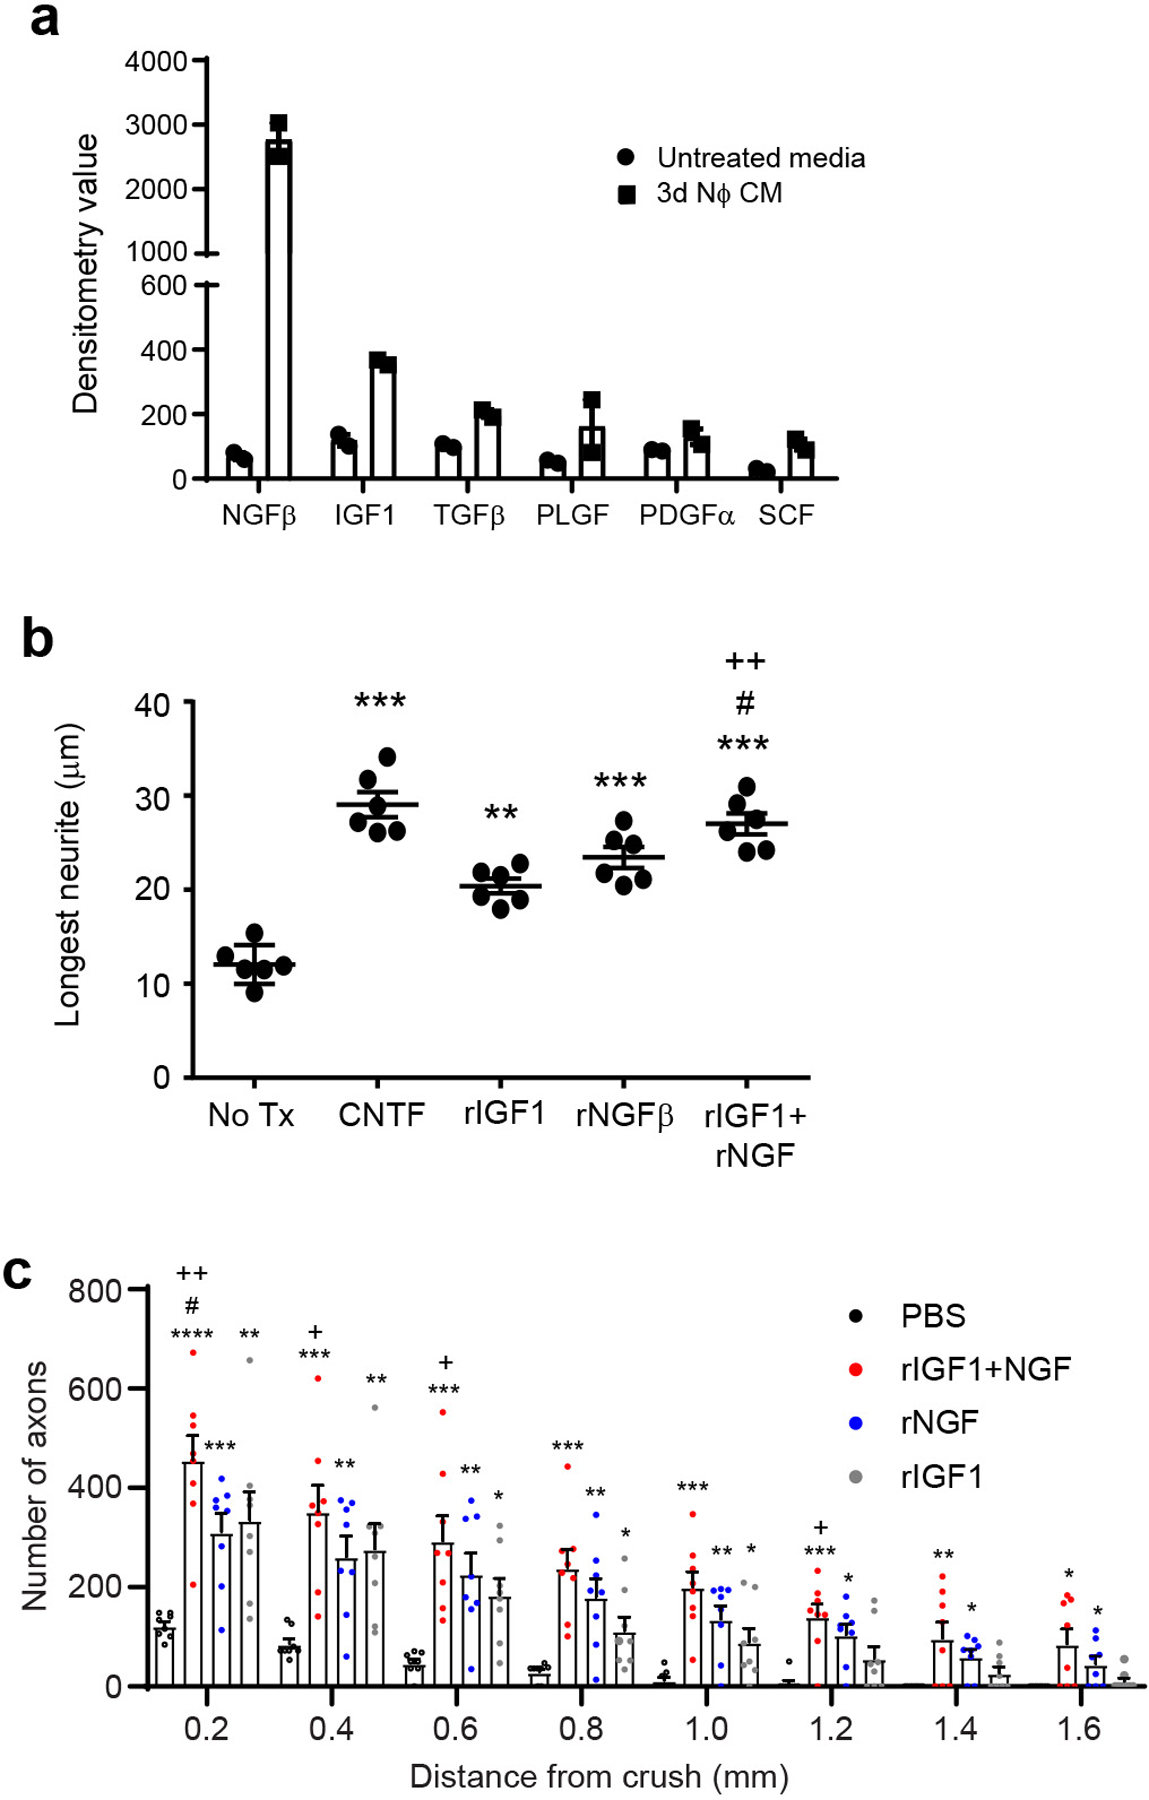
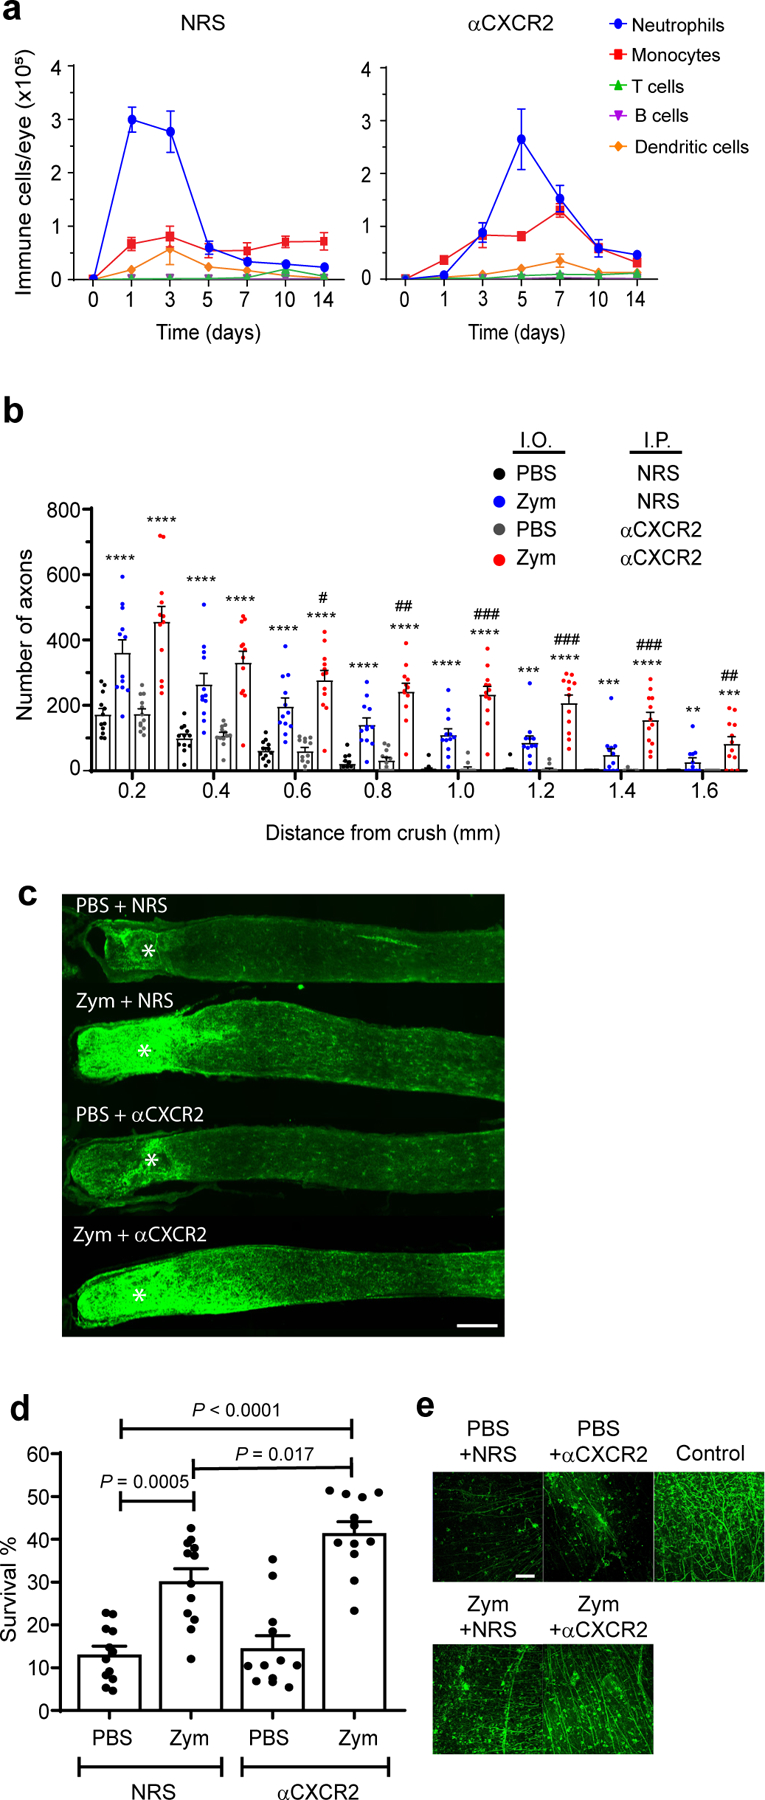
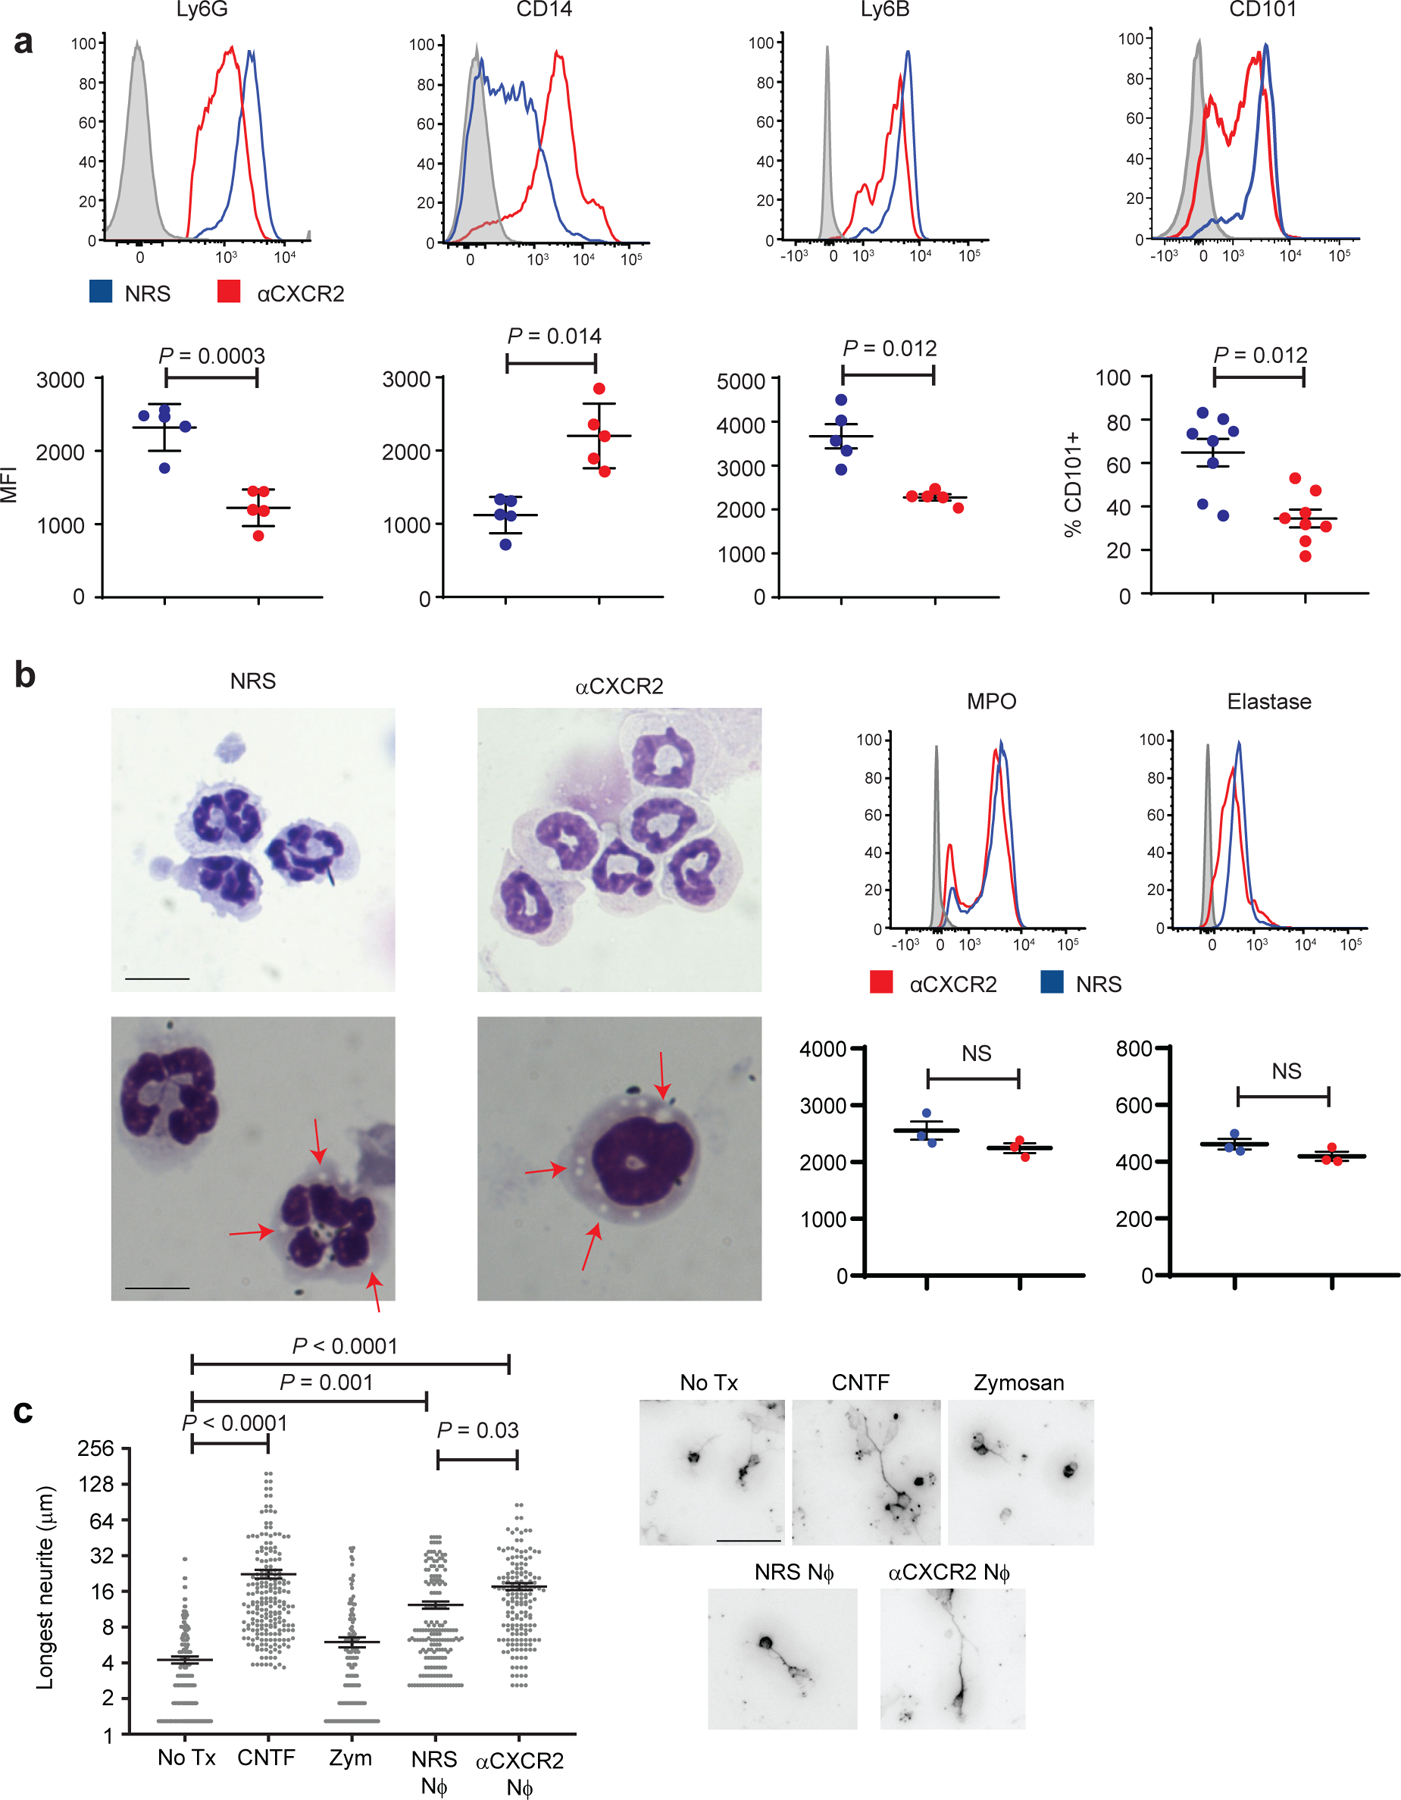
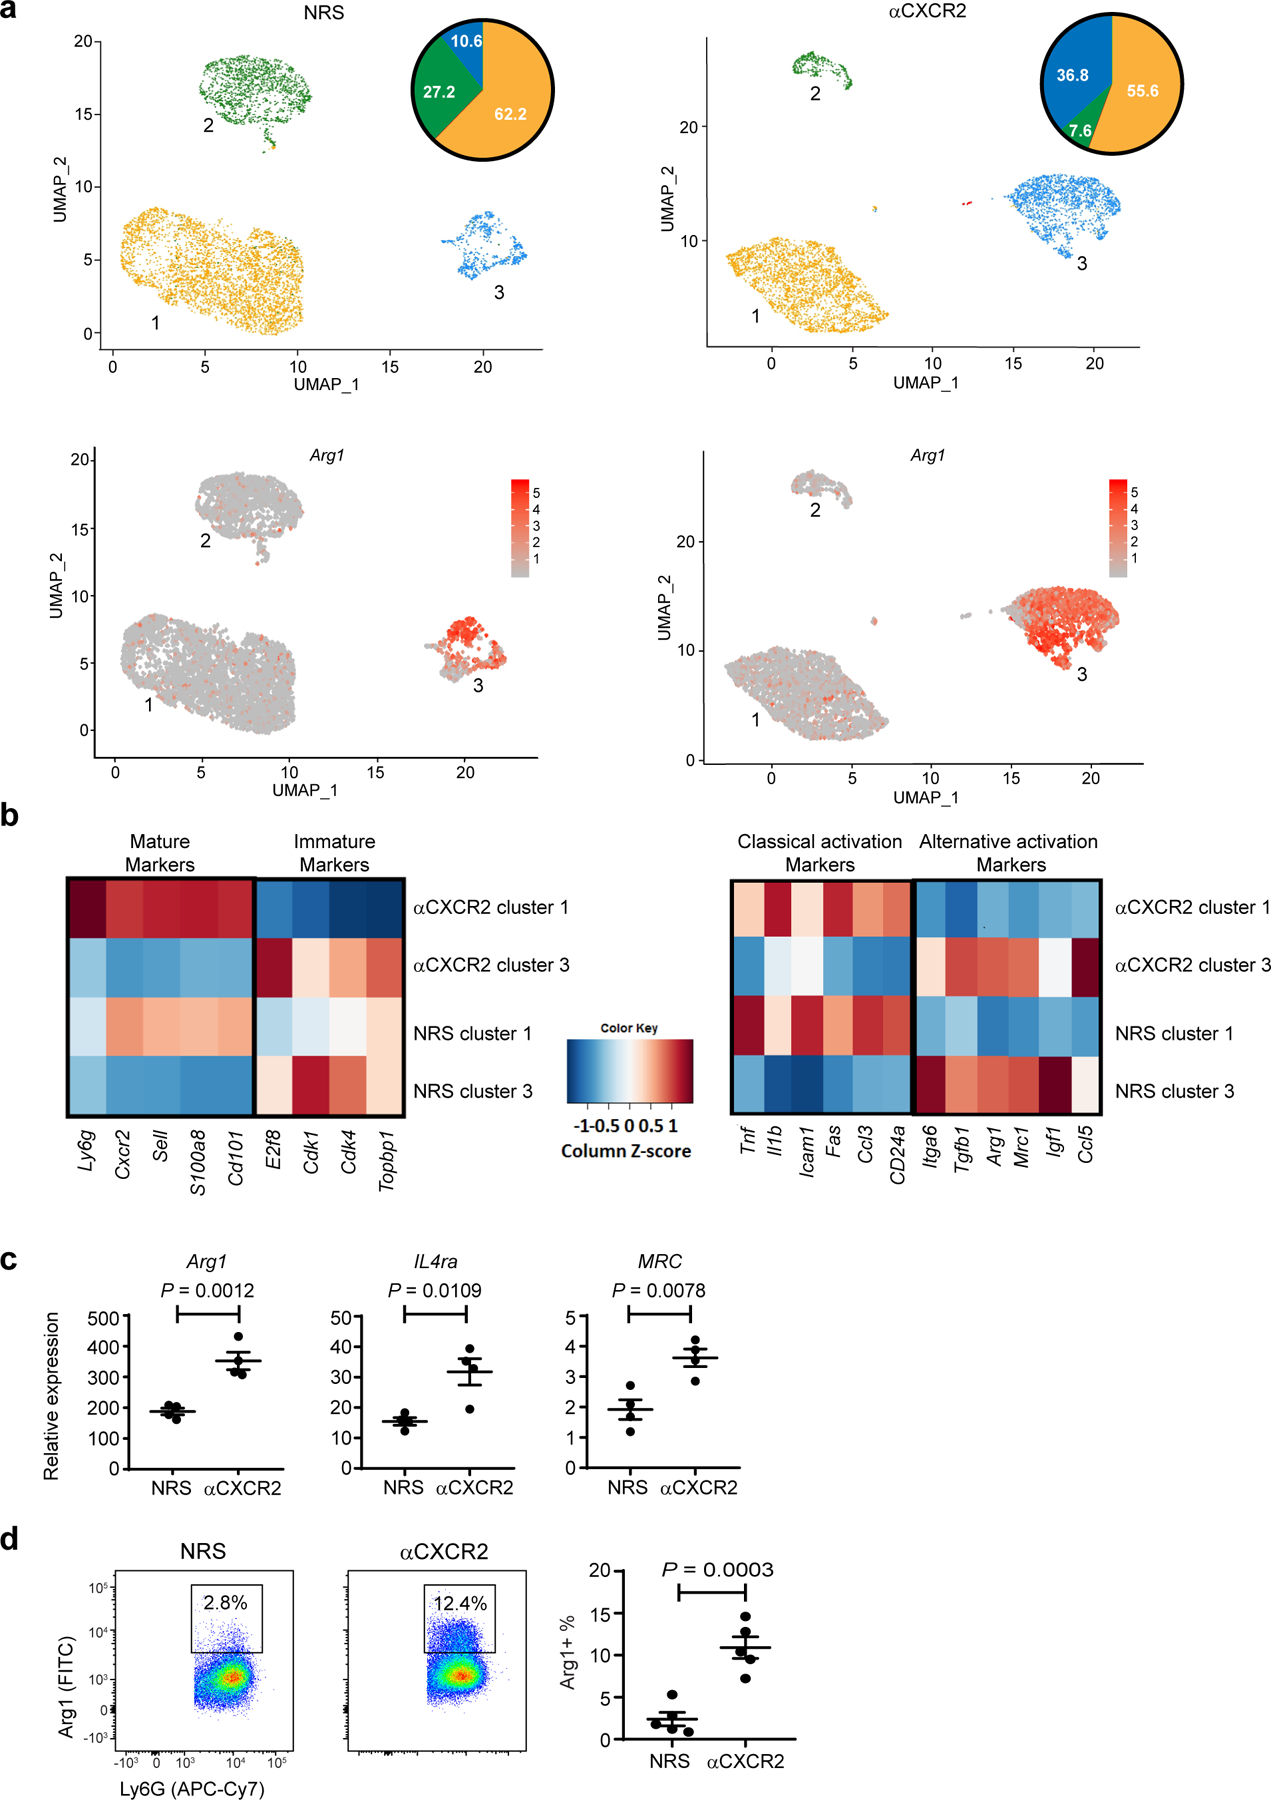
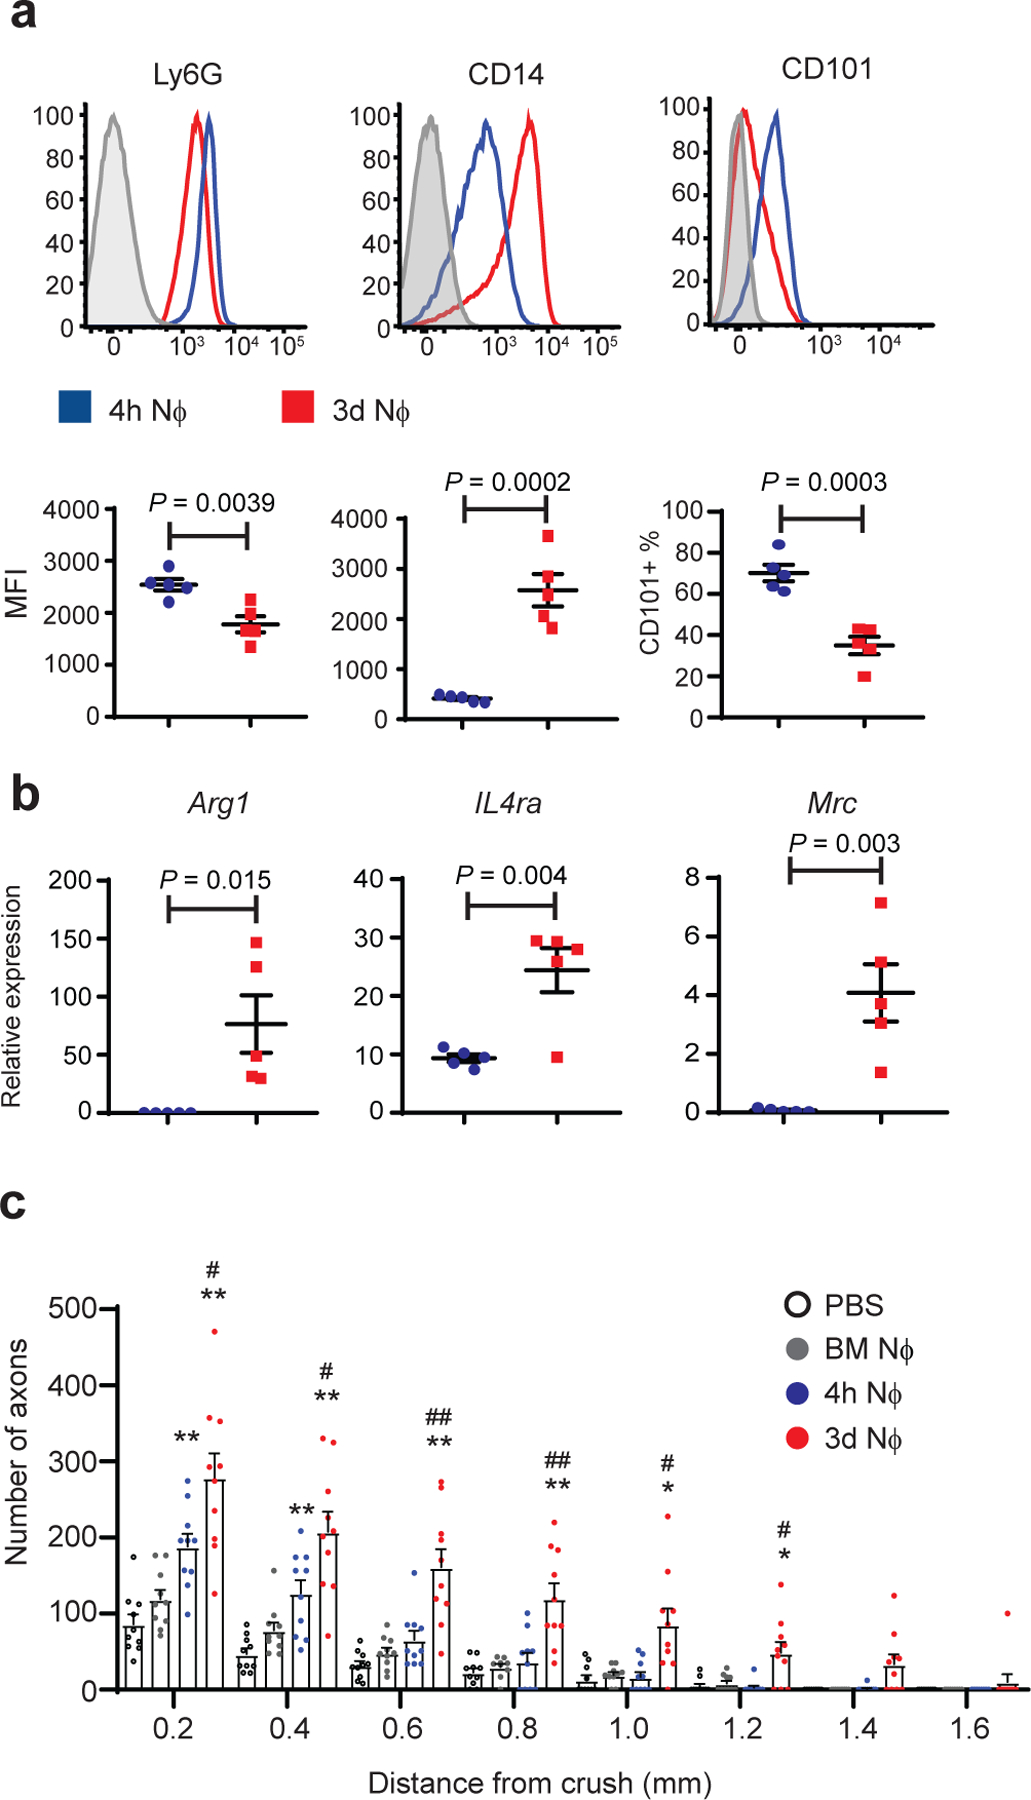
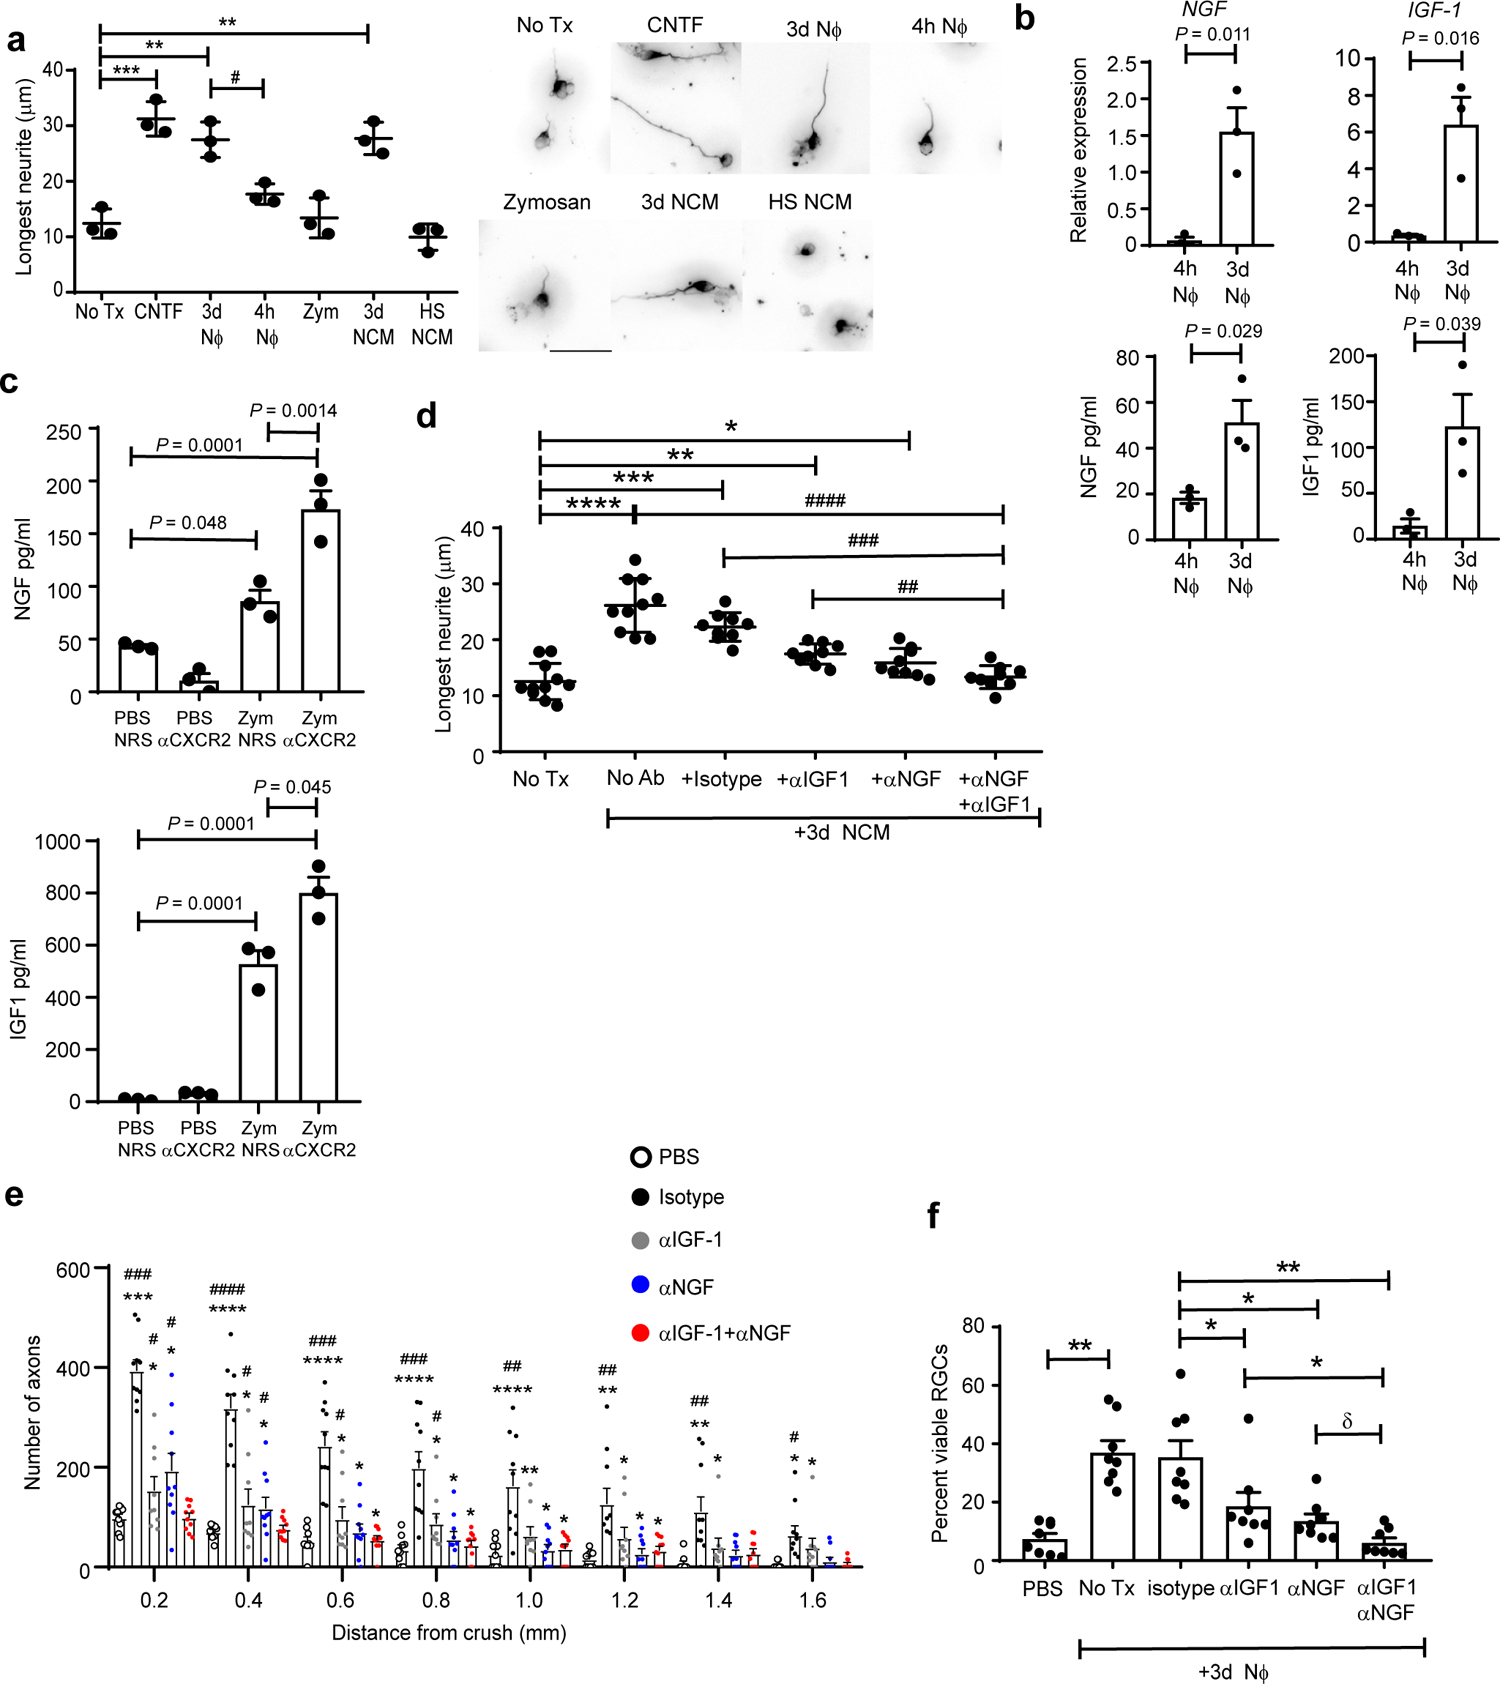
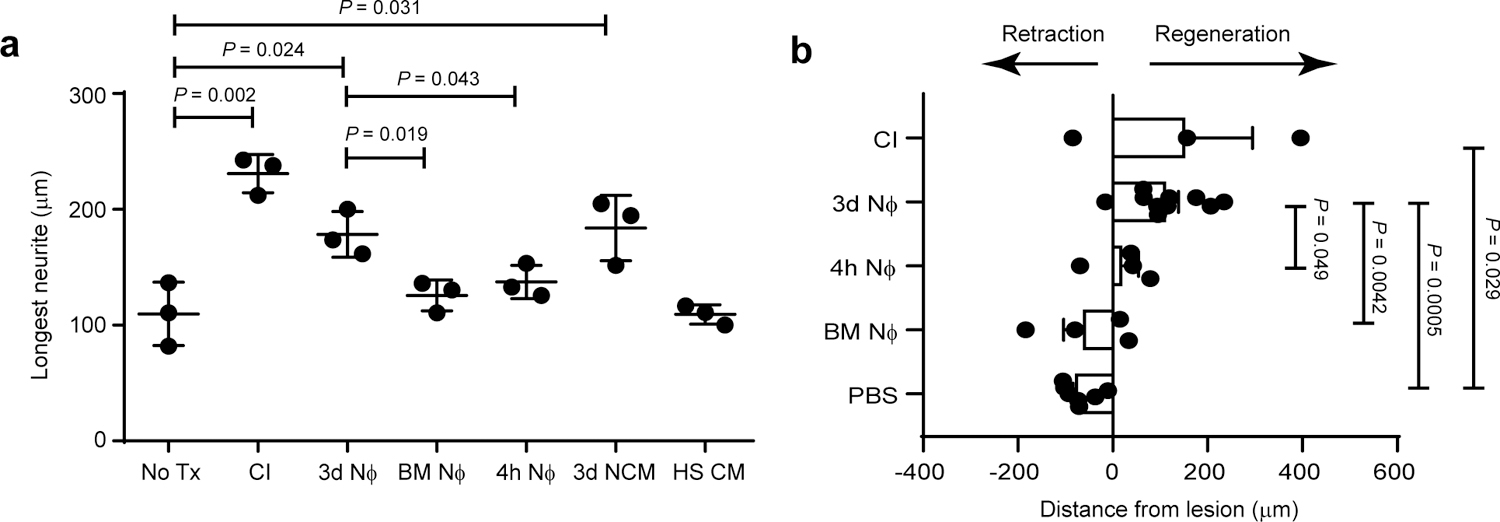
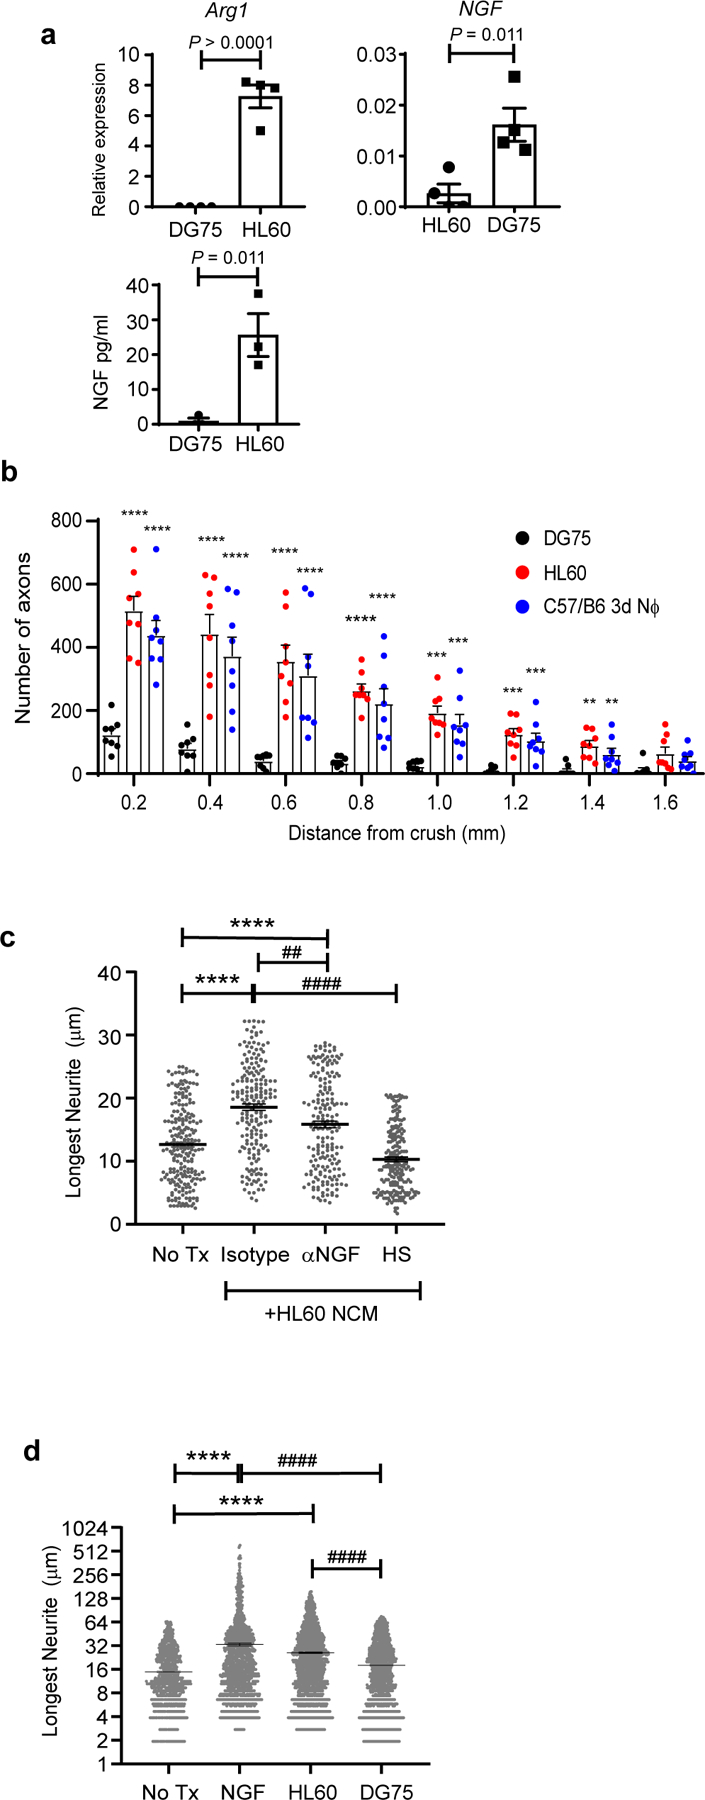
Transected axons typically fail to regenerate in the central nervous system (CNS), resulting in chronic neurological disability in individuals with traumatic brain or spinal cord injury, glaucoma and ischemia-reperfusion injury of the eye. Although neuroinflammation is often depicted as detrimental, there is growing evidence that alternatively activated, reparative leukocyte subsets and their products can be deployed to improve neurological outcomes. In the current study, we identify a unique granulocyte subset, with characteristics of an immature neutrophil, that had neuroprotective properties and drove CNS axon regeneration in vivo, in part via secretion of a cocktail of growth factors. This pro-regenerative neutrophil promoted repair in the optic nerve and spinal cord, demonstrating its relevance across CNS compartments and neuronal populations. Our findings could ultimately lead to the development of new immunotherapies that reverse CNS damage and restore lost neurological function across a spectrum of diseases.


Conflict of interest statement

Competing Interests statement

The authors have no competing interests.

Figures

Extended Data Fig. 1
Extended Data Fig. 1. Zymosan-induced RGC axon regeneration is independent of mature T and B cells.
a, Gating scheme for analysis of intraocular infiltrates by flow cytometry. b, C57BL/6 WT or RAG1 deficient mice were injected i.o. with zymosan or PBS on the day of ONC injury. Optic nerves were harvested 14 days later. Longitudinal sections were stained with fluorochrome-conjugated anti-GAP-43 antibodies to enumerate the density of regenerating axons at serial distances from the crush site (n=6 nerves/ group). Data are shown as mean +/− sem. One of two independent experiments with similar results is shown. Statistical significance was determined by one-way ANOVA followed by Tukey’s post hoc test (P < 0.05, **P < 0.01, ***P < 0.001, compared with the PBS →WT group). c, Optic nerves were harvested on day 28 following i.o. injection of either PBS or zymosan. Mice received i.p. injections of either αCXCR2 antisera or control sera every other day from the day of ONC onward. The density of GAP-43+ regenerating axons was measured in optic nerve longitudinal sections at serial distances from the crush site (n= 10 nerves per group). Data are shown as mean +/− sem; statistical significance was determined by one-way ANOVA followed by Tukey’s post hoc test (*P < 0.05; **P < 0.01, ***P < 0.001, ****P < 0.0001 compared with the i.o. PBS/ i.p. NRS group; #P < 0.05, ##P < 0.01, ###P < 0.001, compared with the i.o. zymosan/ i.p. NRS group).
Extended Data Fig. 2
Extended Data Fig. 2. Immature neutrophils are mobilized into the circulation following treatment with i.o. zymosan and i.p. αCXCR2.
Mice received an i.o. injection of zymosan on day 0, and i.p. injections of NRS (blue) or αCXCR2 (red) on days 0 , 2 and 4, post ONC injury. Peripheral blood cells were obtained on day 5 and analyzed by flow cytometry. a, Cell surface expression of Ly6G, CD14 and CD101. Upper panels, representative histograms. Lower panels, geometric Mean Fluorescence Intensity on gated Ly6G+ cells and percentage of CD101+ neutrophils. Each symbol represents data from an individual mouse (n=3 mice/ group). Data are shown as mean +/− sem. One experiment representative of 3 with similar results is shown. Statistical significance was determined by two tailed unpaired Student’s t-test. b, Representative dot plots.
Extended Data Fig. 3
Extended Data Fig. 3. A population of alternatively activated, immature neutrophils is expanded in intraocular infiltrates following treatment with i.o. zymosan and i.p. αCXCR2.
Single-cell analysis using 10X Genomics of intraocular Ly6G+ cells from the NRS (left panels) or αCXCR2 (right panels) treatment groups, as in fig. 3. a, Violin plots showing the cells expressing Arg1, Mrc, Hexb, Sgrn and Fpr1 in clusters 1 and 3 of the NRS and αCXCR2 treatment groups. b, Featureplots showing cluster-specific expression of Mrc (CD206, alternative activation marker), CXCR2 and S100a8 (maturation markers).
Extended Data Fig. 4
Extended Data Fig. 4. Adoptively transferred CD14+Ly6Glow cells induce RGC axon regeneration independent of TLR2 and dectin-1 or CCR2 signaling.
a, Mice were subjected to ONC injury on day 0 and received i.o. injections of either PBS, 4h NΦ, or 3d NΦ, on days 0 and 3. Retina were harvested on day 14. The frequency of viable BRN3a+ RGC neurons in whole mounts, normalized to healthy retina (n=10 retina per group). One experiment representative of 2 is shown. Statistical significance determined by one-way ANOVA followed by Tukey’s post hoc test. b, Peritoneal Ly6G+ cells were purified 3 days after i.p. zymosan injection (3d NΦ), and adoptively transferred into the eyes of naïve C57BL/6 WT or TLR2−/−dectin-1−/− double knock-out (dko) mice on days 0 and 3 post ONC injury. For negative controls, additional groups were injected i.o. with PBS. Optic nerves were harvested 14 days later and analyzed by GAP-43 immunohistochemistry. The figure shows the density of regenerating axons, at serial distances from the crush site (n= 8 nerves per group). One of 2 independent experiments is shown. Statistical significance determined by one-way ANOVA followed by Tukey’s post hoc test (*P < 0.05, **P < 0.01, ***P < 0.001, ****P < 0.0001 compared with PBS/WT; #P < 0.05, ##P < 0.01, ###P < 0.001 compared with PBS/dKO). c, GFAP (green) and IBA1 (red) IHC of retinal cross-sections obtained 7 or 14 days following ONC and i.o injection of either 3d NΦ or PBS. Representative images shown (n= 3 mice, 1 of 3 independent experiments, scale bar 80 μm). d, eGFP labeled 3d NΦ were injected i.o. on the day of ONC injury. Representative microscopic image of retinal cross-section prepared 3 days later (n=3 mice, 1 of 2 independent experiments scale bar 200 μm). e, Representative flow cytometric analysis of intraocular infiltrates harvested from WT or Ccr2−/− mice on day 3 post ONC injury and i.o. injection of 3d NΦ (n= 5 mice per group). f, 3d NΦ were adoptively transferred into the eyes of C57BL/6 WT or Ccr2−/− mice on days 0 and 3 post ONC injury. Axonal densities at serial distances from the crush site, on day 14 post ONC injury (n=6 nerves, 1 of 2 independent experiments is shown). Statistical significance determined by one-way ANOVA followed by Tukey’s post hoc test (*P < 0.05, **P < 0.01, ***P < 0.001, compared with PBS/WT; #P < 0.05, ##P < 0.01, ###P < 0.001 ####P < 0.0001, compared with PBS/ Ccr2−/−). a,b,f Data are shown as mean +/− sem.
Extended Data Fig. 5
Extended Data Fig. 5. Pro-regenerative neutrophils retain therapeutic efficacy when administered following CNS injury.
a, 3d NΦ were adoptively transferred into the eyes of mice on the day of ONC injury, or after a delay of 6, 12, or 24 hrs. NΦ adoptive transfer was repeated 3 days later. A control group was injected i.o. with PBS alone on days 0 and 3. Optic nerves were harvested on day 14 for quantification of axonal densities by GAP-43 IHC (n= 8 nerves per group). (*P < 0.05; **P < 0.01 *** P<0.001 compared with PBS). b, 4h or 3d NΦ were added to primary RGC cultures 4hrs after RGC plating. In other wells, RGC were cultured in media alone (No Tx), or in the presence of recombinant CNTF, as negative and positive controls, respectively. Neurite outgrowth was measured 24 hours later (n=2000 RGCs per condition, one of two independent experiments shown). Statistical significance determined by one-way ANOVA followed by Tukey’s post hoc test. c, 4h or 3d NΦ were added to primary DRG cultures 8hrs after DRG plating. In other wells, DRG were cultured in media alone (No Tx), or in the presence of recombinant NGF, for negative and positive controls, respectively. Neurite outgrowth was measured 24 hours later (n=300 DRGs per condition, one of two independent experiments shown). Statistical significance determined by one-way ANOVA followed by Tukey’s post hoc test. a-c, Data shown as mean +/− sem.
Extended Data Fig. 6
Extended Data Fig. 6. NGF and IGF-1 drive RGC axon regeneration in a collaborative manner.
a, Quantification of a panel growth factors in unconditioned media (black bars) and NCM (gray bars) by multiplexed antibody array. b, Primary RGC were cultured in the absence or presence of recombinant mouse CNTF, IGF-1, NGF, or a combination of IGF-1 and NGF. Neurite length was measured 24 hours later. Each symbol represents the mean of 200 RGCs in one independent experiment (n=6 independent experiments shown). Statistical significance was determined by one-way ANOVA followed by Tukey’s post hoc test (**P < 0.01, ***P < 0.001 compared with No Tx; #P < 0.05 compared with NGF; ++P < 0.01, compared with IGF-1). c, Recombinant IGF-1 (blue bars), NGF (green), a combination of NGF and IGF1 (white), or PBS alone (black) was injected into the vitreous on days 0 and 3 post ONC injury. Optic nerves were harvested 14 days later. Density of regenerating axons in optic nerve sections, at serial distances from the crush site (n= 8 nerves per group). One experiment representative of 2 with similar results is shown. Statistical significance was determined by one-way ANOVA followed by Tukey’s post hoc test (*P < 0.05, **P < 0.01, ***P < 0.001, ****P < 0.0001 compared with PBS; #P < 0.05 compared with NGF; +P < 0.05, ++P < 0.01, compared with IGF-1). b,c, Data shown as mean +/− sem.
Fig. 1 |
Fig. 1 |. Zymosan-driven regrowth of optic nerve axons is enhanced by blockade of eye-infiltrating CXCR2+ neutrophils.
a-e Mice with ONC injury received a single i.o. injection of zymosan or PBS on day 0, and i.p. injections of either control serum (NRS) or αCXCR2 antisera every other day starting on day 0. a, The cellular composition of vitreal infiltrates collected at serial time points from zymosan injected eyes in the NRS (left) or αCXCR2 (right) treatment groups (n=10 eyes per group per time point). One experiment representative of 7 independent experiments with similar results is shown. b-e, Optic nerves and retinas were harvested on day 14. b, The density of GAP-43+ regenerating axons in longitudinal optic nerve sections at serial distances from the crush site (n= 12 nerves per group), scale bar 200 μm. One experiment representative of 3 is shown. c, Representative images of optic nerves from each group in one experiment from b. d, The frequency of viable BRN3a+ retinal ganglion cell (RGC) neurons in whole mounts, normalized to healthy retina (n=12 retinas per group). One experiment representative of 3 is shown. e, Representative images of retinal whole mounts from each group in one experiment from d. “Control” indicates a healthy, naive retina, scale bar 100 μm. In a,b,d, data are shown as mean +/− sem; statistical significance was determined by one-way ANOVA followed by Tukey’s post hoc test (*P < 0.05; **P < 0.01, ***P < 0.001, ****P < 0.0001 compared with i.o. PBS/ i.p. NRS group; #P < 0.05, ##P < 0.01, ###P < 0.001, compared with i.o. zymosan/ i.p. NRS group).
Fig. 2 |
Fig. 2 |. Treatment of mice with αCXCR2 antisera, starting on the day of i.o. zymosan injection, skews eye-infiltrating neutrophils towards an immature phenotype.
a-c Mice were injected i.o. with zymosan on day 0 of ONC injury, and i.p. with either αCXCR2 (red) or NRS (blue) on days 0, 2 and 4. Inflammatory cells were isolated from the vitreous on day 5. a, b Surface expression of myeloid cell markers. Upper panels, representative histograms. Lower panels, geometic Mean Fluorescence Intensity of Ly6G (n=5 mice/group), CD14 (n=5 mice/group), Ly6B (n=5 mice/group), MPO and elastase on Ly6G+ gated cells ( (n=3 mice/group), and % of Ly6G+ gated cells that are CD101+(n=8 mice/group). Each symbol represents data obtained from a single mouse. One experiment representative of 3 is shown. Statistical significance determined by two tailed unpaired Student’s t-test. b, left panels, Cytospins of purified vitreal Ly6G+ cells, Wright Giemsa stained (top panels scale bar 10 μm, bottom panels scale bar 6 μm). Arrows point to granules. c, Mean length of the longest neurite grown by primary RGC, following 24 h co-culture with intraocular Ly6G+ neutrophils (Nϕ) that were purified from the NRS or αCXCR2 treatment groups. RGC were cultured with recombinant ciliary neurotrophic factor (CNTF) as a positive control, or with particulate zymosan (Zym) or media alone (No Tx) as negative controls (n= 200 RGCs per condition). Statistical significance was determined by one-way ANOVA followed by Tukey’s post hoc test. Right panels, representative images, scale bar 20 μm. a, b, c, Data are shown as mean +/− sem.
Fig. 3 |
Fig. 3 |. Neuroregenerative neutrophils have characteristics of alternatively activated cells.
a-d, Mice with ONC injury were injected i.o. with zymosan on day 0, and i.p. with αCXCR2 or NRS on days 0, 2, and 4. Ly6G+ cells were purified from intraocular infiltrates on day 5. a,b, Single cell analysis of pooled intraocular Ly6G+ cells from the NRS (left panels) or αCXCR2 (right panels) treatment groups, using 10X Genomics (n= 5 mice/ group). a, Upper panels, UMAPs showing 5,909 cells (left, NRS treatment group) and 4,844 cells (right, αCXCR2 treatment group) by cluster. Pie charts indicate the percent of cells in each cluster. Lower panels, featureplots showing cluster-specific expression of arginase-1 (Arg1). b, Heat maps depicting the scaled expression of genes related to neutrophil maturation (left) and classical or alternative activation markers (right). c, RNA was extracted from Ly6G+ cells purified from the intraocular infiltrates of individual mice. Arg1, IL-4 receptor alpha chain (IL4Ra), and CD206/ mannose receptor (MRC) transcripts were quantified by qPCR, and normalized to β-actin (n=4 mice/ group). One experiment representative of 3 independent experiments is shown. d, Representative flow cytometric dot plots showing intracellular Arginase-1 protein expression in Ly6G+ gated cells. Right panel, percent of Ly6G+ cells that are Arginase-1+ (n=5 mice/group). One experiment representative of 2 is shown. c, d Each symbol represents the results obtained from an individual mouse. Data are show as mean +/− sem. Statistical significance was determined by two tailed unpaired Student’s t-test.
Fig. 4 |
Fig. 4 |. CD14+Ly6Glow cells, purified 3 days following i.p. zymosan injection, are neuroregenerative.
Peritoneal cells were harvested via lavage 4 hours (blue) or 3 days (red) following i.p. zymosan injection. a, Cell surface expression of indicated molecules on Ly6G gated cells. Upper panels, representative histograms. Lower panels, geometric Mean Fluorescence Intensity of Ly6G and CD14; % of cells that are CD101+(n=5 mice/group) One of 3 independent experiments shown. b, RNA was extracted from purified Ly6G+ cells. Arg1, IL4Ra, and MRC, measured by qPCR normalized to Actβ (n=5 mice/group) One of 3 independent experiments shown. c, Ly6G+ cells (NΦ), purified from zymosan-induced i.p. infiltrates, were adoptively transferred into the eyes of mice on days 0 and 3 post ONC injury. For negative controls, separate groups of mice were injected i.o. with PBS or naïve bone marrow neutrophils (BMNϕ) according to the same dosing regimen. Optic nerves were harvested 14 days later and analyzed by GAP-43 immunohistochemistry. The figure shows the density of regenerating axons in optic nerve sections, at serial distances from the crush site (n= 10 nerves per group). One experiment representative of 4 is shown. Statistical significance determined by one-way ANOVA followed by Tukey’s post hoc test (*P < 0.05; **P < 0.01 compared with PBS; #P < 0.05, ##P < 0.01, compared with 4 hour NΦ). a,b Each symbol represents data obtained using inflammatory cells pooled from both eyes of a single mouse. Error bars depict mean +/− sem for all data sets.
Fig. 5 |
Fig. 5 |. CD14+Ly6Glow cells induce RGC axon outgrowth, in part, via secretion of growth factors.
a-d, Ly6G+ cells were purified from peritoneal lavage fluid that was collected 4 hours (4h NΦ) or 3 days (3d NΦ) following i.p. zymosan injection. a, 3d NΦ, 4h NΦ, the conditioned media of 3d NΦ (3d NCM), or heat shocked conditioned media of 3d NΦ (HS NCM), were added to primary RGC cultures, and neurite outgrowth was measured 24 hours later. RGCs were cultured with recombinant CNTF or particulate zymosan (Zym) as positive and negative controls, respectively. Each circle represents the mean neurite length of 200 RGCs countedin one experiment, n=3 independent experiments. Statistical significance determined by one-way ANOVA followed by Tukey’s post hoc test. Right panels, representative images. b, Upper panels, NGF and IGF-1 mRNA levels in 4h or 3d NΦ, quantified using qPCR, and normalized to Actβ. Lower panels, NGF and IGF-1 protein levels, measured in the CM of 4h or 3d NΦ by ELISA. c, NGF and IGF-1 protein levels, measured by ELISA, in vitreous fluid collected on day 5 following ONC injury and i.o. zymosan or PBS injection. Mice were injected i.p. with either NRS or αCXCR2 on days 0, 2 and 4 post-ONC injury. b,c Statistical significance determined using the two tailed unpaired Student’s t-test (n= 3 mice/group). One of two experiments shown. d, Primary RGC were cultured with conditioned media of 3d NΦ, in the absence or presence of neutralizing antibodies against NGF and/ or IGF-1, or isotype matched control antibodies. Neurite length was measured 24 hours later. Each symbol represents the mean neurite length of 100 RGCs counted in one independent experiment; n=10 experiments. Statistical significance determined by one-way ANOVA followed by Tukey’s post hoc test. e,f, Purified 3d NΦ were adoptively transferred, with or without neutralizing antibodies against NGF and/ or IGF-1 or isotype matched control antibodies, into the eyes of mice with ONC injury, as in fig. 4c. A negative control group was injected with PBS alone. Optic nerves and retinas were harvested 14 days later. e, Density of regenerating axons in optic nerve sections, at serial distances from the crush site. (n= 10 nerves per group). One experiment representative of 3 shown. Statistical significance determined by one-way ANOVA followed by Tukey’s post hoc test (*P < 0.05, **P < 0.01, ***P < 0.001, ****P < 0.0001 compared with PBS; #P < 0.05, ##P < 0.01, ###P < 0.001 compared with αNGF+αIGF-1). f, Frequency of viable BRN3a+ RGC neurons in whole mounts, normalized to healthy retina (n=10 retina per group). One experiment representative of 2 shown. Statistical significance determined by one-way ANOVA followed by Tukey’s post hoc test. a, d, f, *, #P < 0.05, **, ##P < 0.01, ***, ###P < 0.001, ****, ####P < 0.0001, δ P=.058. a-f, Error bars depict mean +/− sem.
Fig. 6 |
Fig. 6 |. CD14+Ly6Glow cells drive the regeneration of spinal cord axons.
a, Primary DRG neurons were cultured alone (No Tx), or with 3 day neutrophils (3d NΦ), 4 hour neutrophils (4h NΦ), bone marrow neutrophils (BM NΦ), conditioned media from 3d NΦ cultures (3d NCM), or heat shocked 3d NCM (HS CM). For a positive control, DRGs were harvested 5 days following conditioning injury (CI) to the sciatic nerve. Neurite length was measured 24 hours later. Each symbol represents the mean of 50 DRGs counted in one independent experiment; n=3 independent experiments. Statistical significance determined by one-way ANOVA followed by Tukey’s post hoc test. b, Bilateral sciatic nerves were injected with either 3d NΦ, 4h NΦ, BM NΦ, or PBS, 5 days prior to spinal cord (SC) dorsal column transection. For a positive control, a separate group of mice was subjected to conditioning injury (CI) of the sciatic nerves 5 days prior to the SC transection. Sagittal sections of the spinal cord were obtained 52 days following SC transection, and subjected to immunohistochemistry. The data show the average distance between the lesion center and the rostral tip of regenerating axons. n= 7 (PBS injection), 4 (BM NΦ), 4 (4h NΦ), 10 (3d NΦ), and 3 (CI). One experiment representative of 2 is shown. Statistical significance determined by one-way ANOVA followed by Tukey’s post hoc test. a,b Data shown as mean +/− sem.
Fig. 7 |
Fig. 7 |. Human cell line derived immature neutrophils are neuroregenerative.
a, NGF protein levels were measured in conditioned media (CM) of HL60 and DG75 cells by ELISA (lower panel); Arg1 and NGF mRNA levels measured in HL60 and DG75 cells by qPCR, and normalized to Actβ (middle and right panels), n=4 independent experiments. Statistical significance was determined by two tailed unpaired Student’s t-test, b, Human HL60 or DG75 cells, or murine 3d NΦ, were adoptively transferred into the vitreous of C57BL/6 RAG1−/− mice on days 0 and 3 post ONC injury. Optic nerves were harvested 14 days later. Density of regenerating axons in optic nerve sections, at serial distances from the crush site (n= 8 nerves per group). One experiment representative of 2 is shown. Statistical significance determined by one-way ANOVA followed by Tukey’s post hoc test (**P < 0.01, ***P < 0.001, ****P < 0.0001, compared with DG75). c, Primary RGC were cultured with unconditioned media (No tx), HL60 CM in presence of either isotype control or anti-NGF antibodies, or heat shocked (HS) HL60 CM. Neurite length was measured 24 hours later (n= 200 RGCs per condition). One of 2 independent experiments is shown. Statistical significance was determined by one-way ANOVA followed by Tukey’s post hoc test (****P < 0.0001, compared with unconditioned media; ##P < 0.01, ####P < 0.0001, compared with HL60 CM + isotype antibodies). d, Primary human cortical neurons were cultured with unconditioned media alone (No Tx), NGF (positive control), HL60 cells, or DG75 cells. Neurite length was measured 24 hours later (n= 1000 neurons per condition). One of two experiments shown. Statistical significance was determined by one-way ANOVA followed by Tukey’s post hoc test (****P < 0.0001, ** P<0.01, compared to No Tx, ####P < 0.0001, compared with DG75 cells). a-d, Data shown as mean +/− sem.

Comment in

References

    1. Lucas T et al. Differential roles of macrophages in diverse phases of skin repair. J Immunol 184, 3964–3977, doi:10.4049/jimmunol.0903356 (2010). - DOI - PubMed
    1. Tourki B & Halade G Leukocyte diversity in resolving and nonresolving mechanisms of cardiac remodeling. FASEB J 31, 4226–4239, doi:10.1096/fj.201700109R (2017). - DOI - PMC - PubMed
    1. Chinetti-Gbaguidi G, Colin S & Staels B Macrophage subsets in atherosclerosis. Nat Rev Cardiol 12, 10–17, doi:10.1038/nrcardio.2014.173 (2015). - DOI - PubMed
    1. Segal BM CNS chemokines, cytokines, and dendritic cells in autoimmune demyelination. J Neurol Sci 228, 210–214, doi:10.1016/j.jns.2004.10.014 (2005). - DOI - PubMed
    1. Akiyama H et al. Inflammation and Alzheimer’s disease. Neurobiology of aging 21, 383–421, doi:10.1016/s0197-4580(00)00124-x (2000). - DOI - PMC - PubMed

Publication types

MeSH terms