. 2020 Nov;2(11):1232-1247.
doi: 10.1038/s42255-020-00296-1. Epub 2020 Oct 26.

Nutritional modulation of heart failure in mitochondrial pyruvate carrier-deficient mice

Affiliations

Nutritional modulation of heart failure in mitochondrial pyruvate carrier-deficient mice

Kyle S McCommis et al. Nat Metab. 2020 Nov.

Abstract

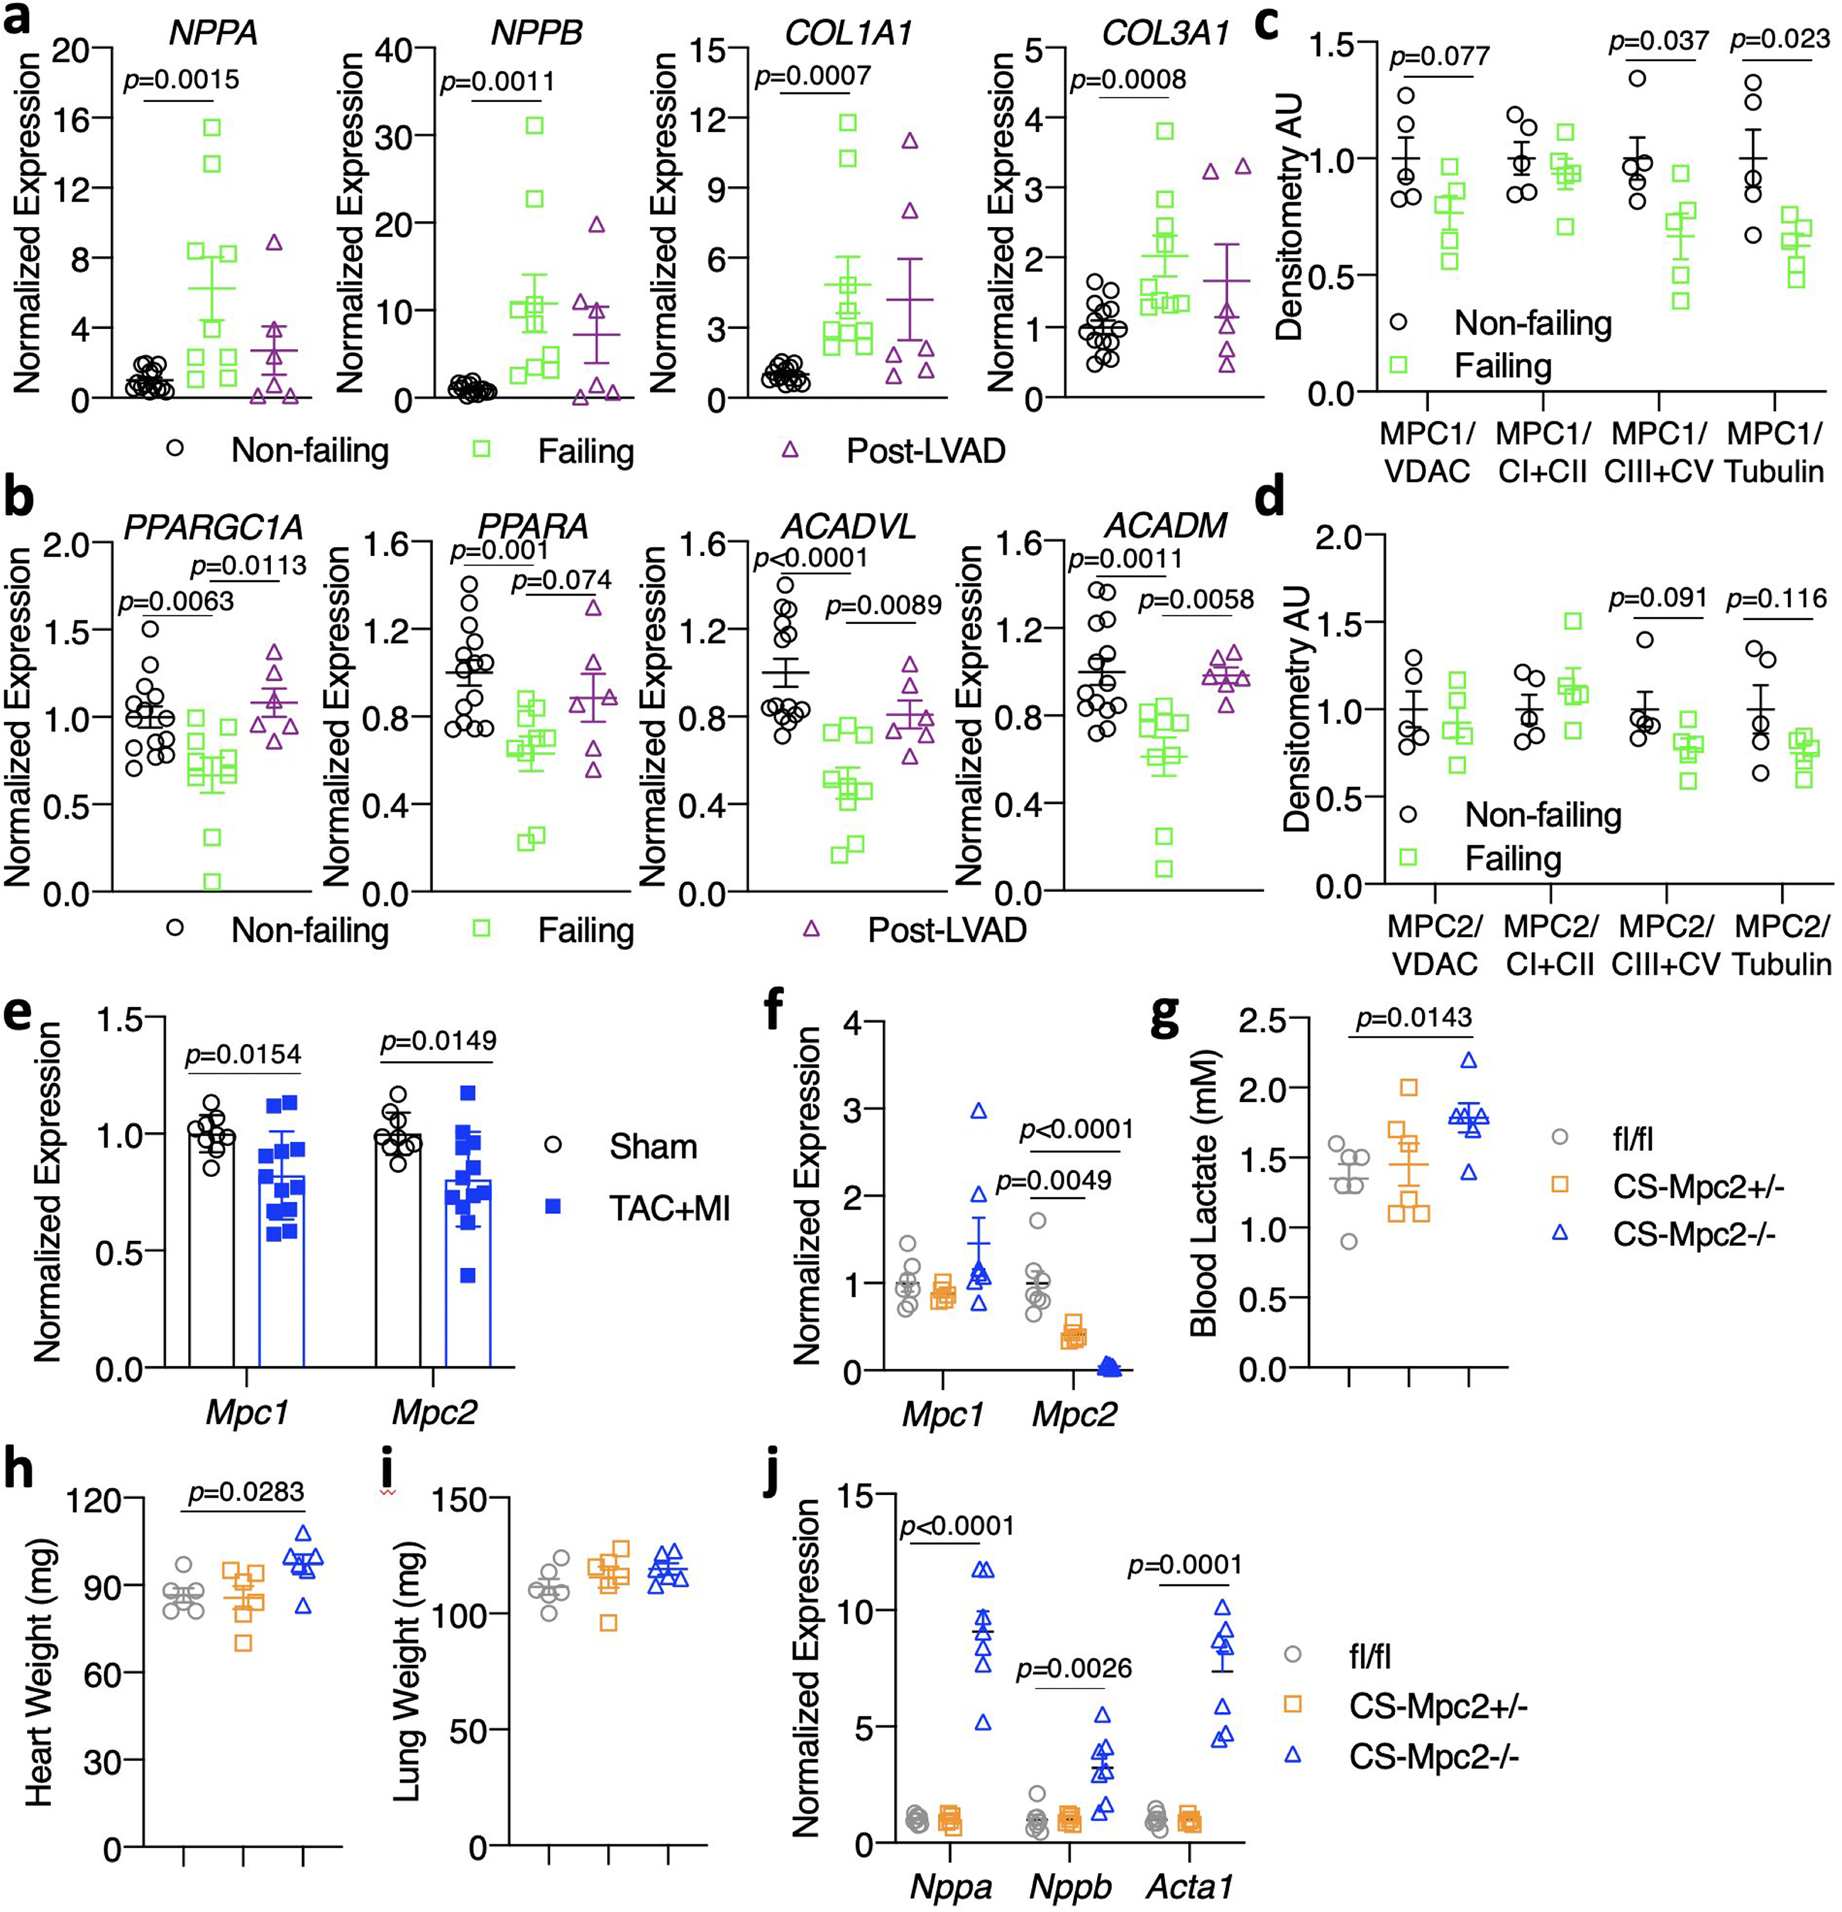
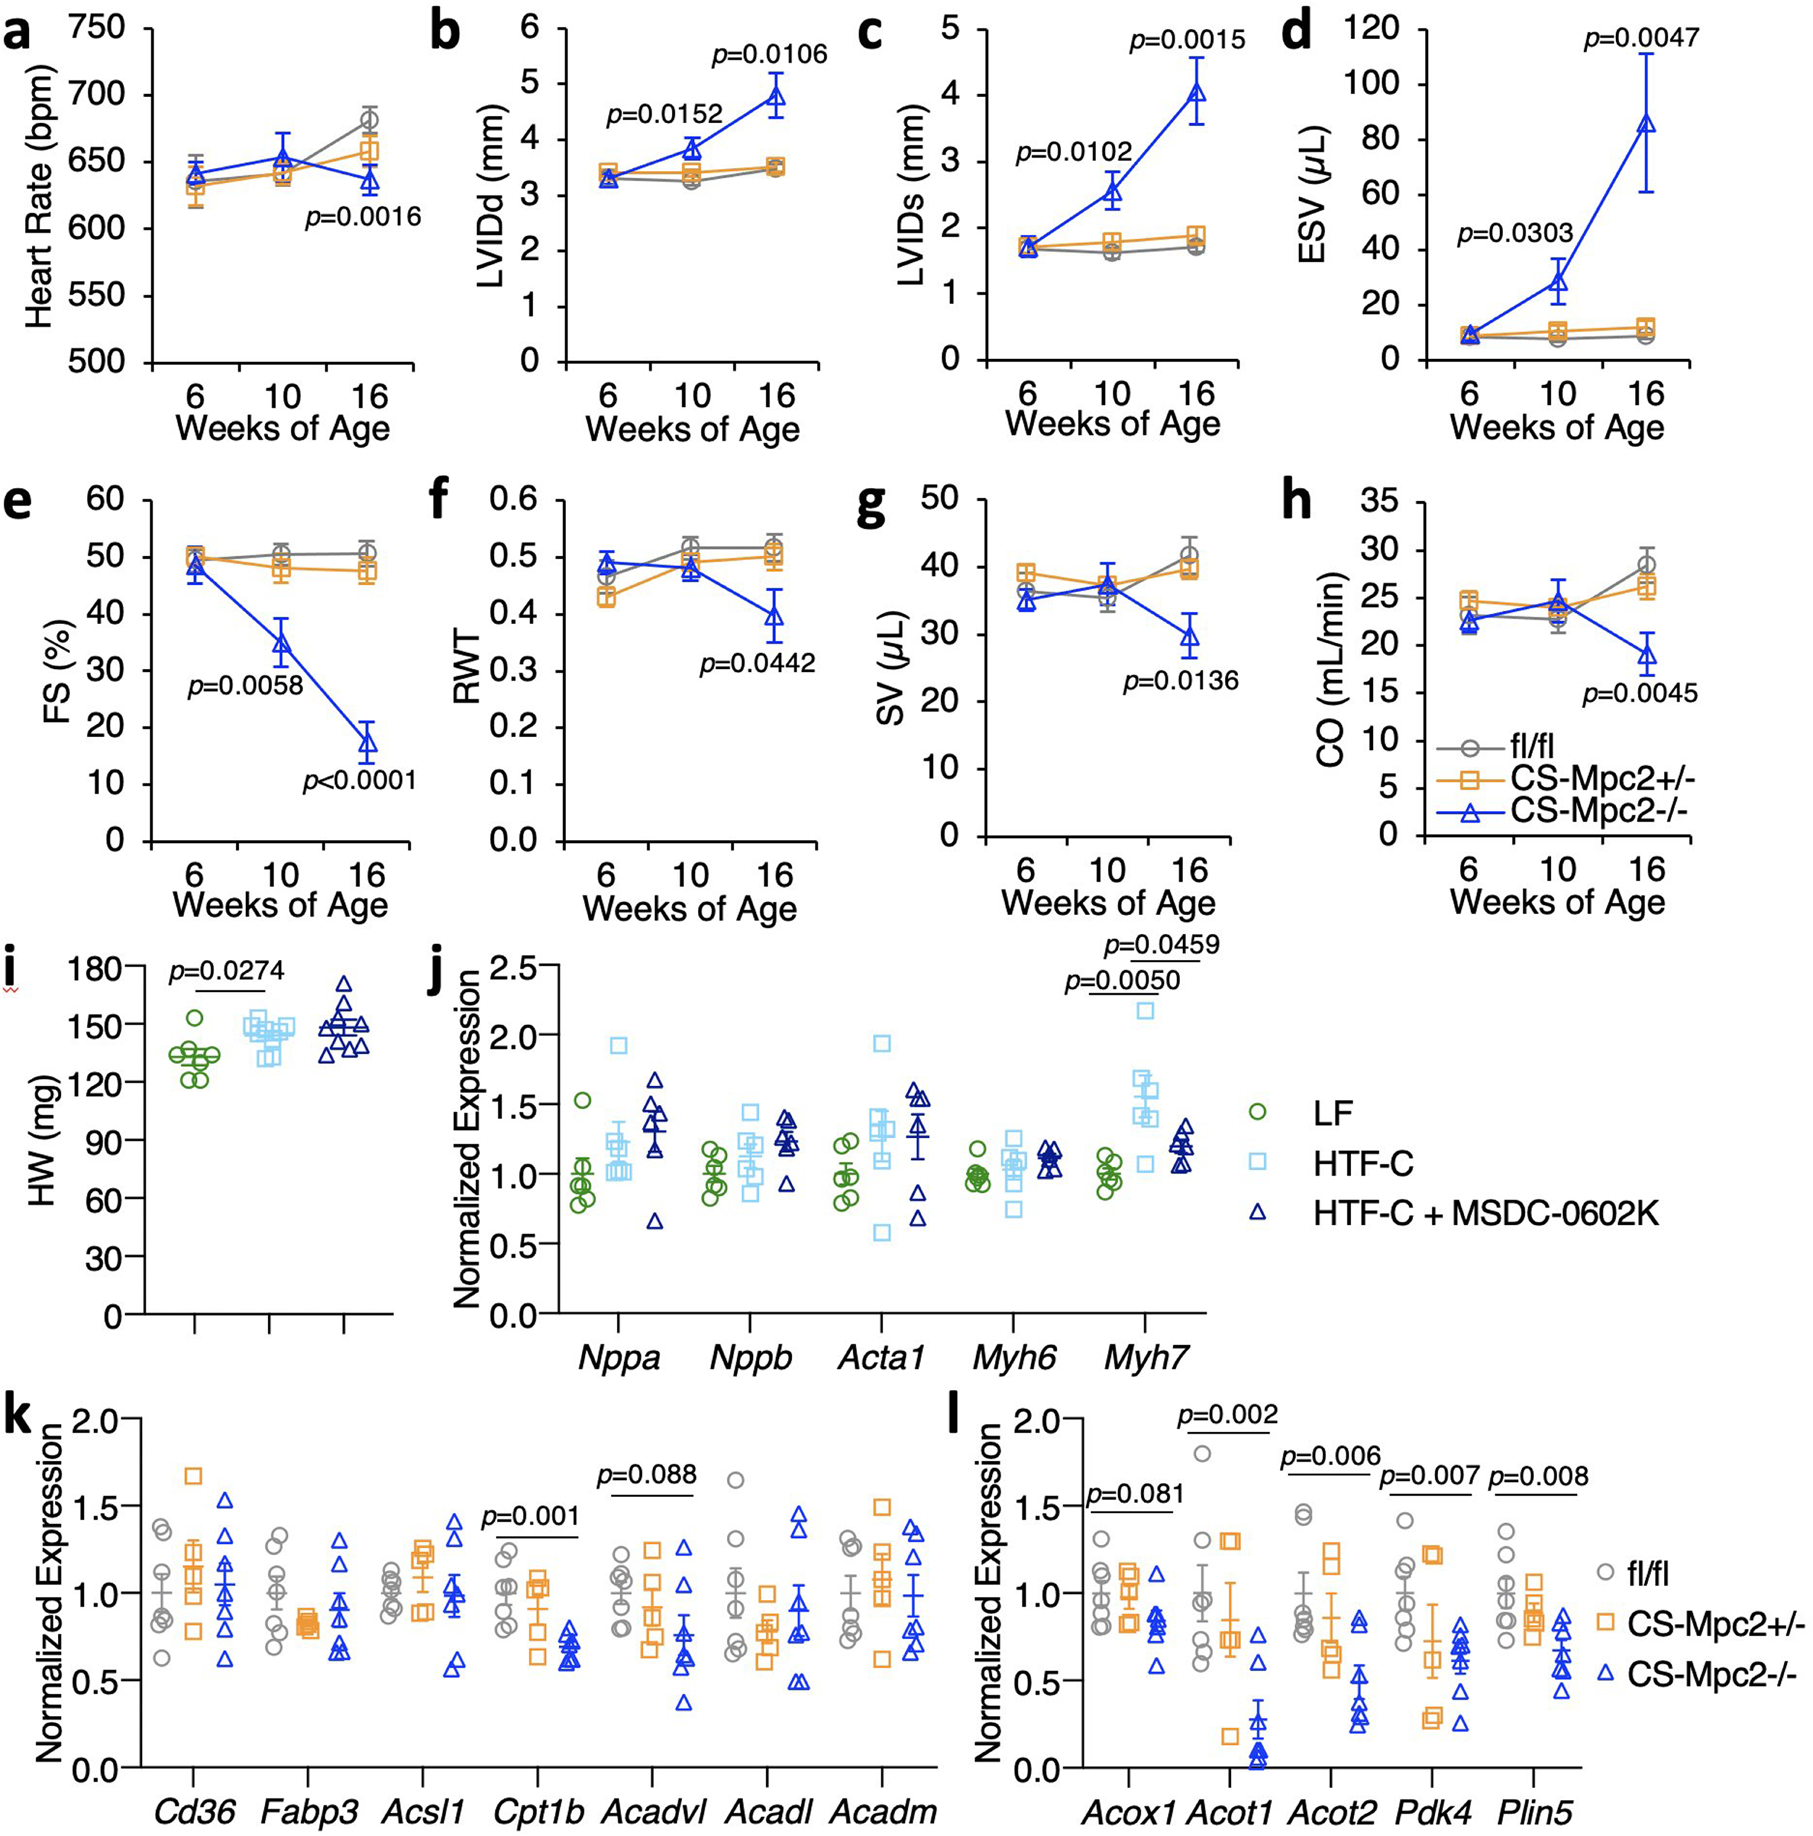
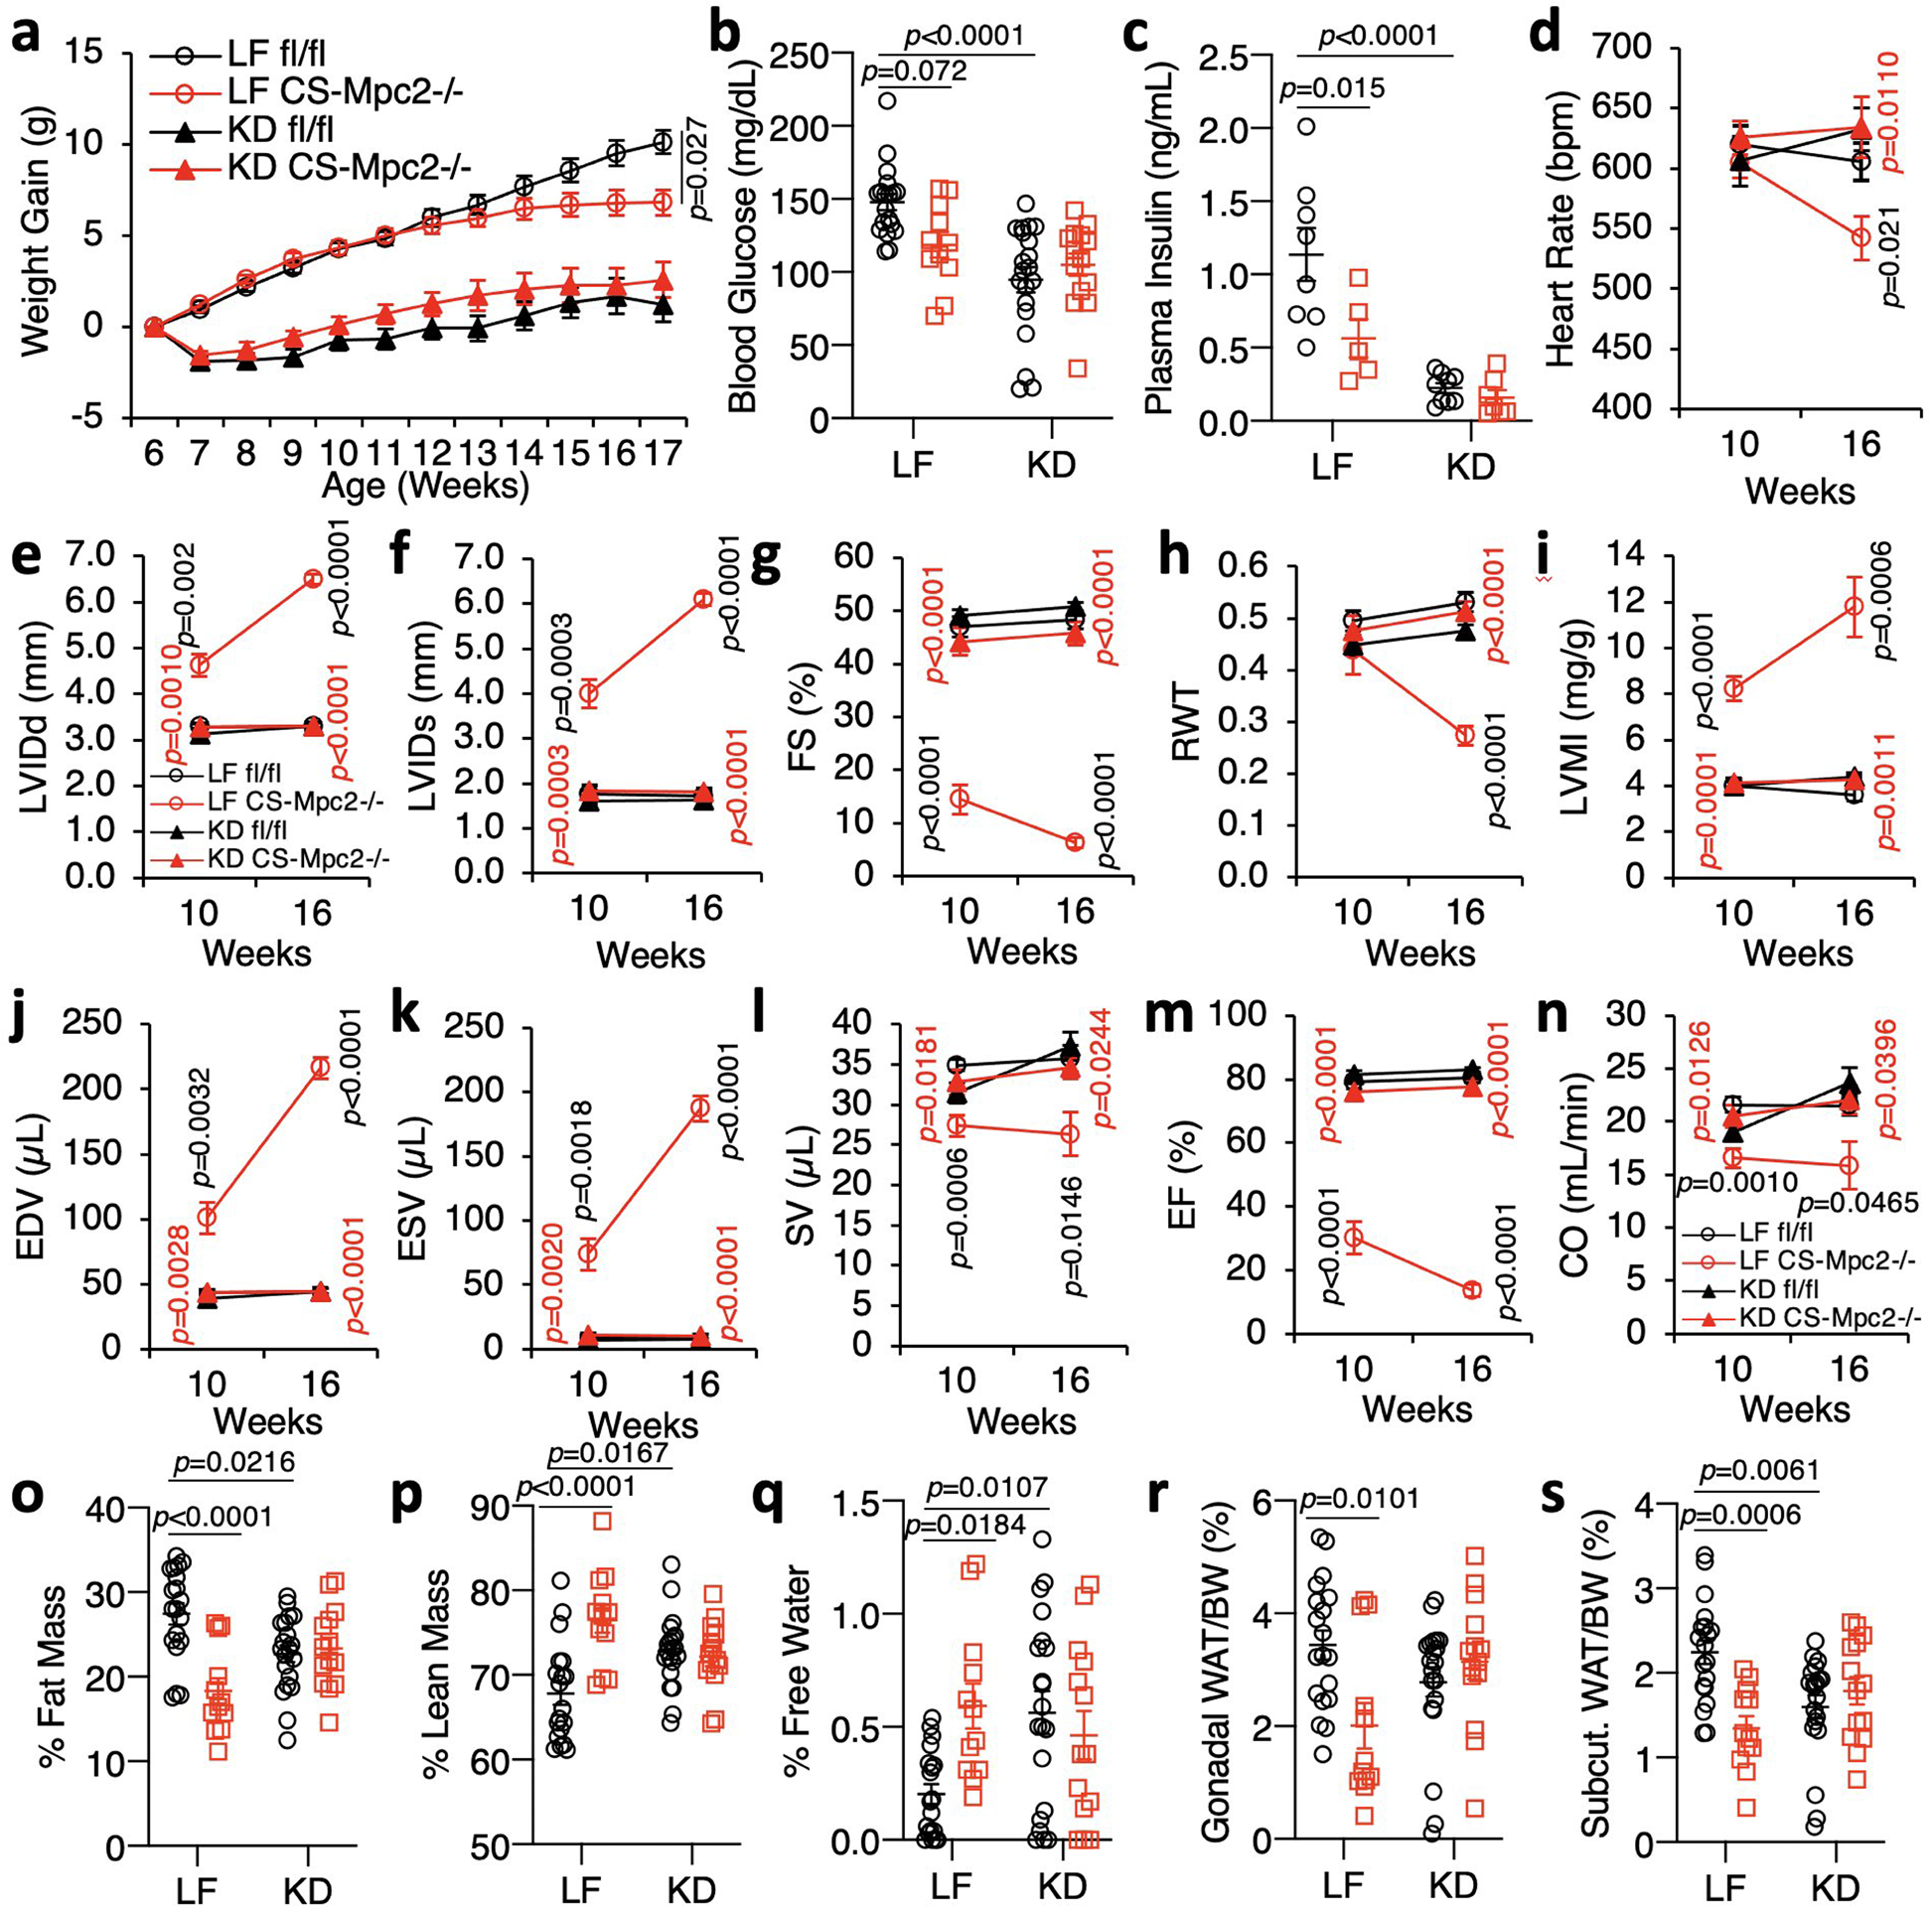
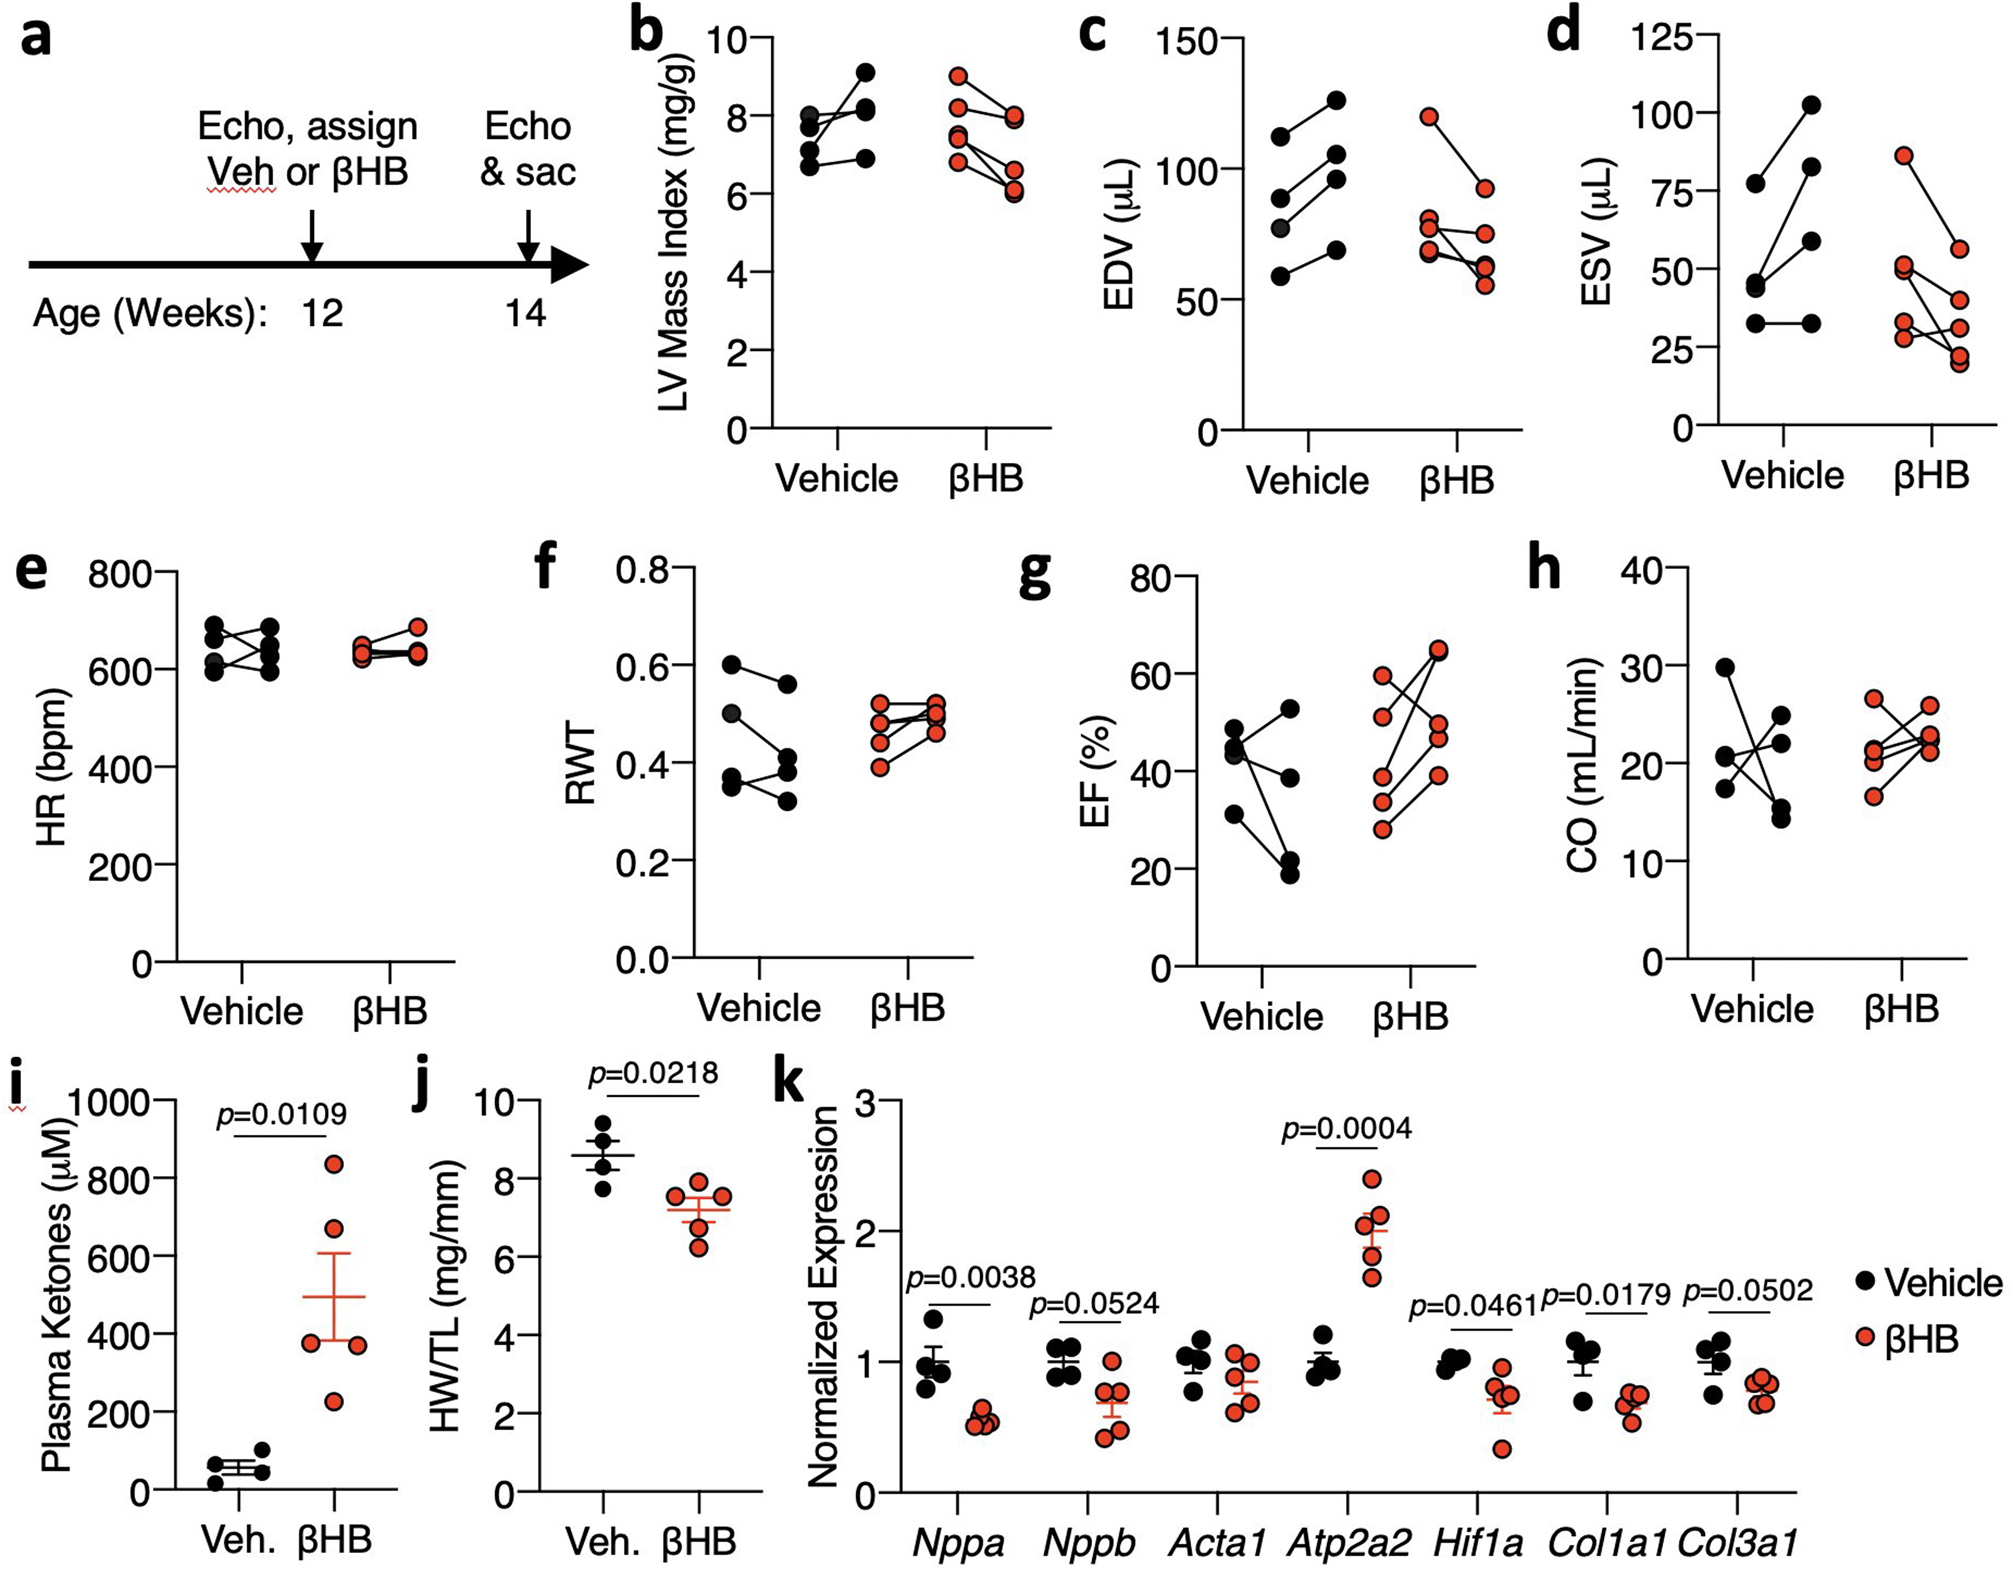
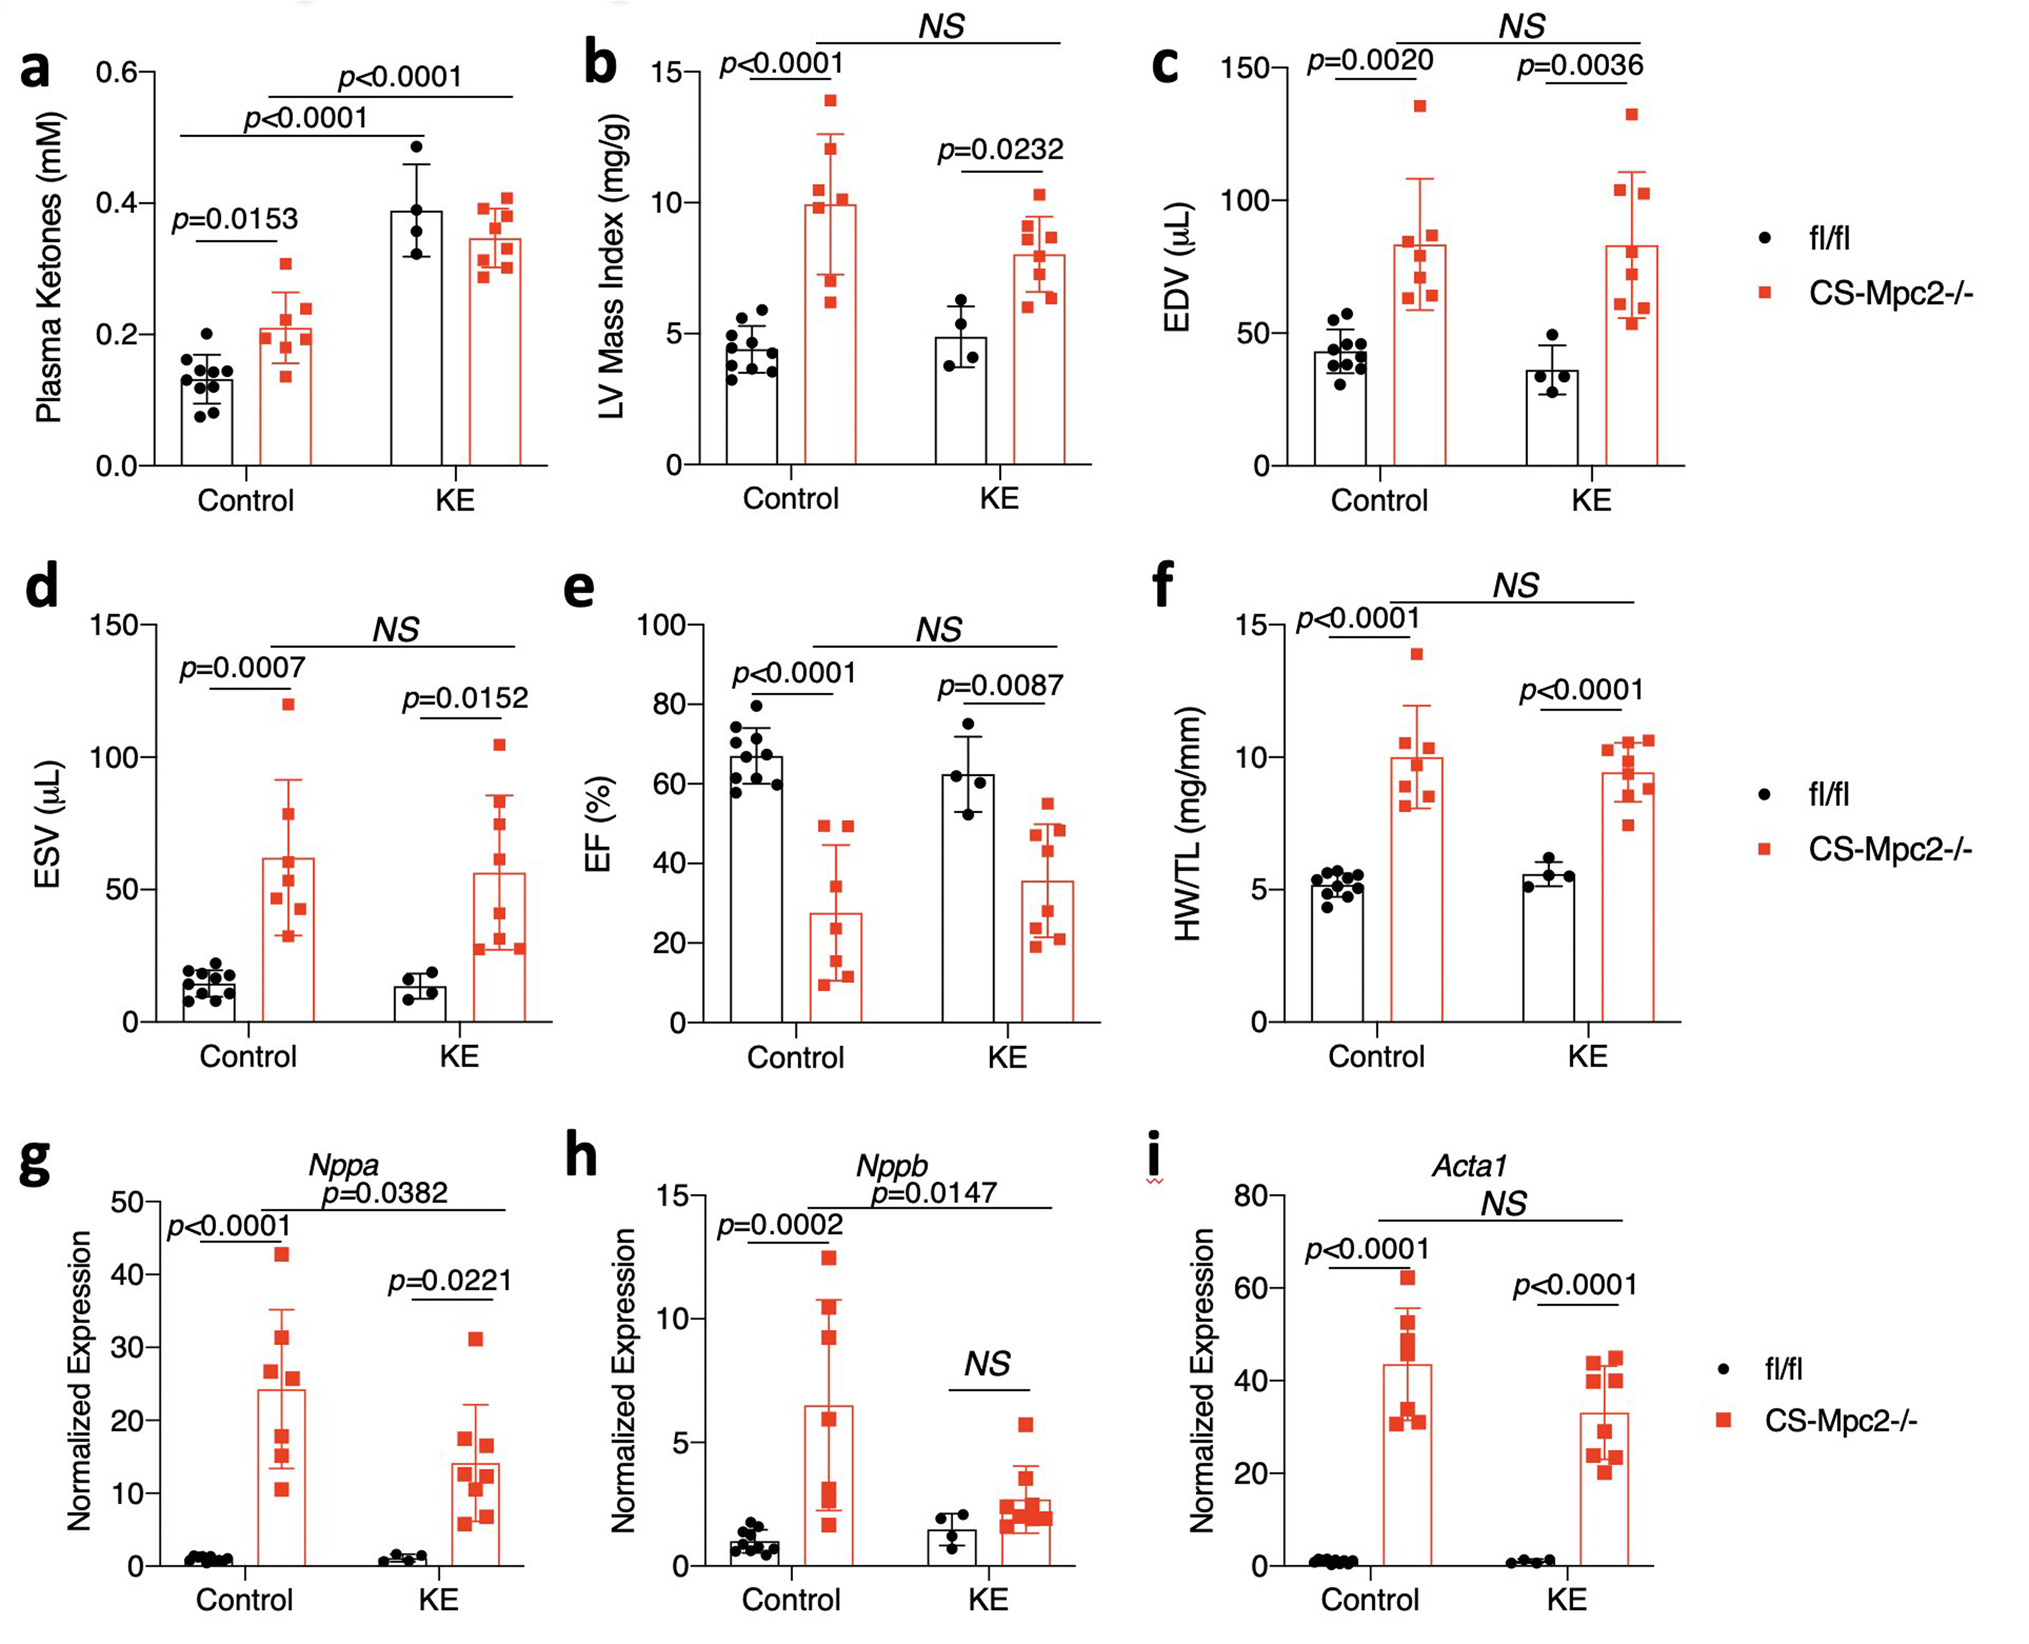
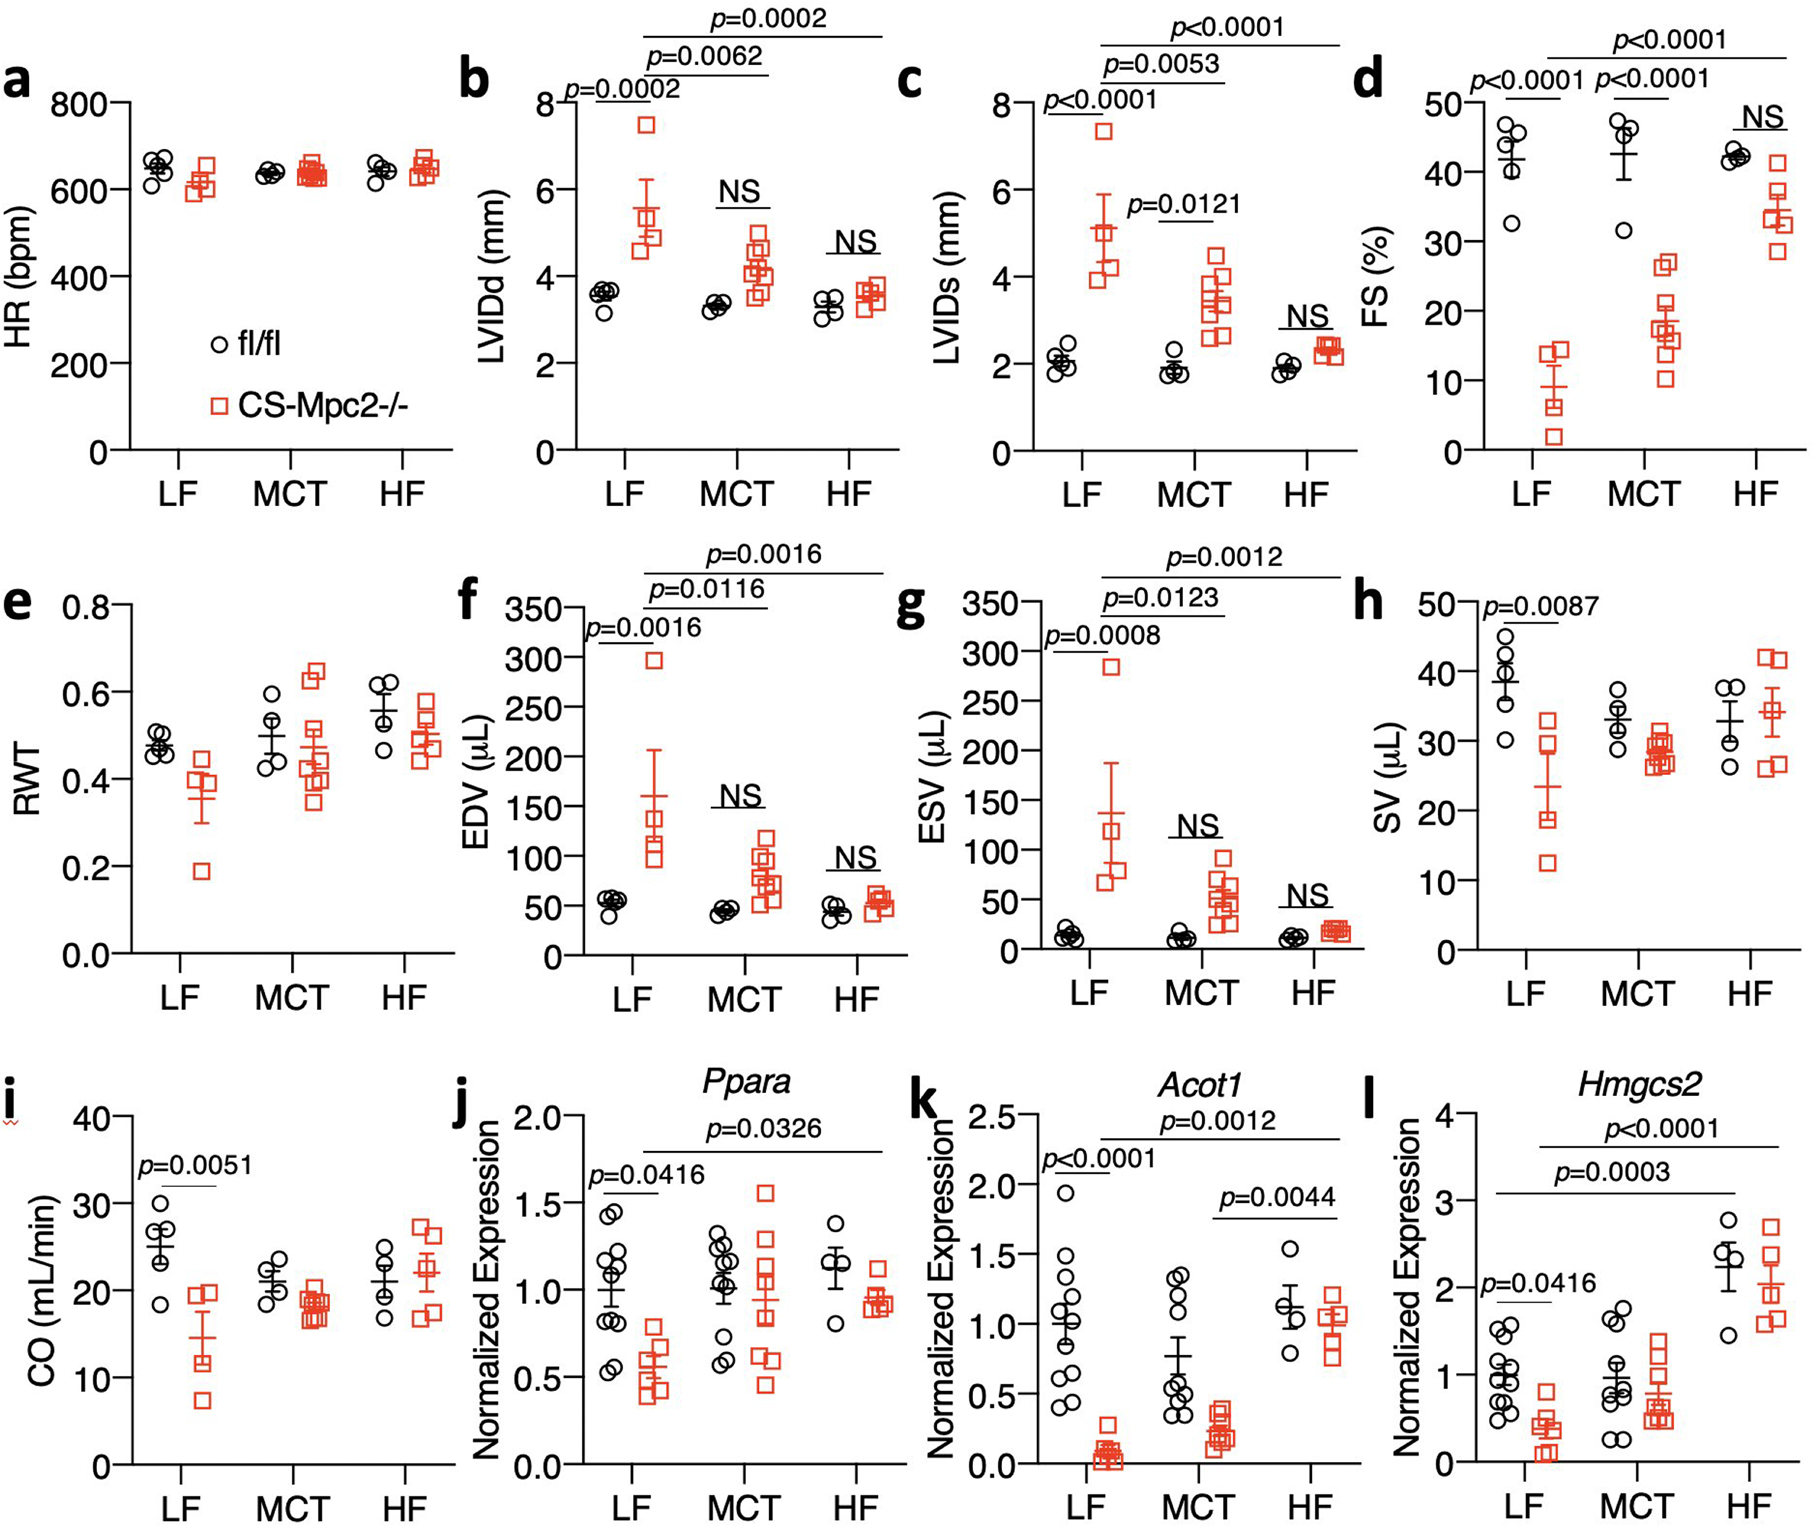
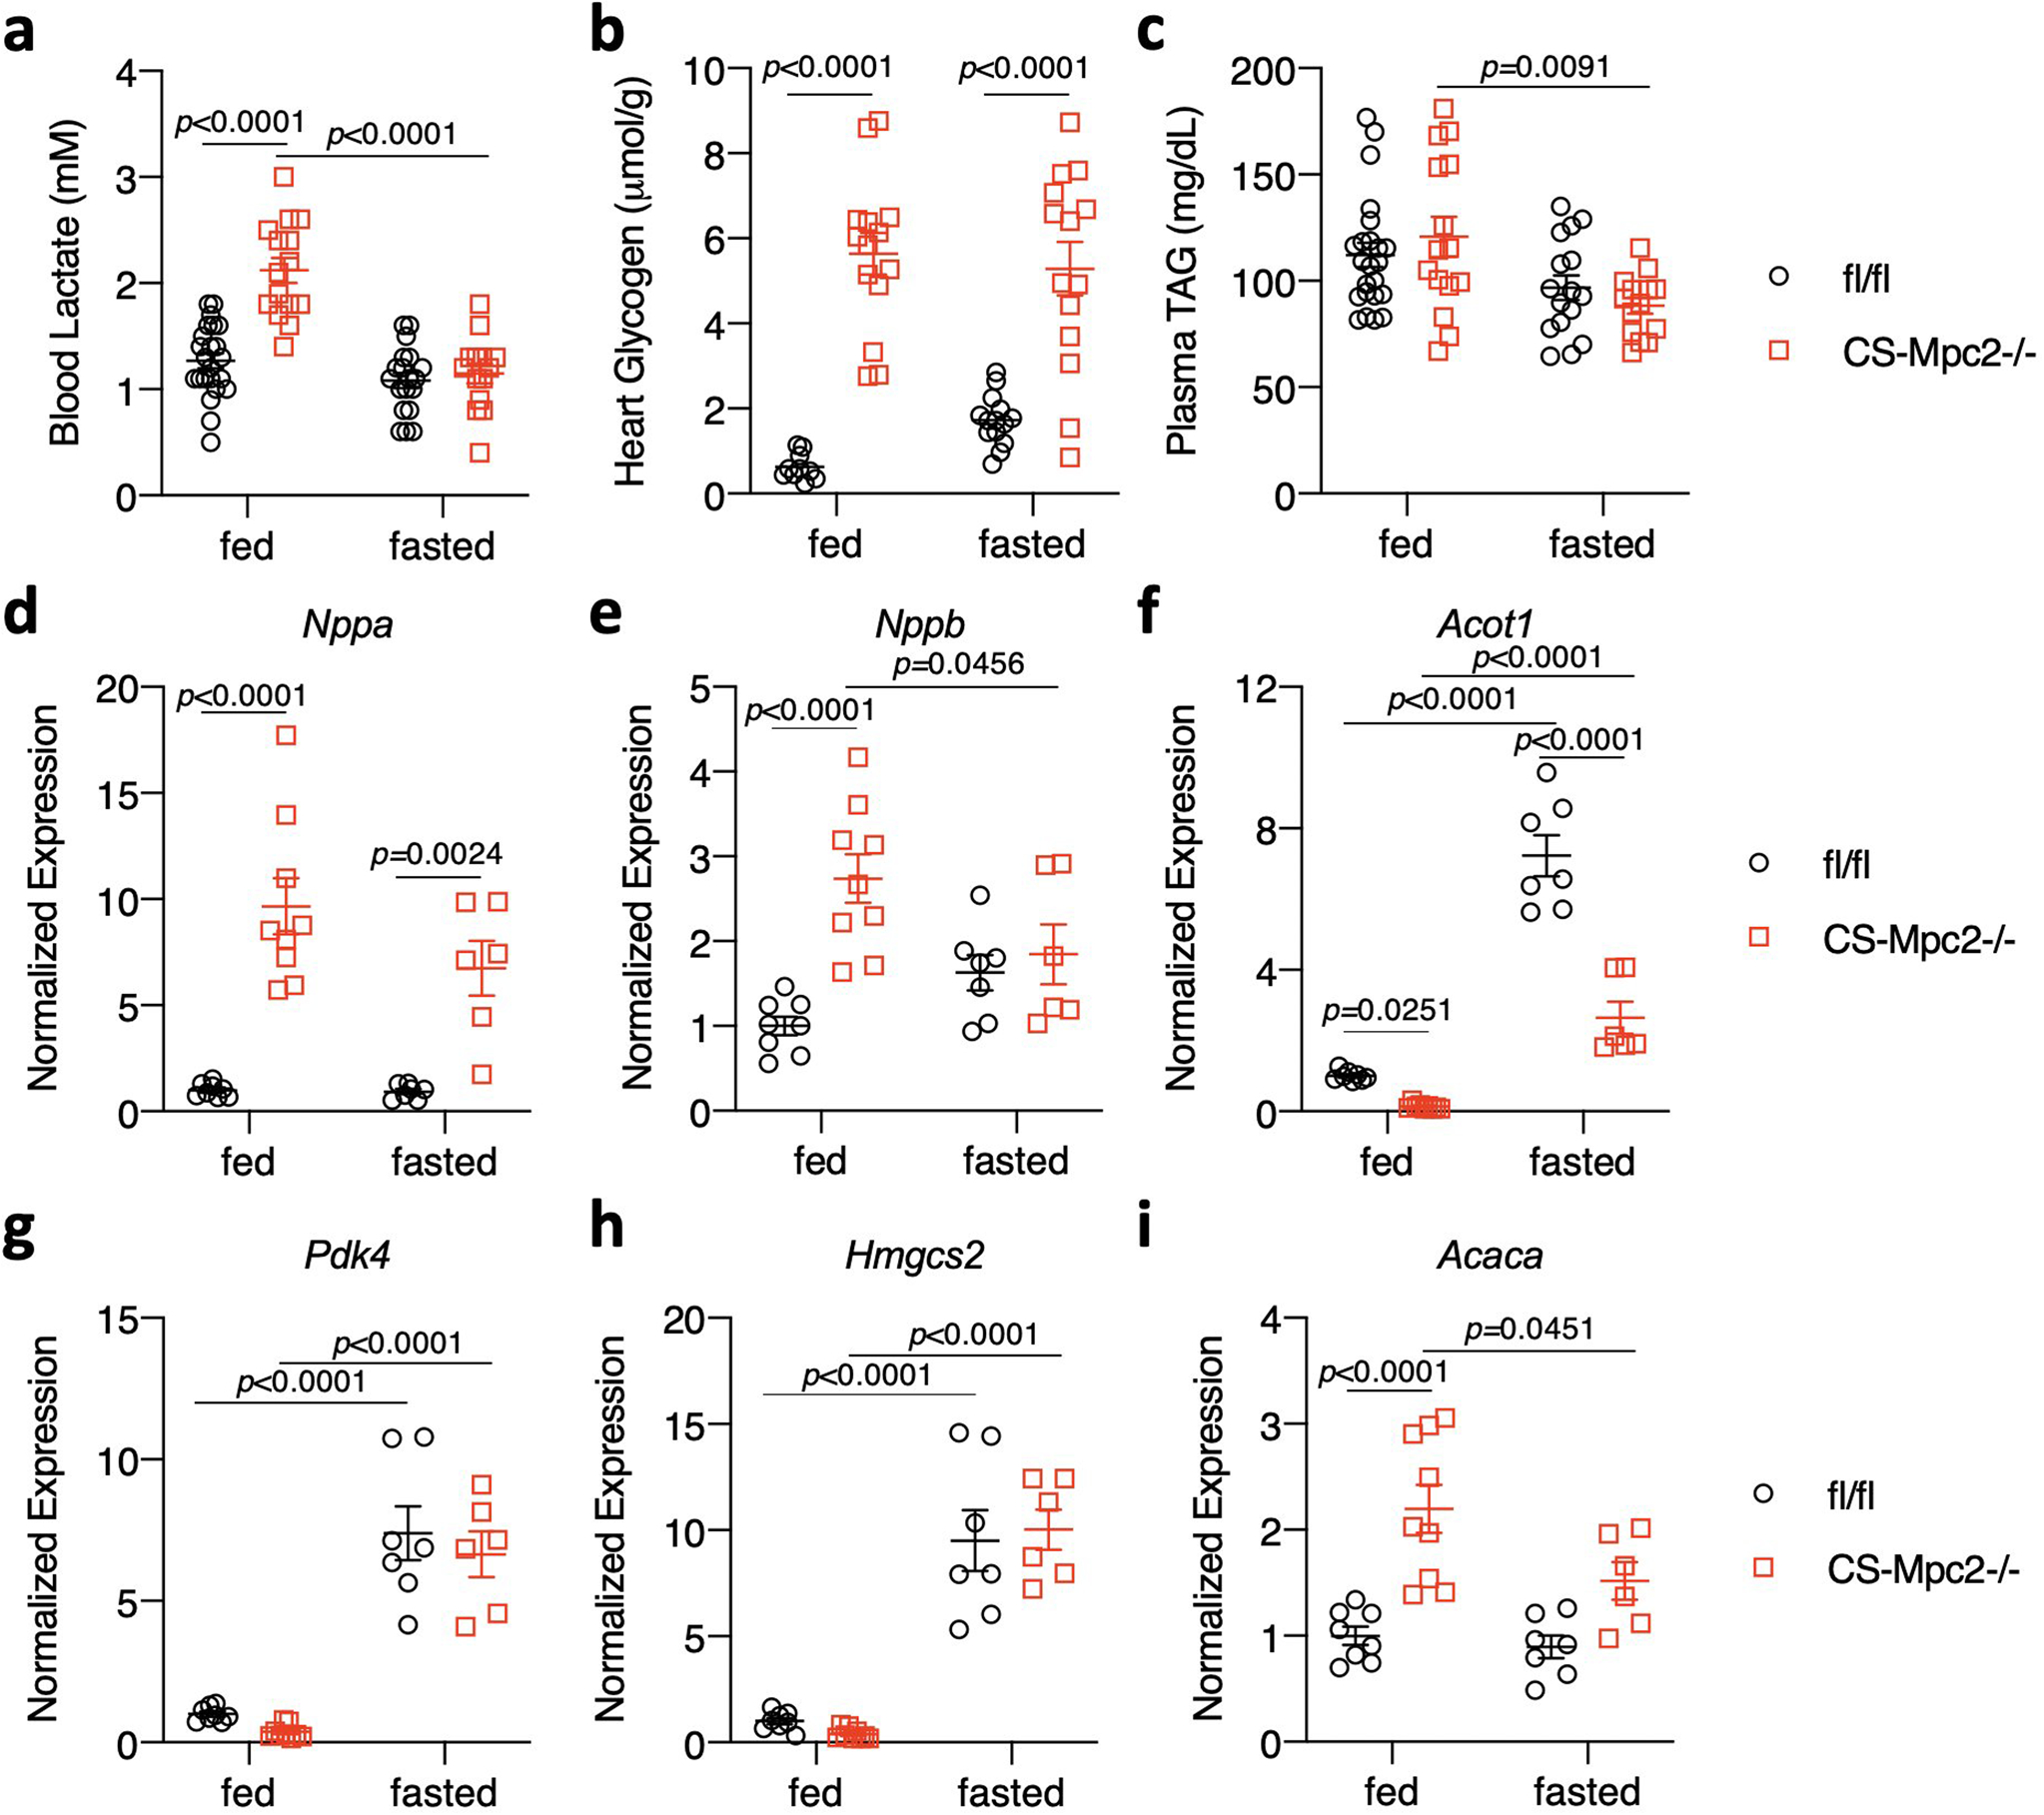
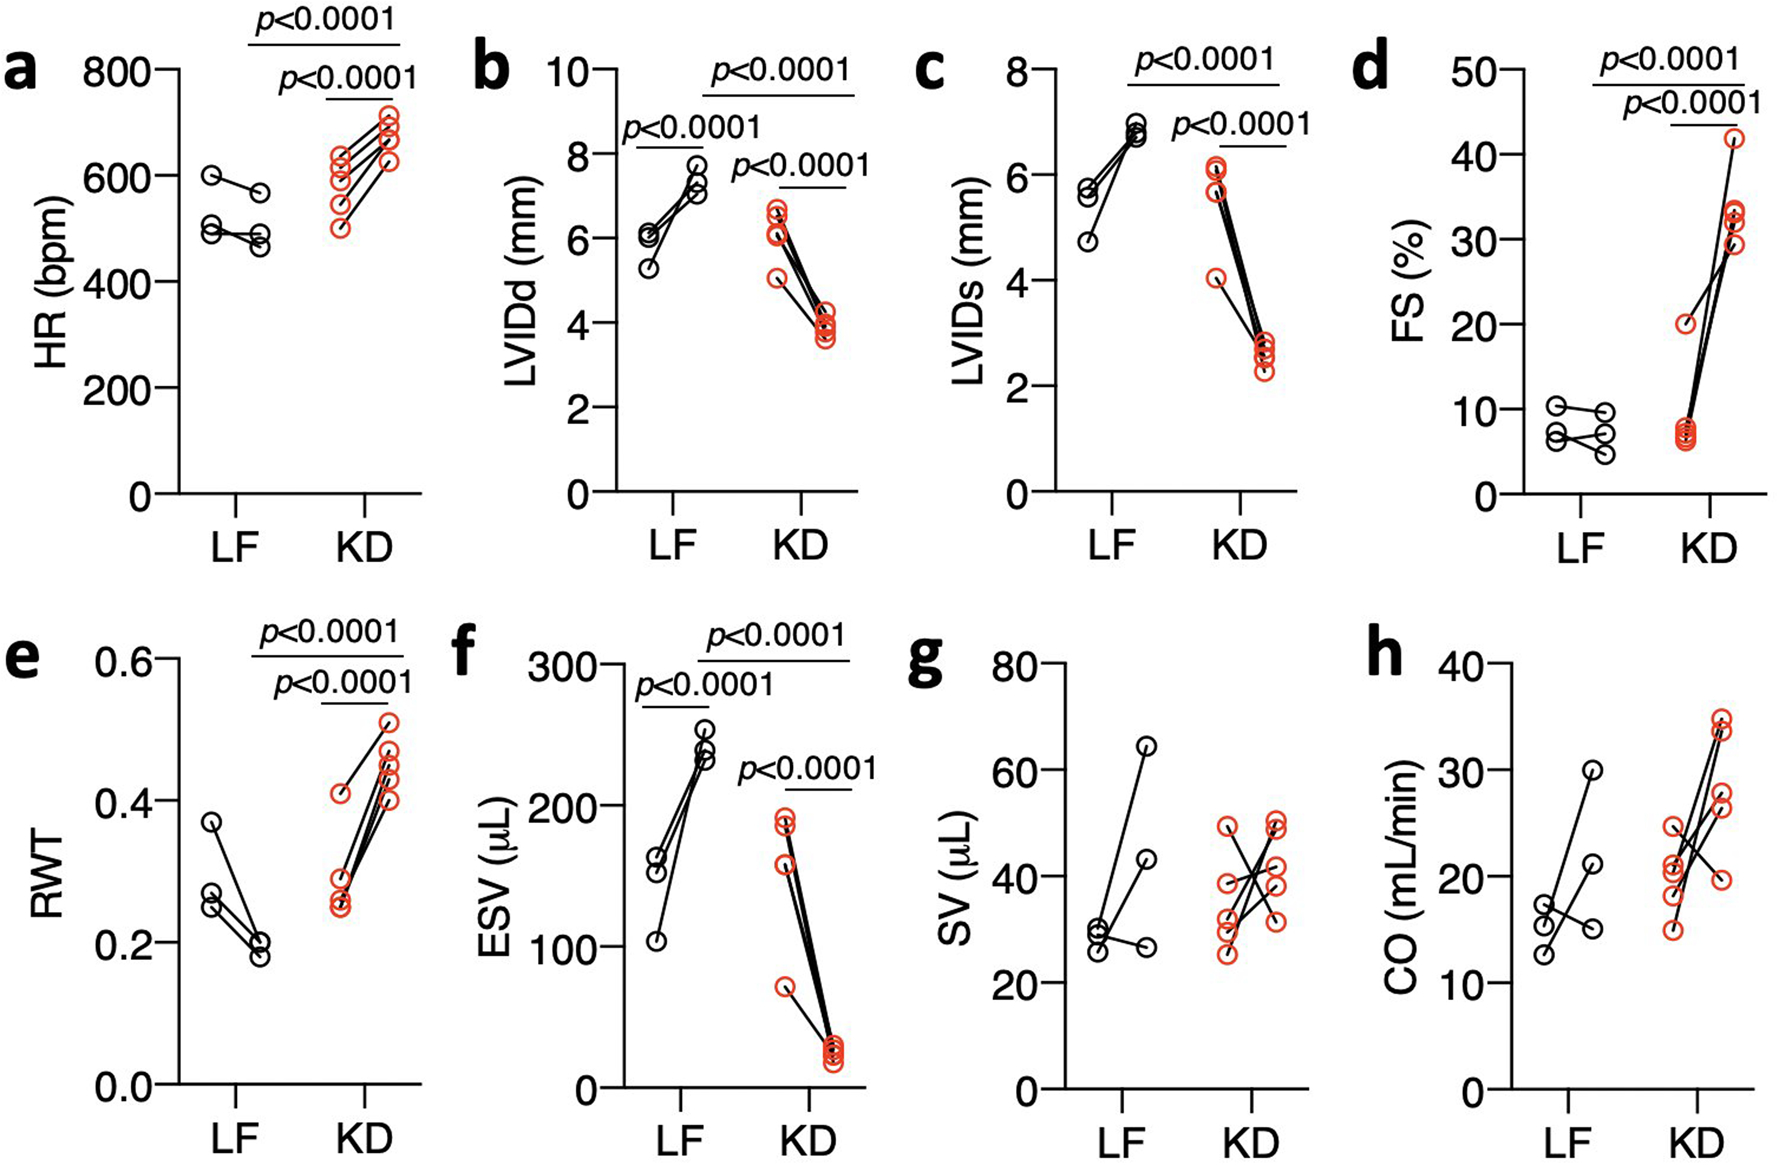
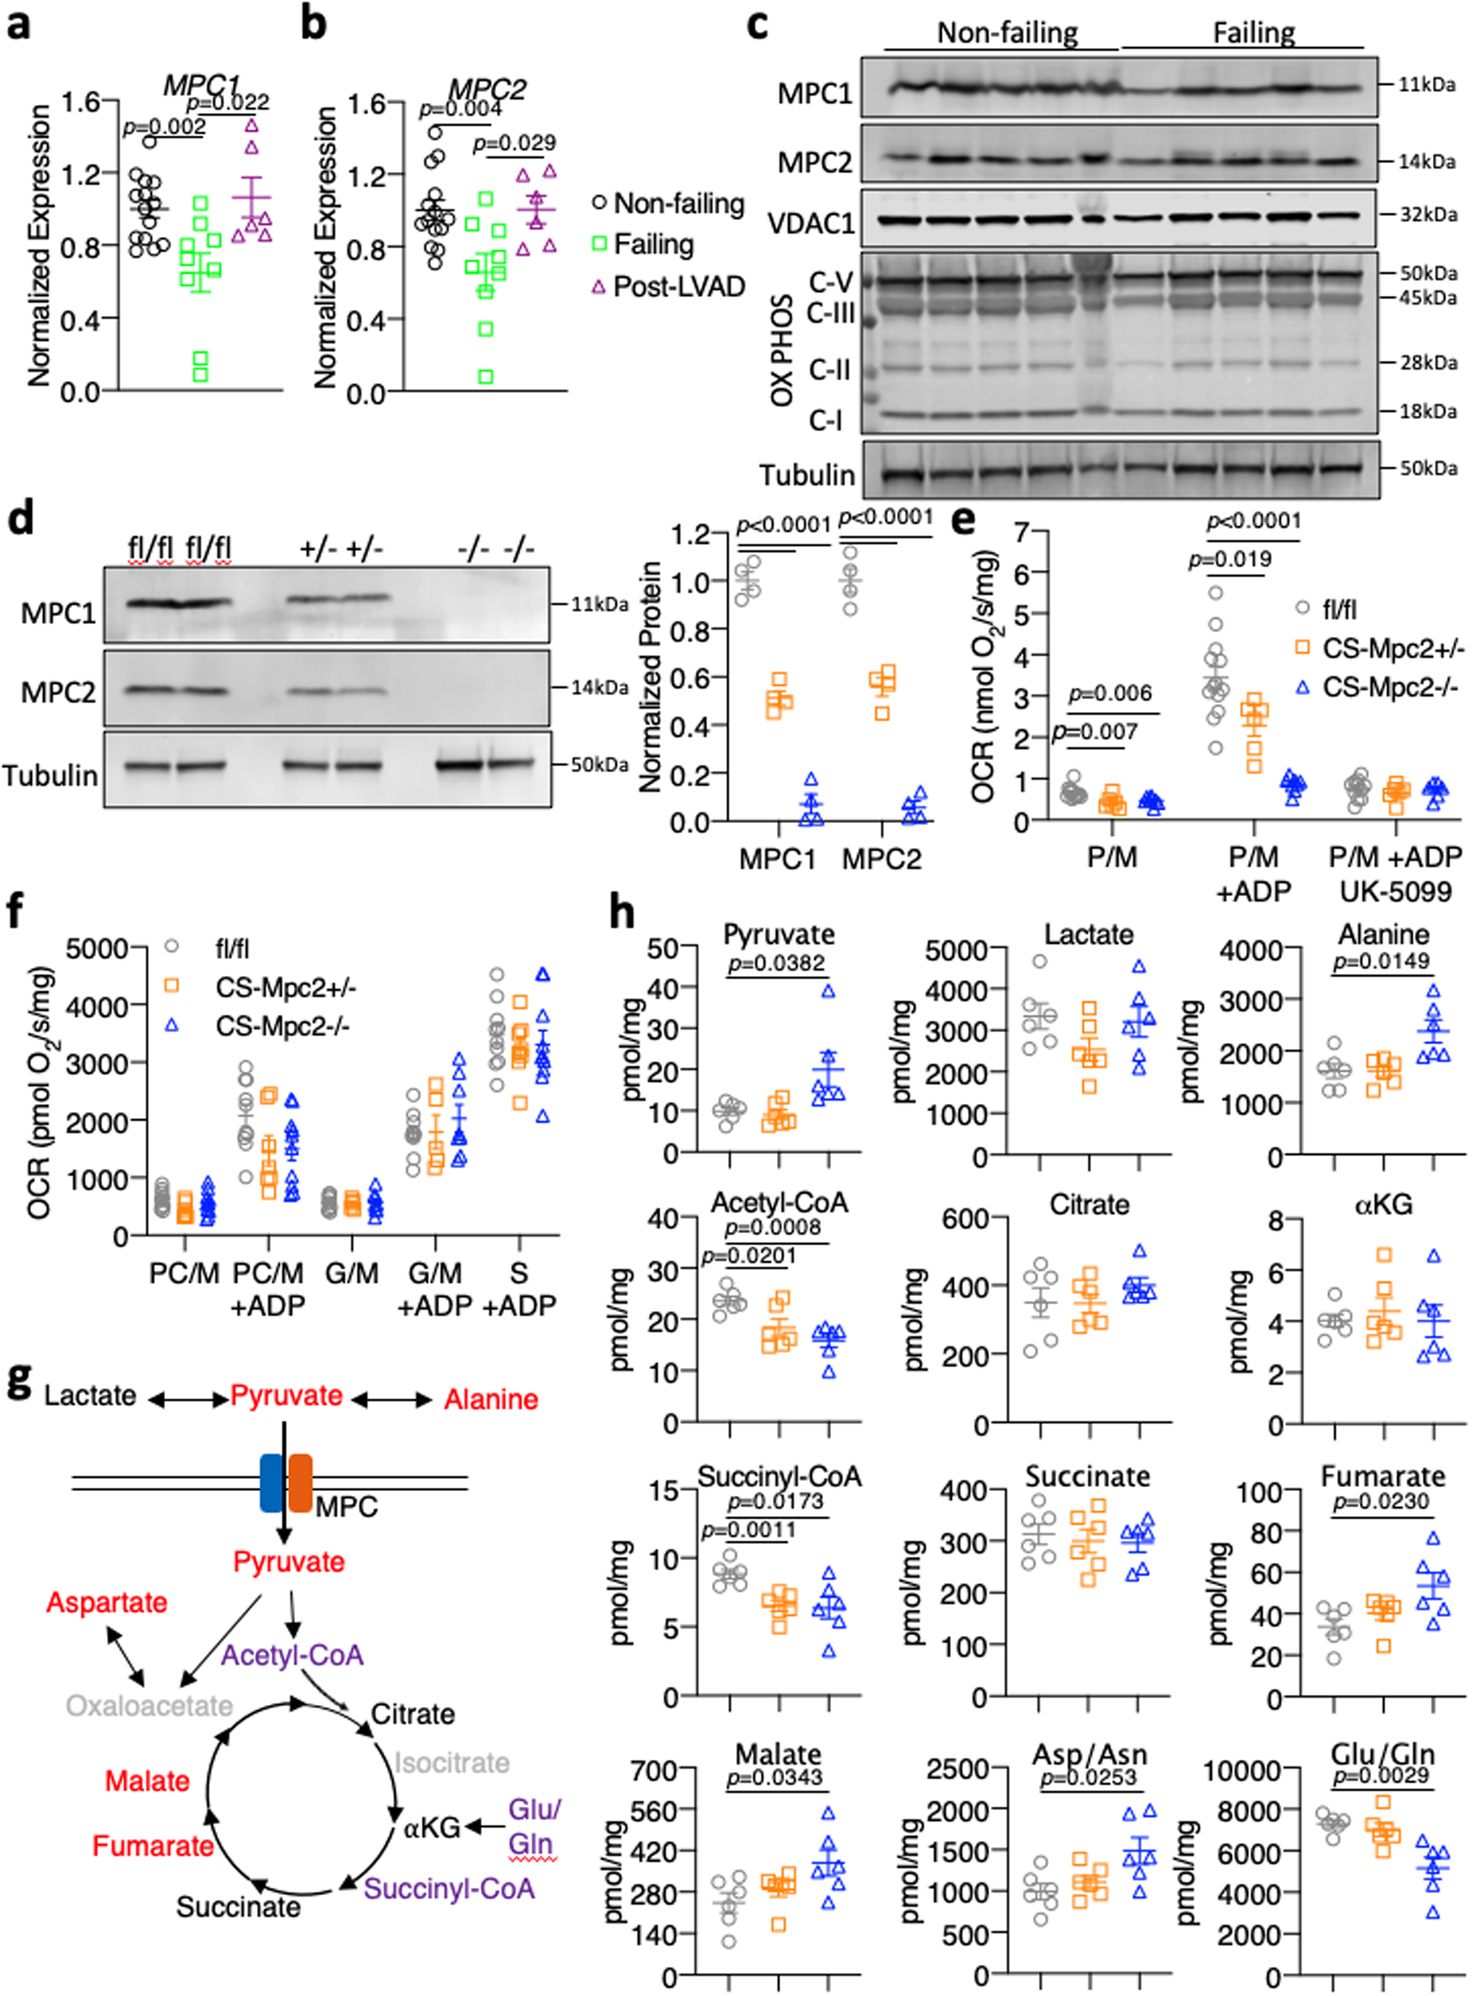
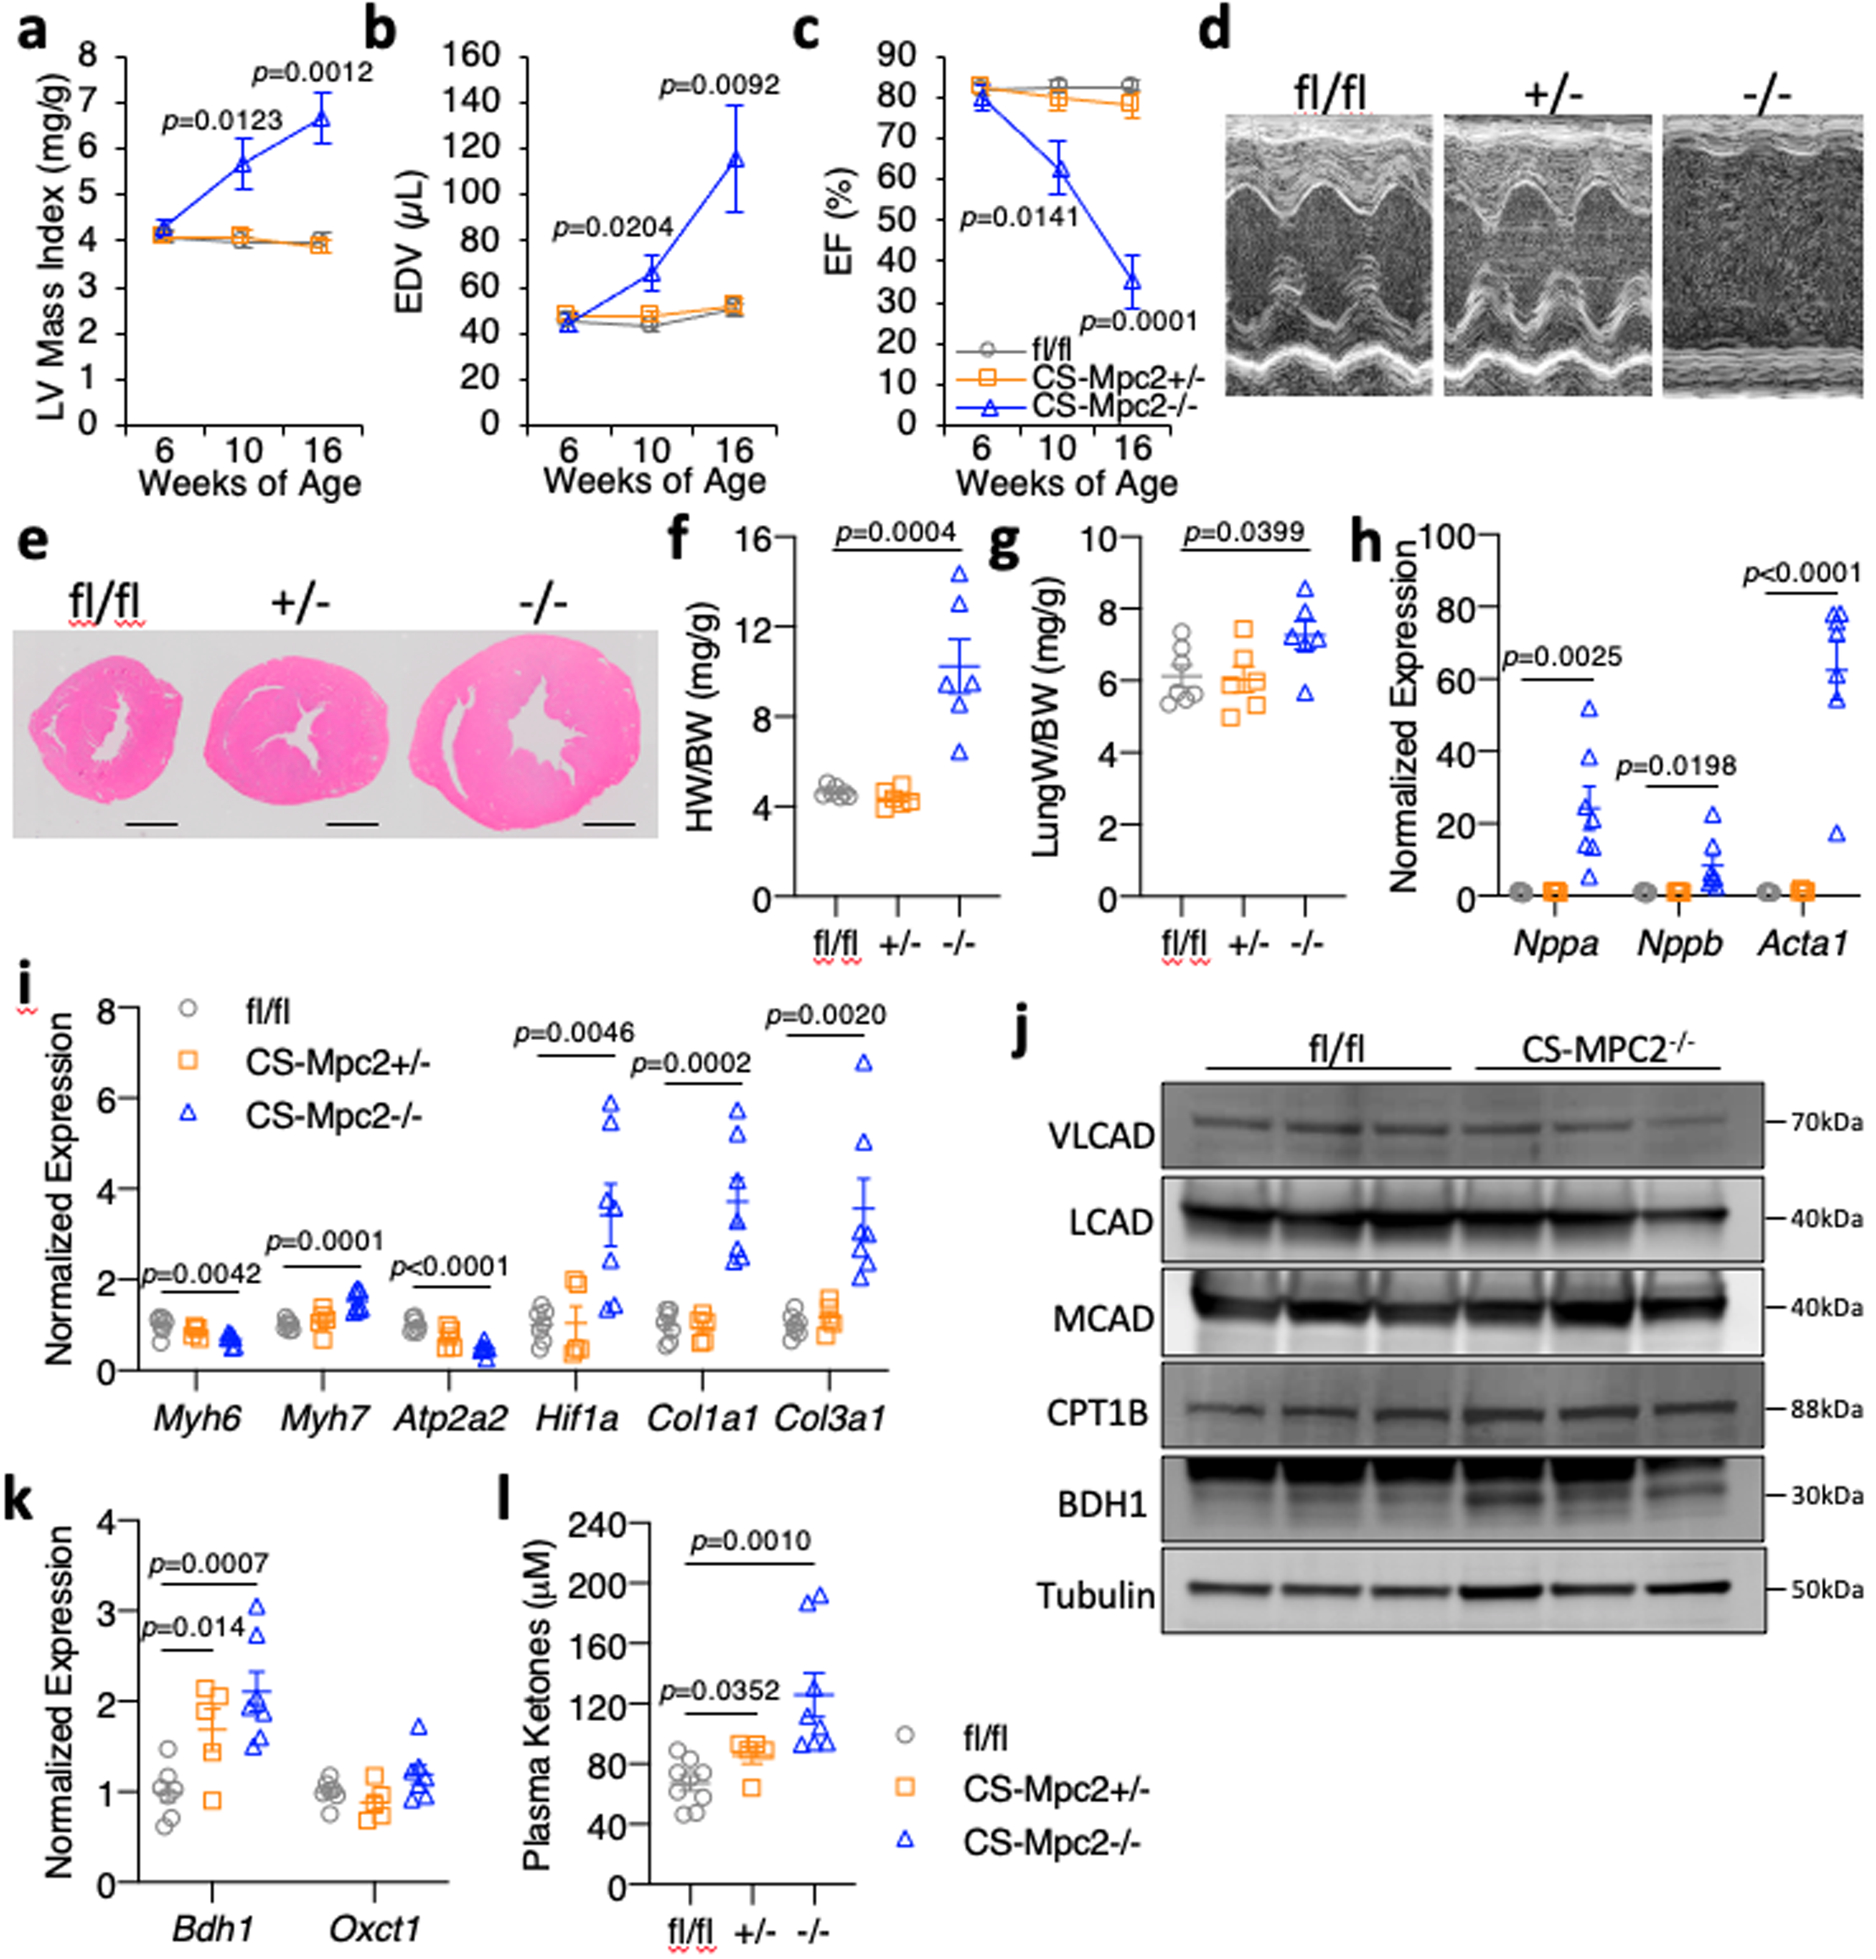
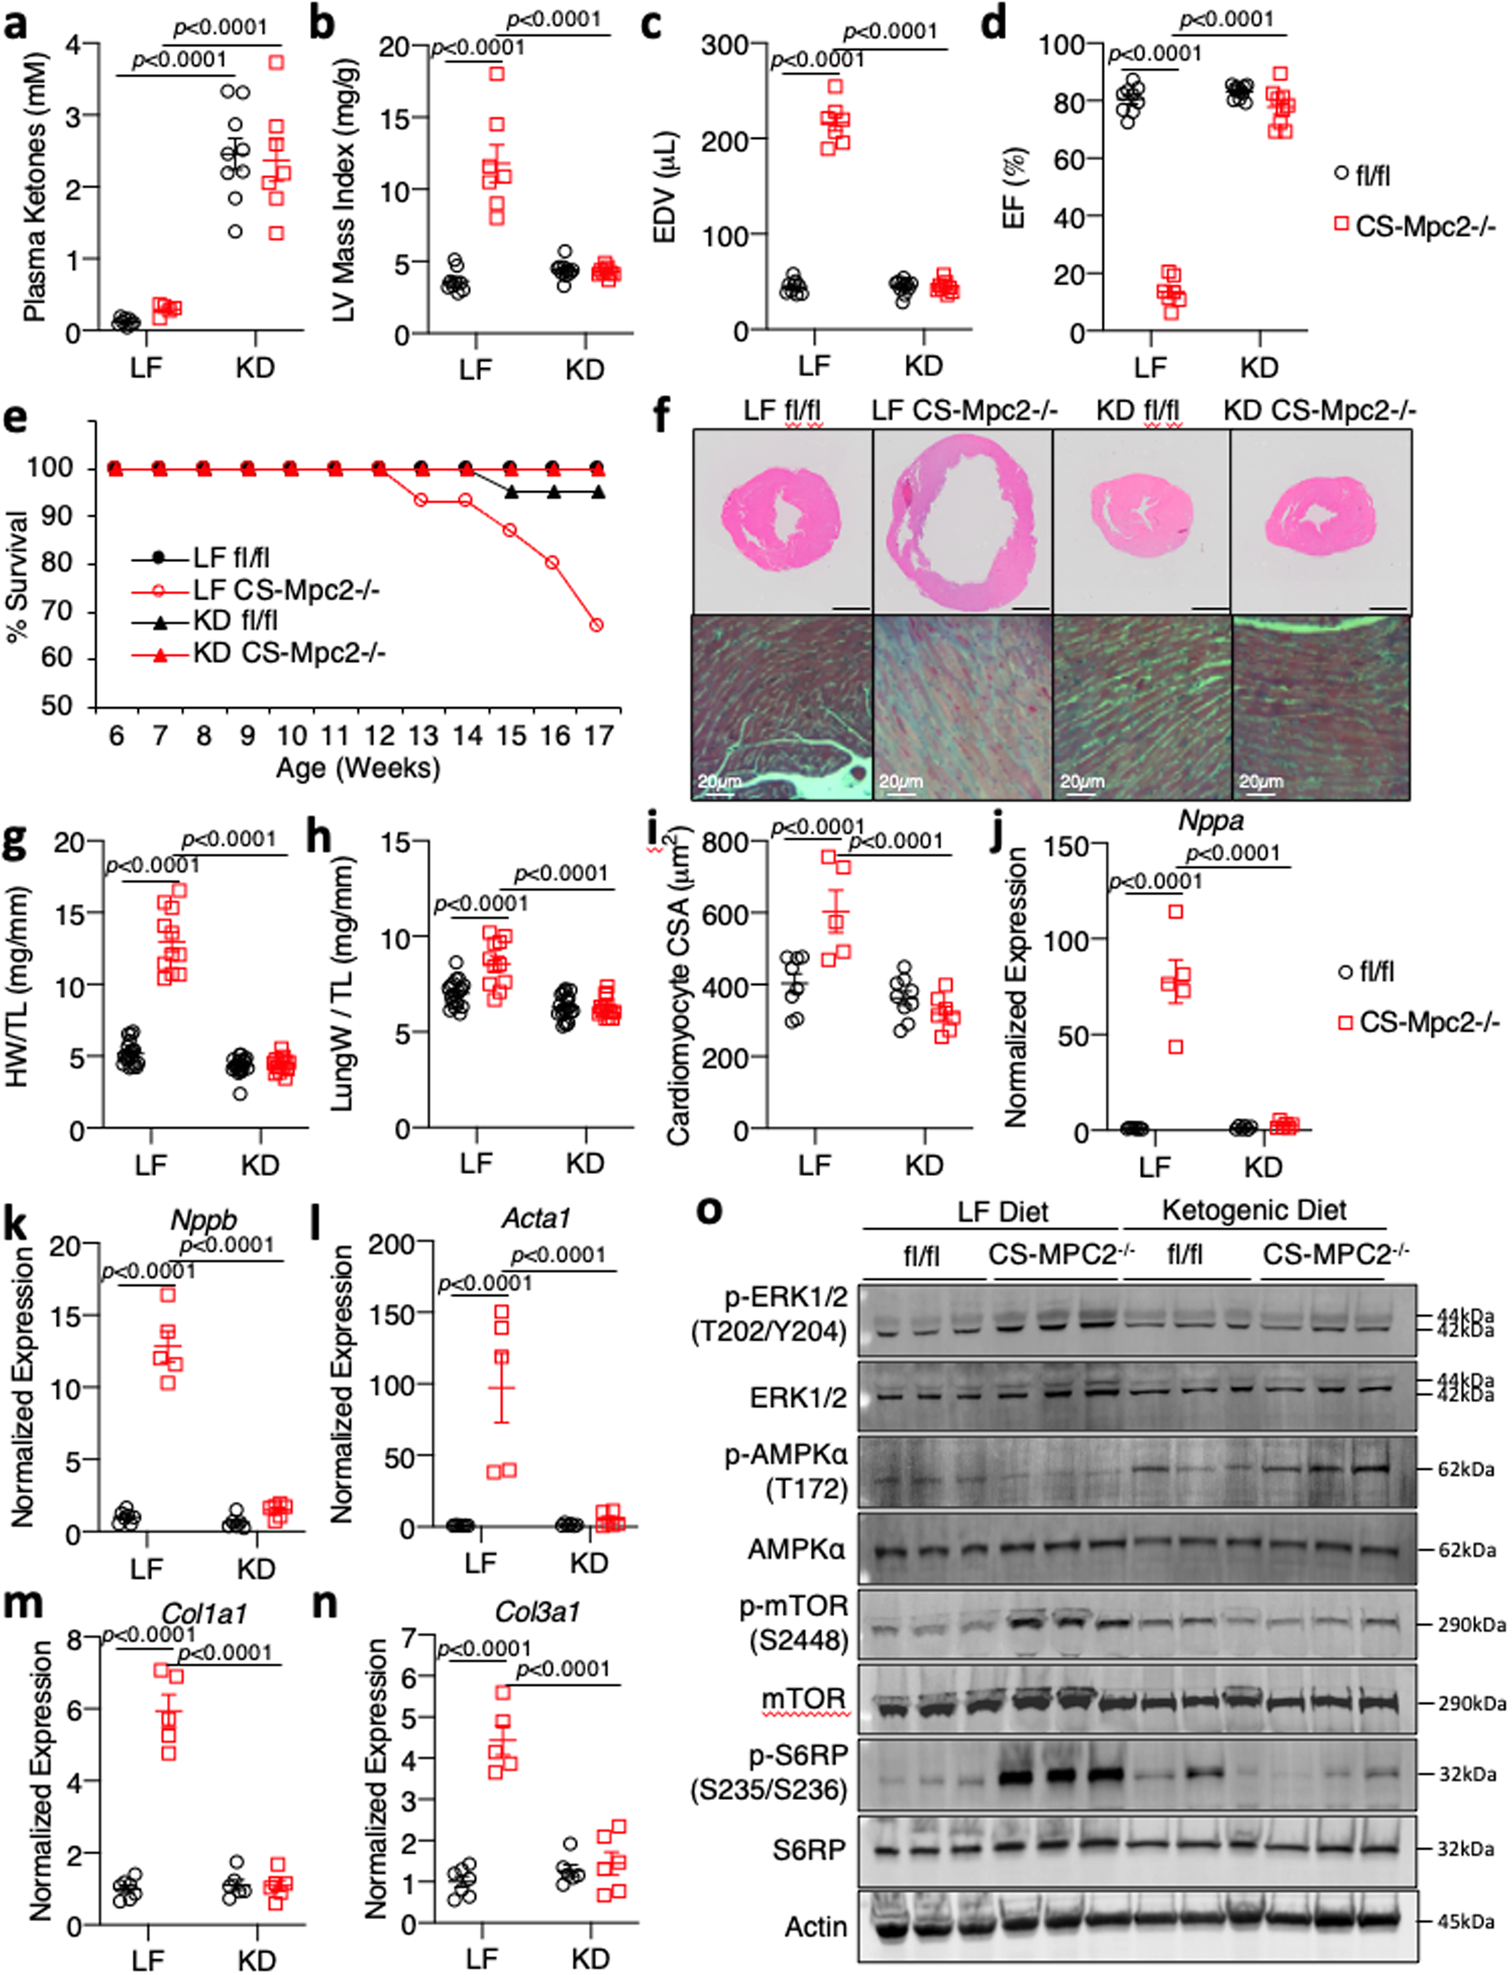
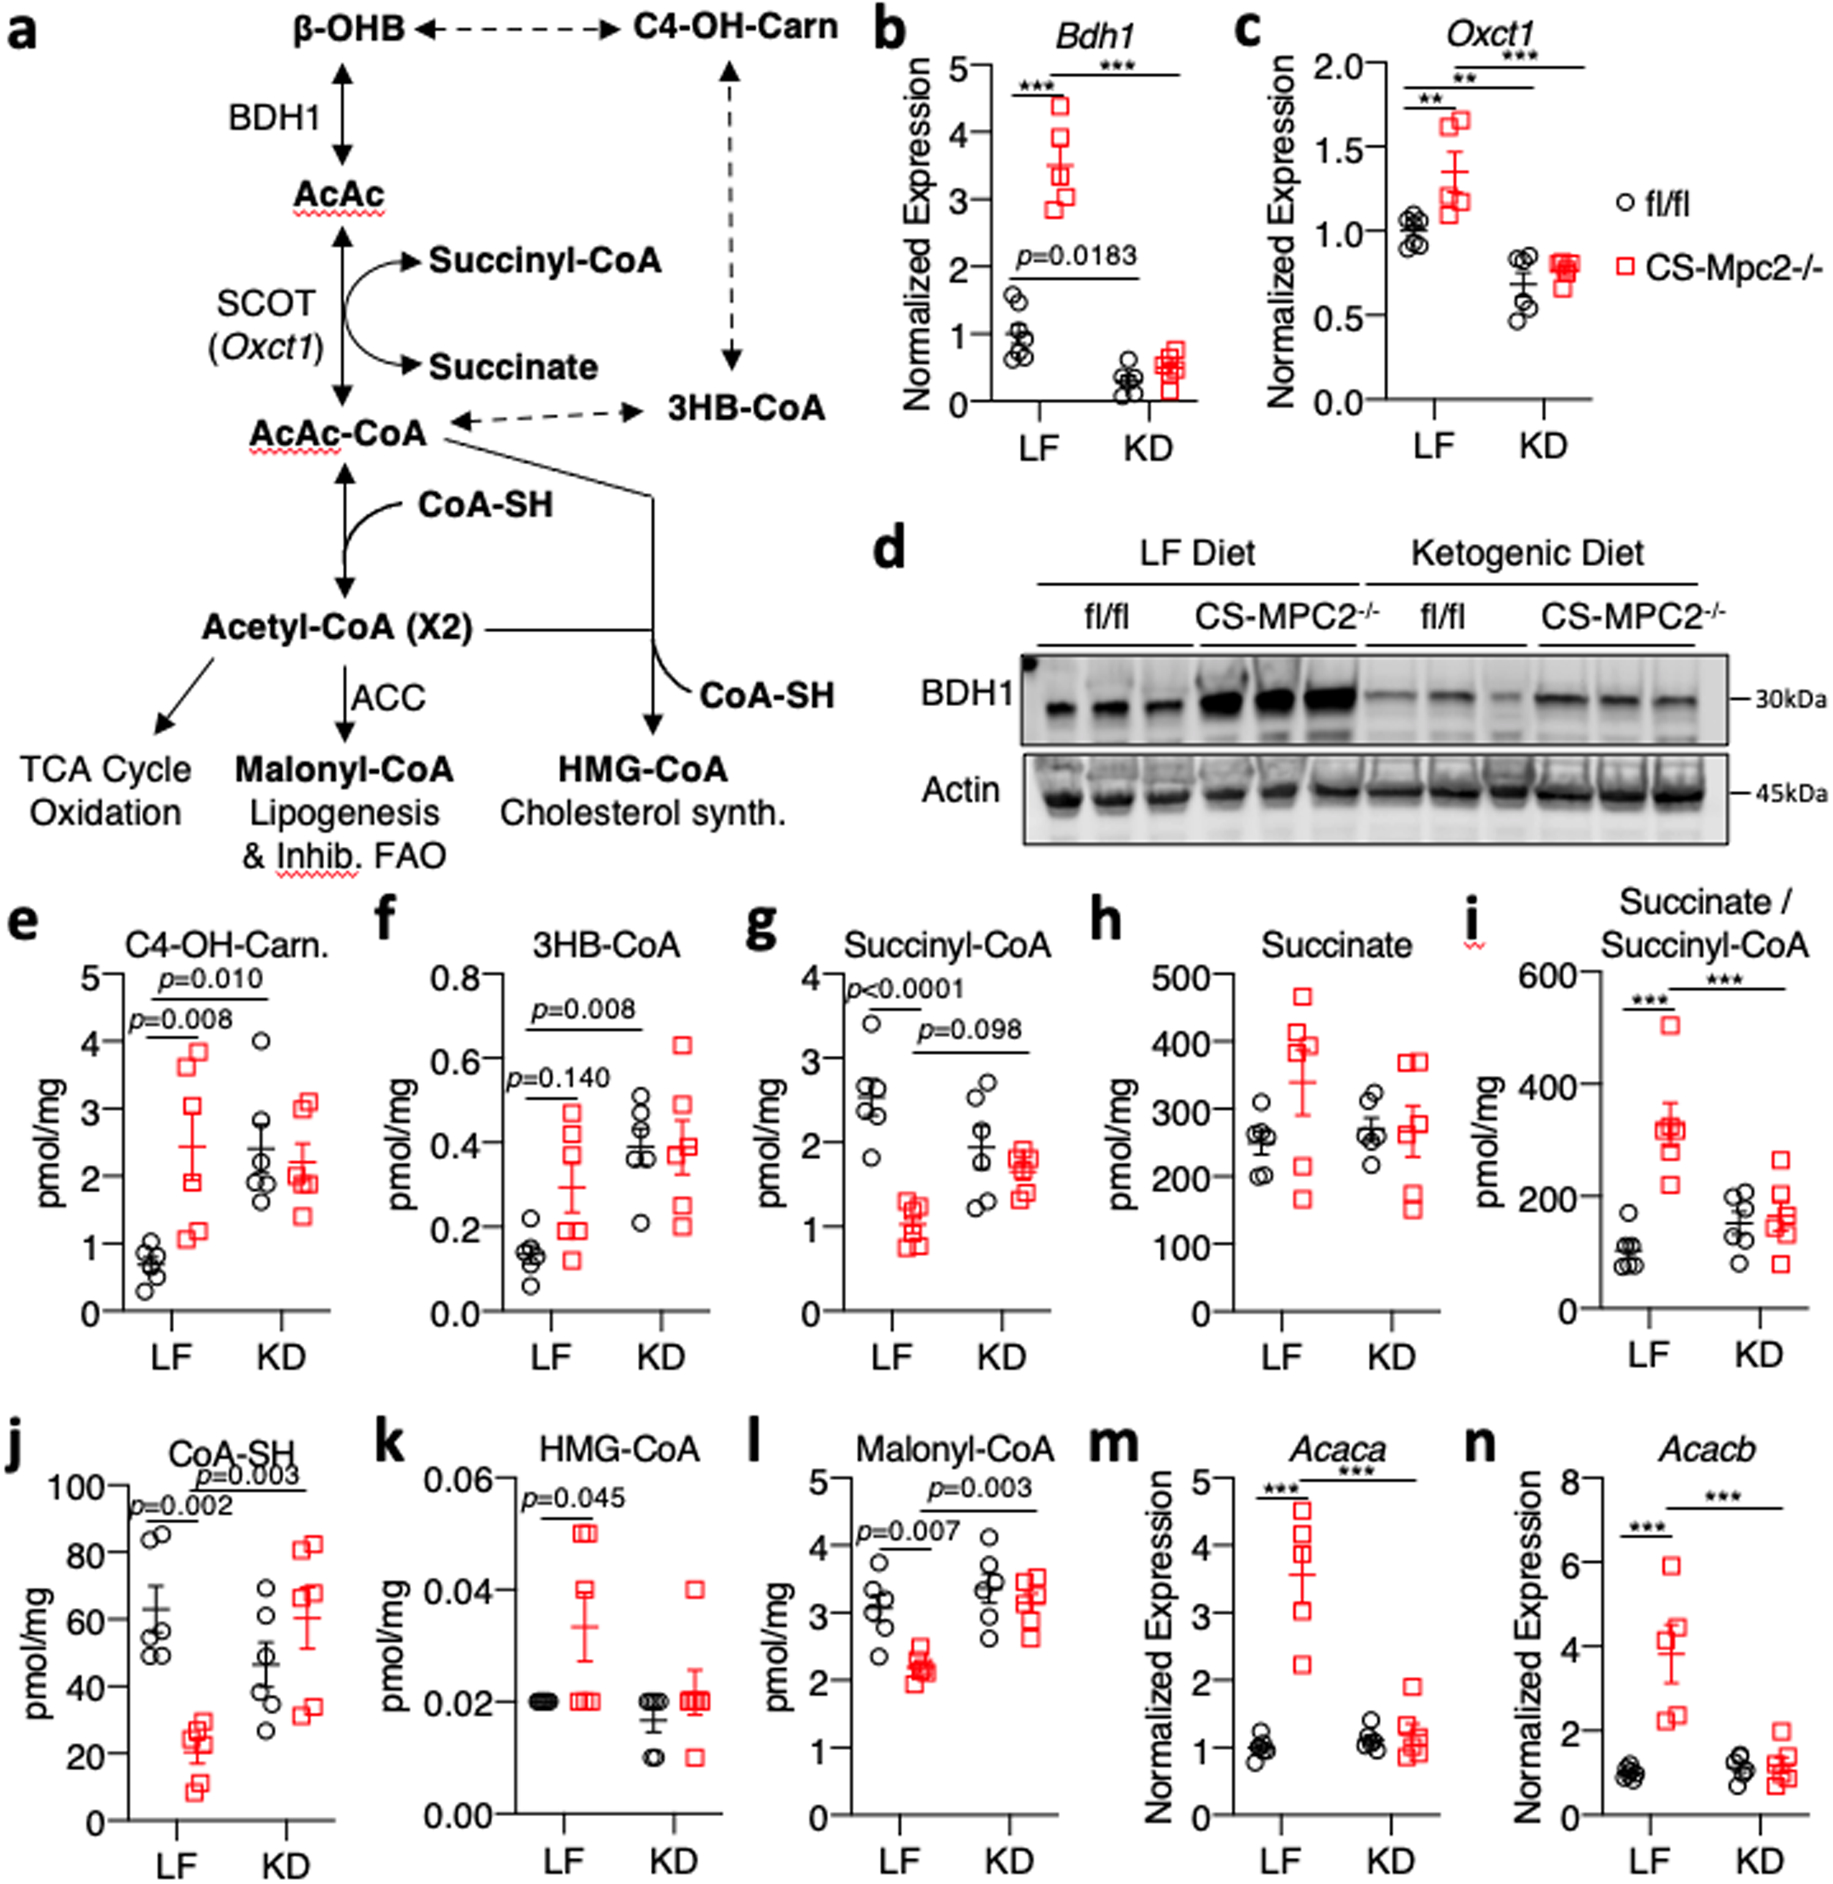
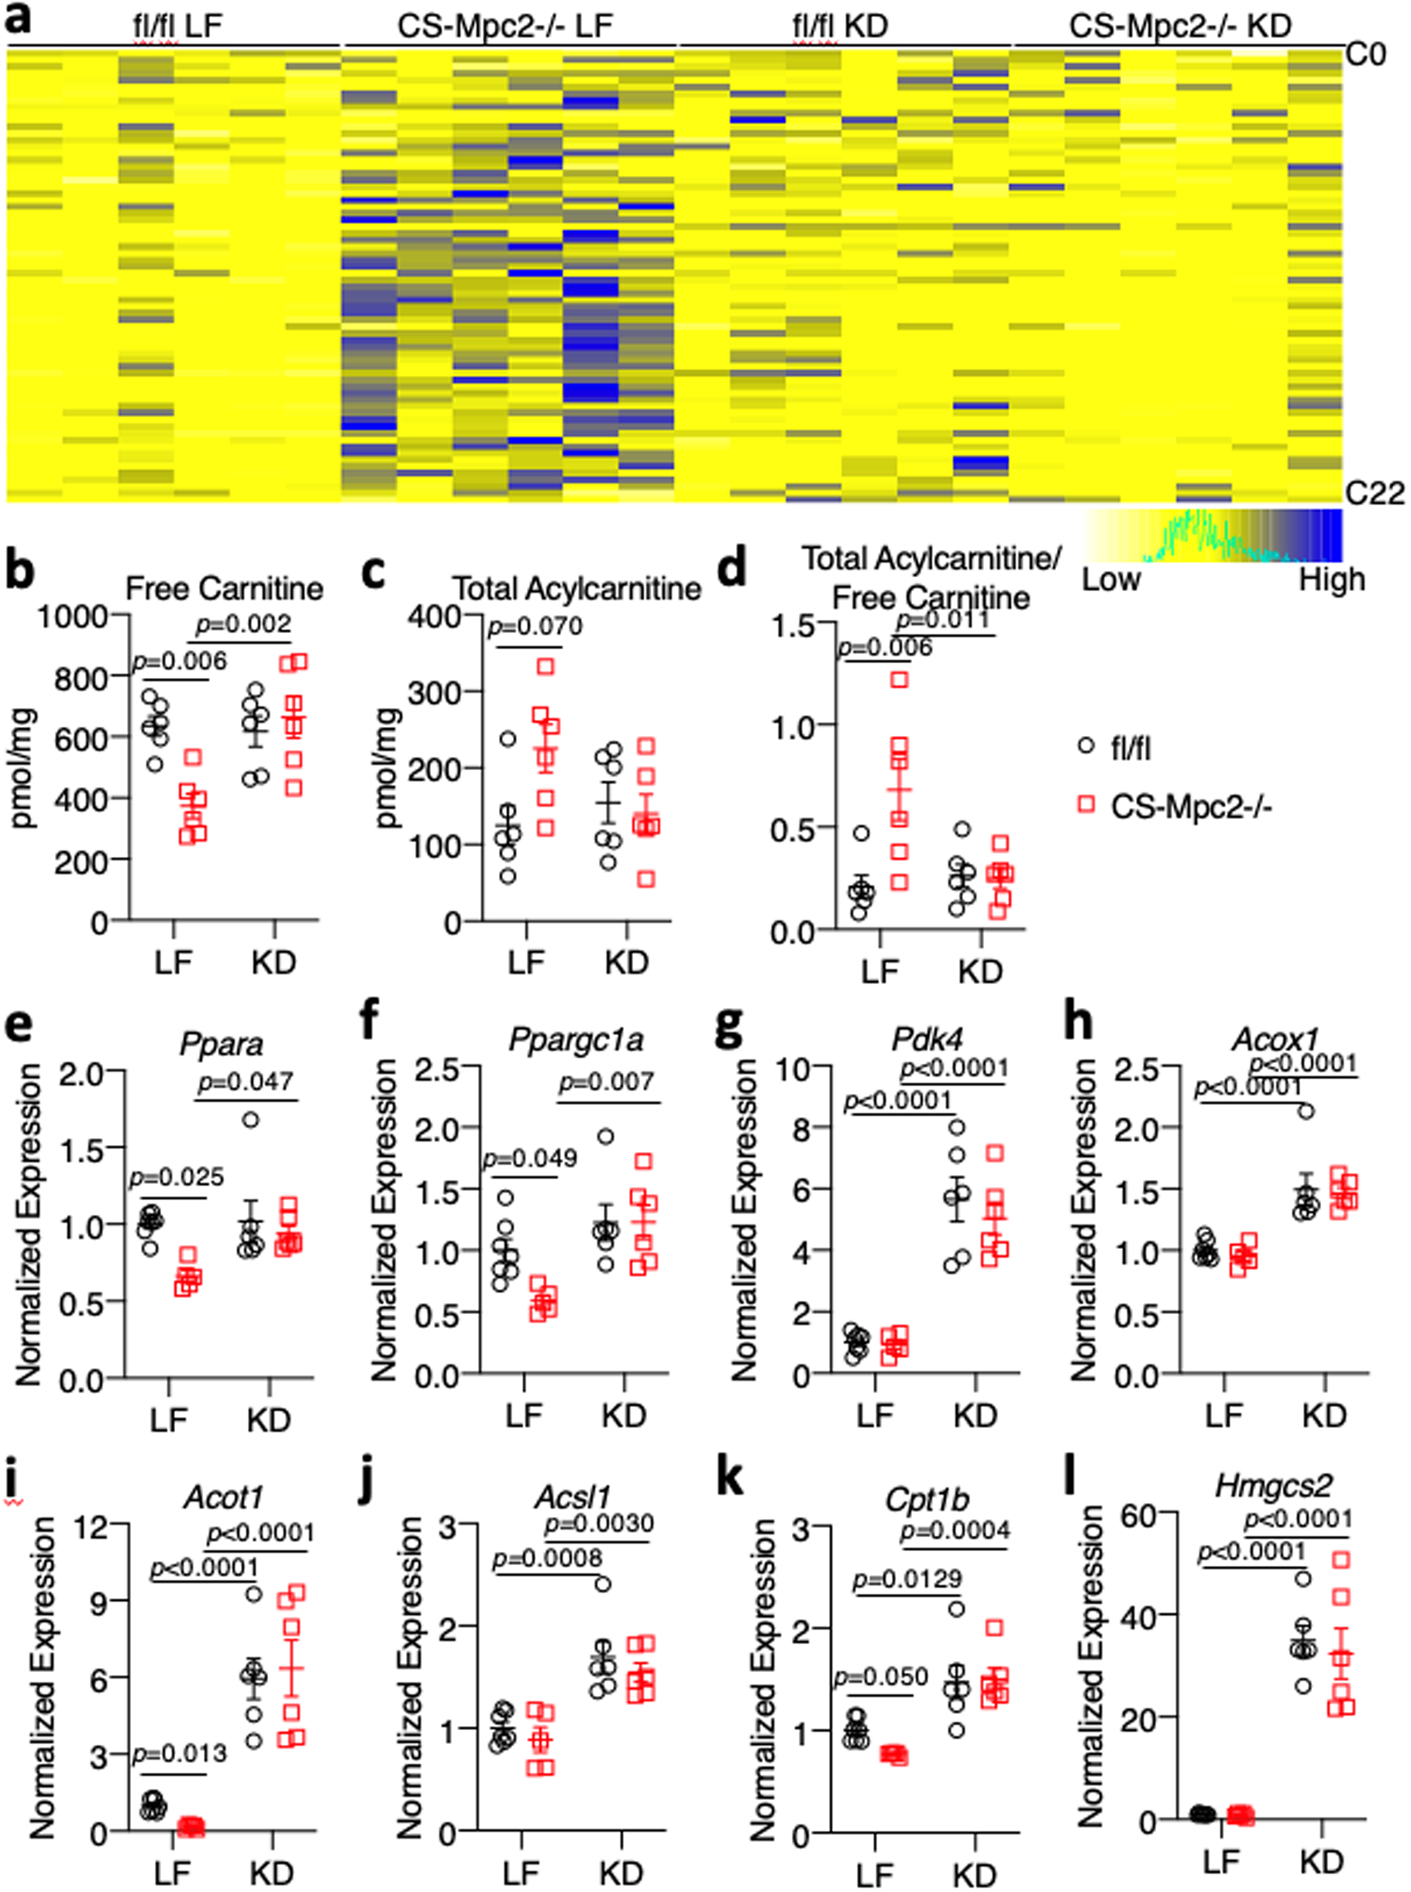
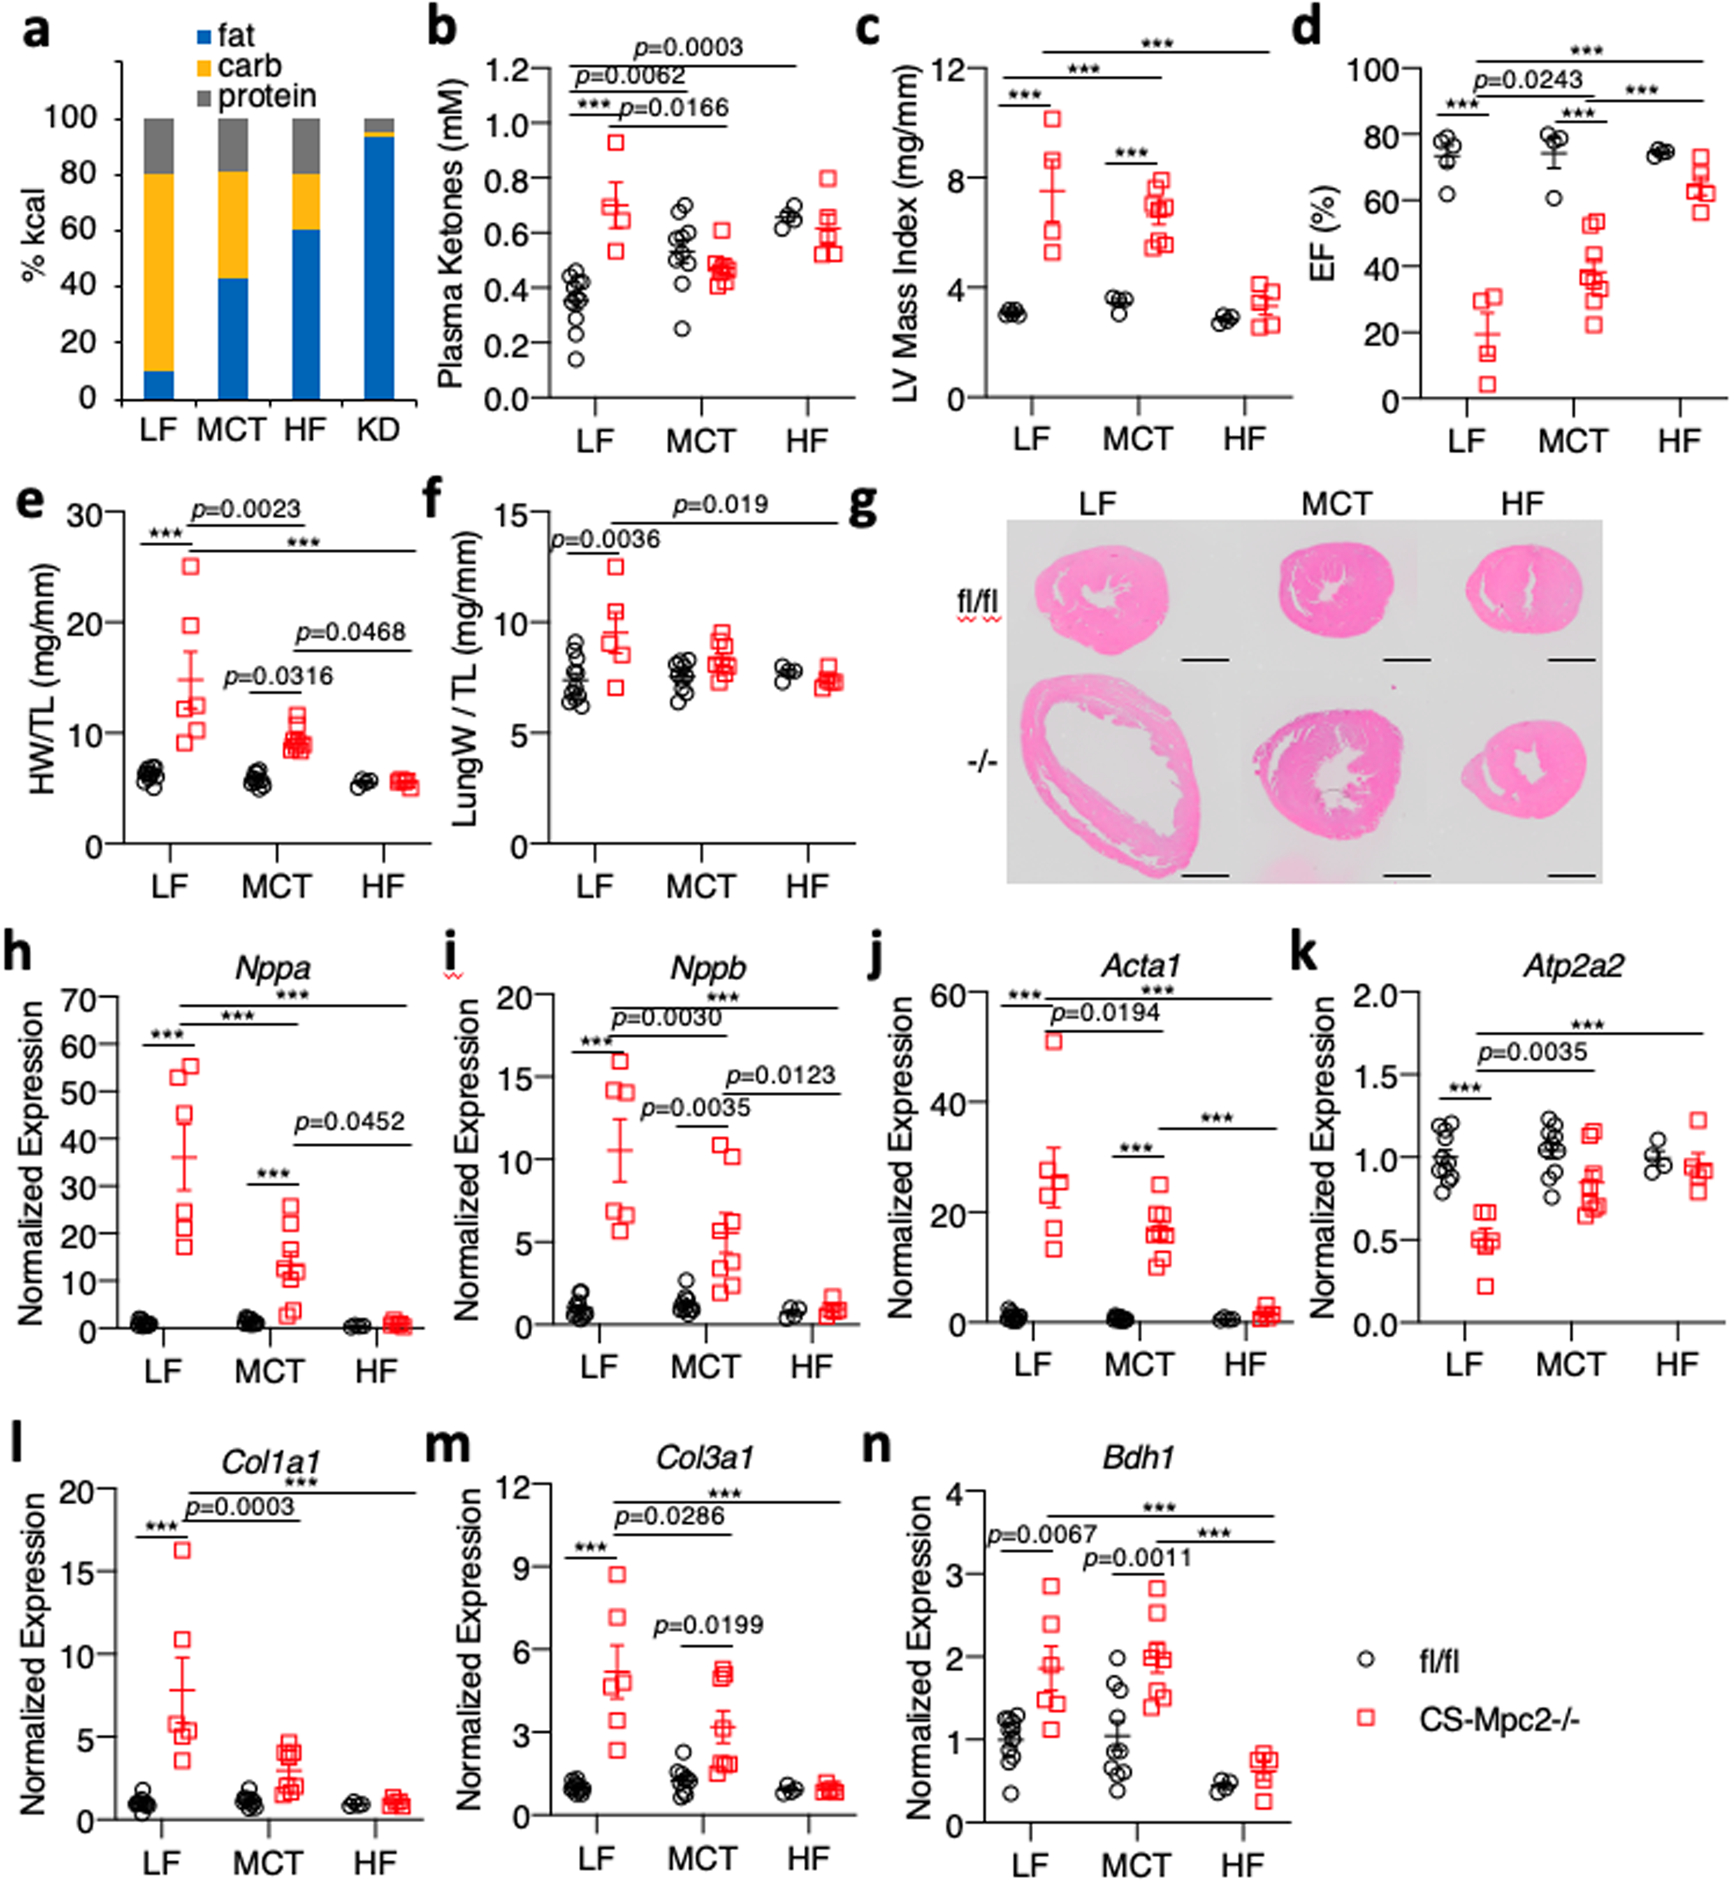
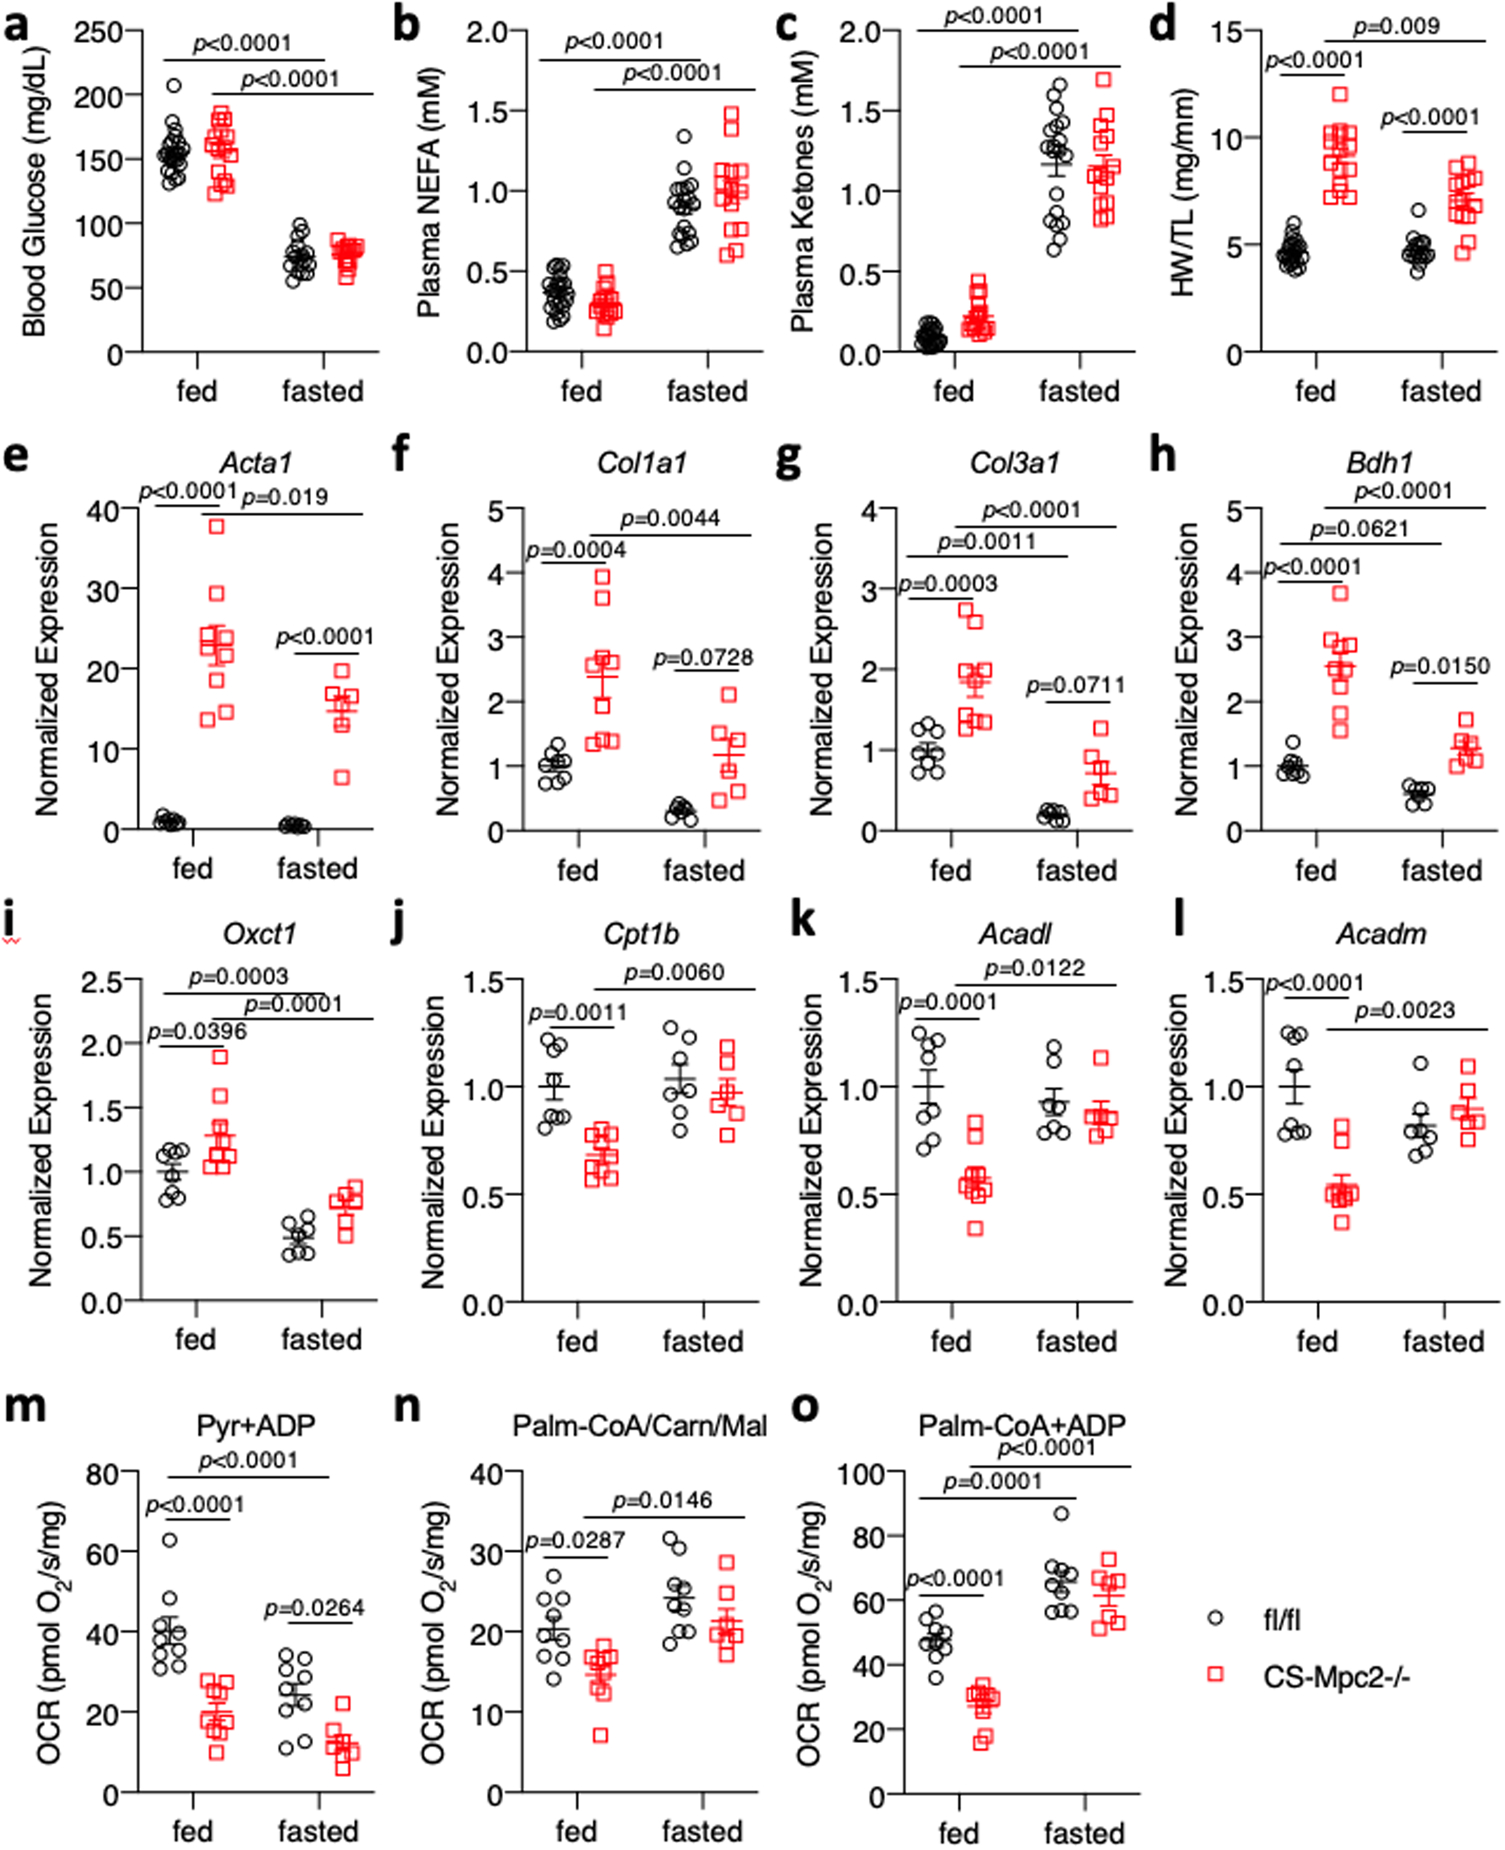
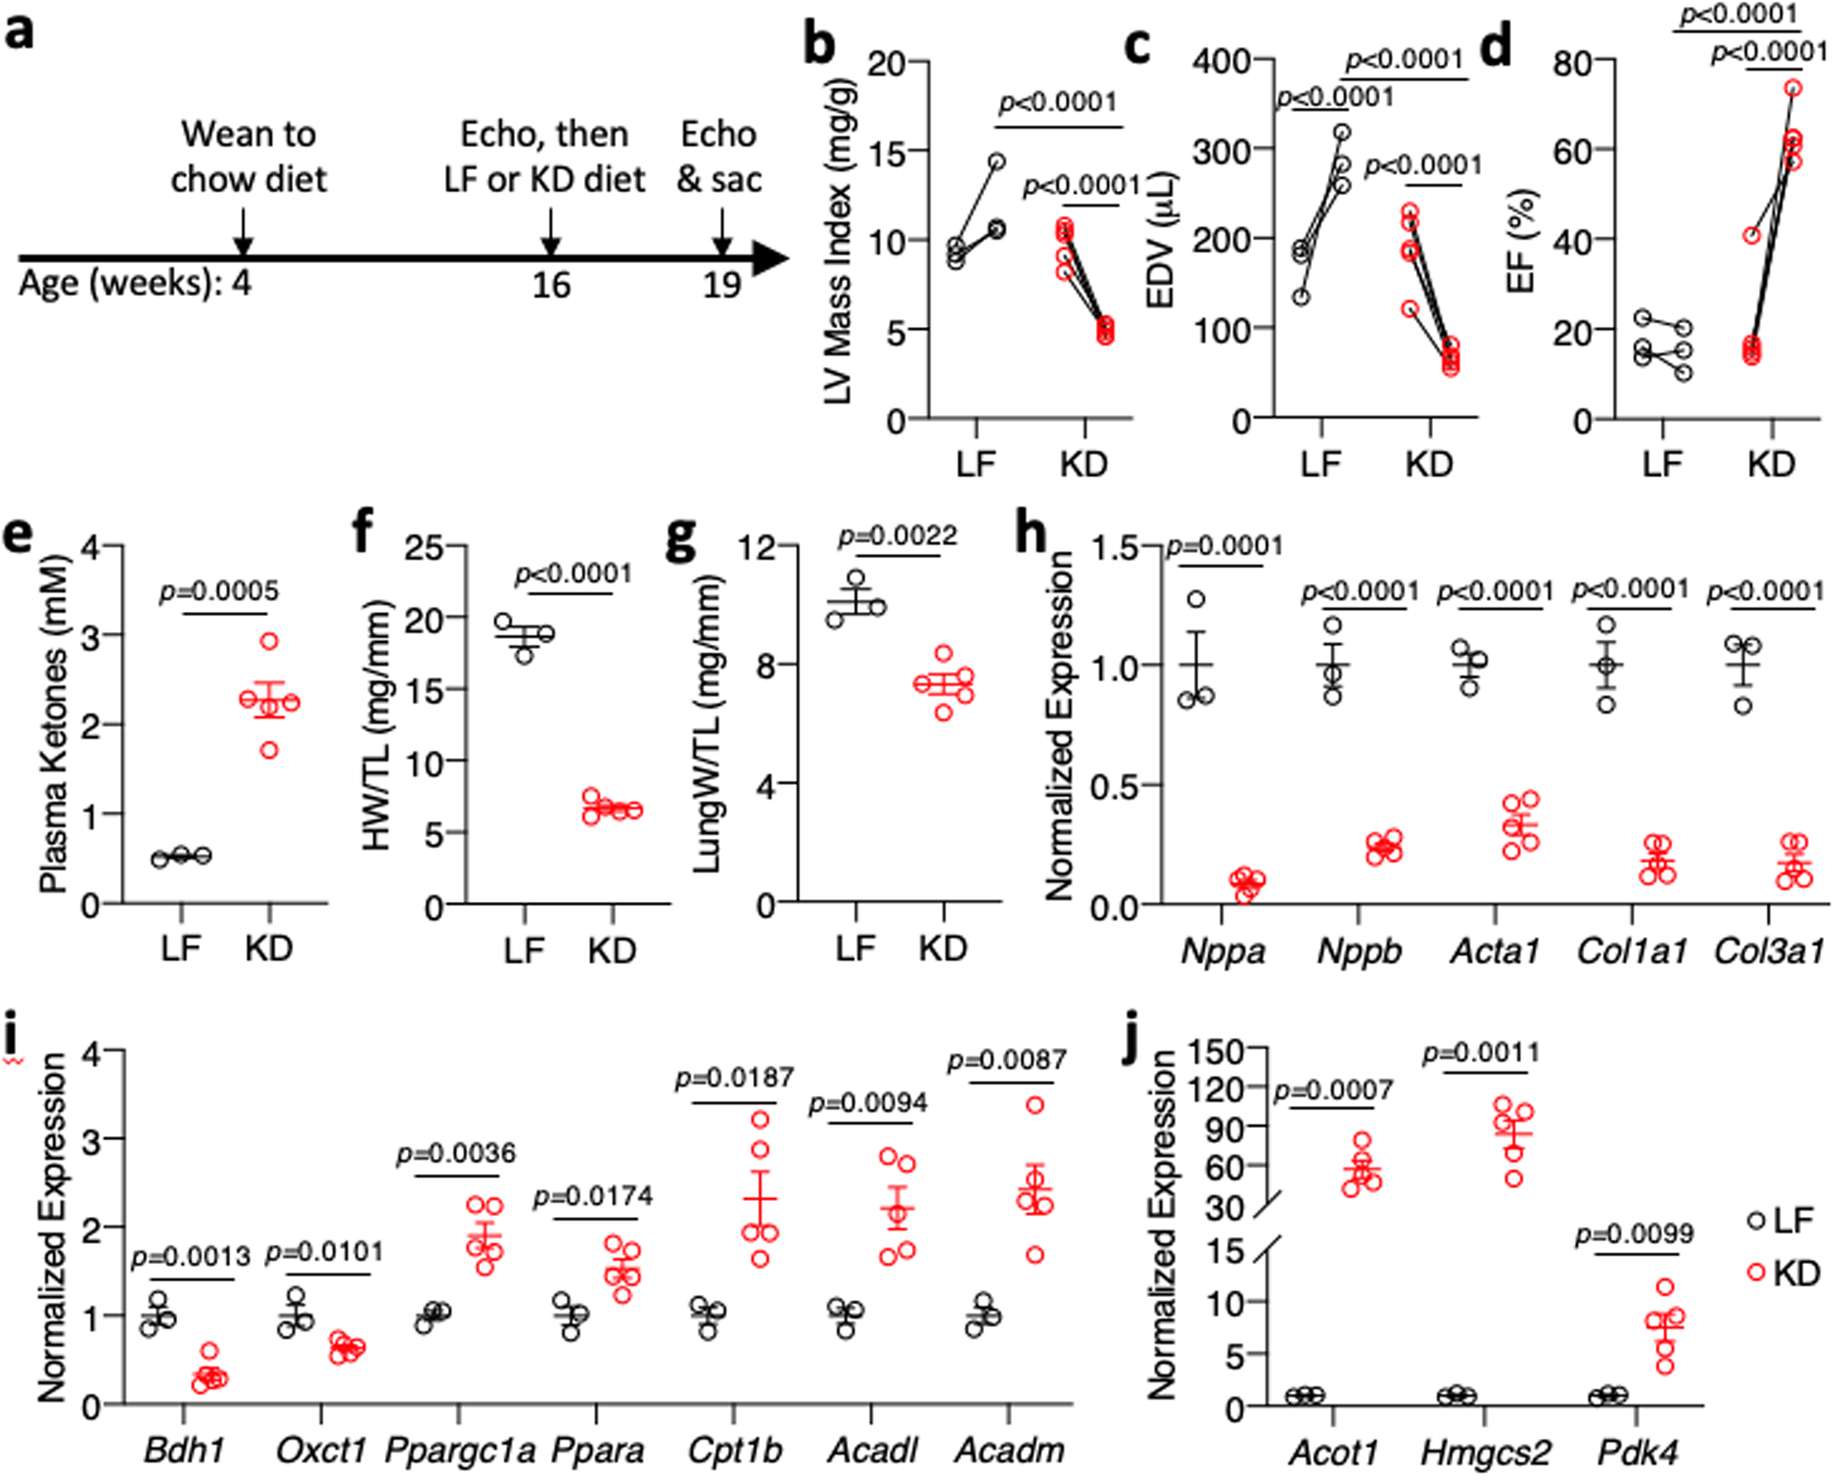
The myocardium is metabolically flexible; however, impaired flexibility is associated with cardiac dysfunction in conditions including diabetes and heart failure. The mitochondrial pyruvate carrier (MPC) complex, composed of MPC1 and MPC2, is required for pyruvate import into the mitochondria. Here we show that MPC1 and MPC2 expression is downregulated in failing human and mouse hearts. Mice with cardiac-specific deletion of Mpc2 (CS-MPC2-/-) exhibited normal cardiac size and function at 6 weeks old, but progressively developed cardiac dilation and contractile dysfunction, which was completely reversed by a high-fat, low-carbohydrate ketogenic diet. Diets with higher fat content, but enough carbohydrate to limit ketosis, also improved heart failure, while direct ketone body provisioning provided only minor improvements in cardiac remodelling in CS-MPC2-/- mice. An acute fast also improved cardiac remodelling. Together, our results reveal a critical role for mitochondrial pyruvate use in cardiac function, and highlight the potential of dietary interventions to enhance cardiac fat metabolism to prevent or reverse cardiac dysfunction and remodelling in the setting of MPC deficiency.


Conflict of interest statement

COMPETING INTERESTS

KSM previously received research support from Cirius Therapeutics, and BNF is a stockholder and scientific advisory board member of Cirius Therapeutics. RLV held patents on the synthesis and uses of ketone esters, and MTK is a co-inventor in the synthesis of ketone esters. All other authors have declared that no conflict of interest exists.

Figures

Extended Data Fig. 1:
Extended Data Fig. 1:. Human heart failure gene expression and characterization of 6-week old CS-MPC2−/− mice.
Gene expression from human non-failing, failing, and failing hearts after left ventricular assist device (LVAD) placement (n=14, 9, and 6 for Non-failing, Failing, and Post-LVAD, respectively). c-d, MPC1 and MPC2 protein expression quantification from non-failing and failing human hearts normalized to either VDAC, complex I and II, complexes III and IV, or Tubulin (n=5). e, Gene expression for Mpc1 and Mpc2 from wildtype C57BL6/J mouse hearts after sham or transverse aortic constriction plus myocardial infarction (TAC+MI) surgery (n=9 sham, 12 TAC-MI). f, Mouse heart gene expression for Mpc1 and Mpc2 (n=7, 5, 7 for fl/fl, +/−, −/− respectively). g, Blood lactate measured after a 4 h fast prior to sacrifice in 6-week old mice (n=6). h-i, Heart weight and lung weight of 6-week old mice (n=6). j, Mouse heart gene expression of heart failure, and hypertrophy genes from 6-week old mice (n= 7, 5, 7 for fl/fl, +/−, −/− respectively). Data are presented as mean ± s.e.m. within dot plot. Each data point represents one individual mouse or sample. Two-tailed unpaired Student’s t test.
Extended Data Fig. 2:
Extended Data Fig. 2:. Heart failure develops in CS-MPC2−/− mice, but not CS-MPC2+/− or mice treated with the MPC inhibitor MSDC-0602K.
a-h, Serial echocardiography data of chow-fed mice at 6, 10, and 16 weeks of age. Left ventricular internal diameter at end diastole (LVIDd) and end systole (LVIDs), end systolic volume (ESV), fractional shortening (FS), relative wall thickness (RWT), stroke volume (SV), and cardiac output (CO) (n=7, 10, and 9 for fl/fl, +/−, and −/−, respectively). i, Heart weights from WT mice fed low fat (LF) diet or a high trans-fat, fructose, cholesterol (HTF-C) diet +/− 330 ppm MSDC-0602, an insulin-sensitizing MPC inhibitor (n=7, 9, and 9 for LF, HTF-C, and HTF-C+MSDC-0602K, respectively). j, Heart gene expression of hypertrophy gene markers from WT mice fed LF, HTF-C, or HTF-C + MSDC-0602 diets (n=6 for all groups). k-l, Heart gene expression for fatty acid transport and oxidation genes and PPAR⍺ target genes from chow-fed 16-week old mice after a 4 h fast (n= 7, 5, and 7 for fl/fl, +/−, and −/−, respectively). Data are presented as mean ± s.e.m., or mean ± s.e.m. within dot plot. Each data point represents one individual mouse or sample. Two-tailed unpaired Student’s t test.
Extended Data Fig. 3:
Extended Data Fig. 3:. Ketogenic diet prevents heart failure in CS-MPC2−/− mice.
a, Body weights of mice fed low fat (LF) or ketogenic diet (KD) from 6–17 weeks of age (initial n=19, 15, 21, and 14 for fl/fl LF, CS-Mpc2−/− LF, fl/fl KD, and CS-Mpc2−/− KD, respectively)(fl/fl LF vs KD p<0.0001; CS-Mpc2−/− LF vs KD p<0.0001). b-c, Blood glucose and plasma insulin measured after a 4 h fast (n=19, 11, 20, and 14, respectively for glucose and 8, 5, 9, and 7, respectively for insulin). d-n, Echocardiography data at 10 and 16 weeks of age. Left ventricular internal diameter at end diastole (LVIDd) and end systole (LVIDs), fractional shortening (FS), relative wall thickness (RWT), end diastolic volume (EDV), end systolic volume (ESV), stroke volume (SV), ejection fraction (EF), and cardiac output (CO) (n=9, 7, 12, and 9 for fl/fl LF, CS-Mpc2−/− LF, fl/fl KD, and CS-Mpc2−/− KD, respectively). o-q, % Fat mass, % lean mass, and % free water body composition measured by echoMRI (n= 19, 12, 20, and 14, respectively). r-s, Gonadal and inguinal white adipose tissue (WAT) weights normalized to body weight (n=19, 12, 20, and 14, respectively). Data are presented as mean ± s.e.m. or mean ± s.e.m. within dot plot. Each data point in dot plot represents one individual mouse sample. Two-way ANOVA with Tukey’s multiple comparisons test. For d-n, black p values indicate LF-fed fl/fl vs. CS-Mpc2−/−, red p values indicate LF vs. KD for CS-Mpc2−/− for each echocardiography date.
Extended Data Fig. 4:
Extended Data Fig. 4:. Ketone body injection modestly reduces cardiac remodeling in CS-MPC2−/− mice.
a, Timeline for β-hydroxybutyrate (βHB) injection experiment in which CS-MPC2−/− mice were injected i.p. with saline vehicle or 10 mmol/kg βHB daily from 12 to 14 weeks of age. b-h, Echocardiography measurements before and after 2 weeks of daily i.p. injection of saline vehicle (Veh) or 10mmol/kg β-hydroxybutyrate. Left ventricular (LV) mass index, end-diastolic volume (EDV), end-systolic volume (ESV), heart rate (HR), relative wall thickness (RWT), ejection fraction (EF), and cardiac output (CO) (n=4 Veh, 5 βHB). i, Plasma total ketone body concentrations (n= 4 Veh, 5 βHB). j, Heart weight normalized to tibia length (n= 4 Veh, 5 βHB). k, Gene expression markers of hypertrophy, heart failure, and fibrosis from hearts after 2 weeks of daily vehicle or βHB treatment (n= 4 Veh, 5 βHB). Data presented either as PRE-POST, or mean ± s.e.m. shown within dot plot. Each symbol represents an individual sample. Two-tailed unpaired Student’s t test.
Extended Data Fig. 5:
Extended Data Fig. 5:. Ketone ester diet does not improve cardiac remodeling or function in CS-MPC2−/− mice.
a, Plasma ketone bodies measured from mice fed either control or ketone ester (KE)-supplemented diet (n=10, 7, 4, and 8, respectively). b-e, Echocardiography measurements after 6 weeks of KE diet feeding. Left ventricular (LV) mass index, end-diastolic volume (EDV), end-systolic volume (ESV), and ejection fraction (EF) (n= 10, 7, 4, and 8, respectively). f, Heart weight normalized to tibia length (n= 10, 7, 4, and 8, respectively). g-i, Cardiac gene expression markers of hypertrophy and heart failure (Nppa, Nppb, Acta1) (n= 10, 7, 4, and 8, respectively). Data presented as mean ± s.e.m. shown within dot plot. Each symbol represents an individual sample. Two-way ANOVA with Tukey’s multiple comparisons test.
Extended Data Fig. 6:
Extended Data Fig. 6:. High fat diets also greatly improve cardiac remodeling and function of CS-MPC2−/− mice.
a-I, Echocardiography measurements taken at 16 weeks of age after 10 weeks of low fat (LF), medium chain triglyceride (MCT), or high-fat (HF) feeding. Left ventricular internal diameter at end diastole (LVIDd) and end systole (LVIDs), fractional shortening (FS), relative wall thickness (RWT), end diastolic volume (EDV), end systolic volume (ESV), stroke volume (SV), and cardiac output (CO) (n=5, 4, 4, 8, 4, and 5, respectively). j-l, Cardiac gene expression for Ppara and it’s targets Acot1 and Hmgcs2 (n=11, 6, 10, 8, 4, and 5, respectively). Data are presented as mean ± s.e.m. within dot plot. Each data point represents an individual mouse. Two-way ANOVA with Tukey’s multiple comparisons test.
Extended Data Fig. 7:
Extended Data Fig. 7:. A 24 hour fast improves cardiac remodeling by enhancing fat oxidation.
a, Blood lactate of fed or fasted mice just prior to euthanasia (n=22, 15, 16, and 14, respectively). b, Cardiac glycogen concentrations in hearts of fed and fasted mice (n=10, 14, 15, and 14, respectively). c, Plasma TAG from fed or fasted mice (n= 22, 15, 16, and 14, respectively). d-i, Cardiac gene expression for natriuretic peptides and PPAR⍺-target and fatty acid metabolism genes (n=8, 9, 7, and 6, respectively). Data are presented as mean ± s.e.m. within dot plot. Each symbol on dot plot represents an individual sample. Two-way ANOVA with Tukey’s multiple comparisons test.
Extended Data Fig. 8:
Extended Data Fig. 8:. Ketogenic diet reverses heart failure in CS-MPC2−/− mice.
a-h, Echocardiography measurements before and after 3 weeks of LF or KD-feeding in 16-week-old CS-MPC2−/− mice with established heart failure (n=3 LF, 5 KD). Data are presented as PRE-POST. Each data point represents an individual mouse. Paired two-tailed student’s t-test for PRE vs. POST. Unpaired two-tailed student’s t-test for LF vs. KD.
Fig. 1:
Fig. 1:. MPCs downregulated in human heart failure, deletion of cardiac MPC2 results in TCA cycle dysfunction.
a-b, Gene expression measured by qRT-PCR for MPC1 and MPC2 normalized to RPLP0 from human hearts of non-failing, failing, and failing hearts Post-left ventricular assist device (LVAD) implant (n=14, 9, and 6 for Non-failing, Failing, and Post-LVAD, respectively). c, Western blot images for MPC1, MPC2, VDAC1, OX PHOS subunits, and αTubulin in non-failing and failing human heart tissue (n=5). d, Representative western blots of MPC1, MPC2, and αTubulin of mouse heart tissue and densitometry quantification (n=4). e, Oxygen consumption rates (OCR) stimulated by pyruvate/malate (P/M) of isolated cardiac mitochondria before and after addition of ADP and 5μM of the MPC-inhibitor UK-5099 (n=13, 6, and 8 for fl/fl, CS-Mpc2+/−, and CS-Mpc2−/−, respectively). f, Oxygen consumption rates stimulated by palmitoyl carnitine/malate (PC/M), glutamate/malate (G/M) or succinate (S) before or after the addition of ADP measured from isolated cardiac mitochondria (n=10, 8, and 10 for fl/fl, CS-Mpc2+/−, and CS-Mpc2−/−, respectively). g, Schematic of TCA cycle alterations measured by metabolomic analyses of heart tissue. red=increased, purple=decreased, black=unchanged (comparing fl/fl to CS-Mpc2−/−), and grey=unmeasured. h, TCA cycle intermediates (Pyruvate, Lactate, Alanine, Acetyl-CoA, Citrate, α-ketoglutarate, Succinyl-CoA, Succinate, Fumarate, Malate, Aspartate/Asparagine, and Glutamate/Glutamine) measured by mass-spectrometry from 6-week old heart tissue (n=6). Mean ± s.e.m. shown within dot plot. Each symbol represents an individual sample. Two-tailed unpaired Student’s t test.
Fig. 2:
Fig. 2:. CS-MPC2−/− mice develop dilated cardiomyopathy.
a-c, Echocardiography measures of left ventricular (LV) mass index, end-diastolic volume (EDV), and ejection fraction (EF) of mice at 6, 10, and 16-weeks of age (n=7, 10, and 9 for fl/fl, CS-Mpc2+/−, and CS-Mpc2−/−, respectively). d, Representative M-mode electrocardiogram images of 16-week old mice. e, Representative short-axis heart images stained by H&E (scale bar = 1mm). For d and e, experiments were repeated four times with small independent groups of littermate mice, with similar results obtained. f-g, Heart weight and lung weight normalized to body weight from 16-week old mice (n=7, 6, and 6 for fl/fl, CS-Mpc2+/−, and CS-Mpc2−/−, respectively). h-i, Gene expression markers of cardiac hypertrophy/failure from 16-week old mouse hearts (n=7, 5, and 7 for fl/fl, CS-Mpc2+/−, and CS-Mpc2−/−, respectively). j, Western blot images of VLCAD, LCAD, MCAD, CPT1B, BDH1, and αTubulin from whole cardiac lysates (n=3). k, Gene expression for Bdh1 and Oxct1 from 16-week old mouse hearts (n=7, 5, and 7 for fl/fl, CS-Mpc2+/−, and CS-Mpc2−/−, respectively). l, Plasma total ketone body levels from 16-week old mice (n=9, 5, and 8 for fl/fl, CS-Mpc2+/−, and CS-Mpc2−/−, respectively). Mean ± s.e.m. shown within dot plot. Each symbol represents an individual sample. Two-tailed unpaired Student’s t test.
Fig. 3:
Fig. 3:. Ketogenic diet can prevent heart failure in CS-MPC2−/− mice.
a, Plasma total ketone bodies from low fat (LF)- or ketogenic diet (KD)-fed mice (n=8, 5, 9, and 7 for fl/fl LF, CS-Mpc2−/− LF, fl/fl KD, and CS-Mpc2−/− KD, respectively). b-d, Echocardiography measures of left ventricular (LV) mass index, end-diastolic volume (EDV), and ejection fraction (EF) of LF- or KD-fed mice at 16-weeks of age (n=9, 7, 11, and 9 for fl/fl LF, CS-Mpc2−/− LF, fl/fl KD, and CS-Mpc2−/− KD, respectively). e, Survival curve of LF- or KD-fed mice (initial n=19, 15, 21, and 14 for fl/fl LF, CS-Mpc2−/− LF, fl/fl KD, and CS-Mpc2−/− KD, respectively). f, Representative short-axis H&E images and magnified trichrome stains of hearts from LF- or KD-fed 17-week old mice (black scale bar = 1mm; similar data reproduced with seven independent groups of littermate mice). g-h, Heart weight and lung weight normalized to tibia length of LF- or KD-fed 17-week old mice (n=19, 11, 20, and 14 for fl/fl LF, CS-Mpc2−/− LF, fl/fl KD, and CS-Mpc2−/− KD, respectively). i, Cardiac myocyte cross-sectional area (CSA) measured from H&E images (n=8, 5, 9, and 7 for fl/fl LF, CS-Mpc2−/− LF, fl/fl KD, and CS-Mpc2−/− KD, respectively). j-n, Gene expression markers of cardiac hypertrophy/failure and fibrosis from mouse hearts (n=7, 5, 6, and 6 for fl/fl LF, CS-Mpc2−/− LF, fl/fl KD, and CS-Mpc2−/− KD, respectively). o, Western blot images for signaling pathways associated with cardiac hypertrophic growth (PhosphoERK, Total ERK, PhosphoAMPKα, Total AMPKα, Phospho-mTOR, Total mTOR, Phospho-S6-Ribosomal Protein, Total S6-Ribosomal Protein, and β-Actin) from hearts of LF- or KD-fed mice (n=3). Mean ± s.e.m. shown within dot plot. Each symbol represents an individual sample. Two-way ANOVA with Tukey’s multiple-comparisons test.
Fig. 4:
Fig. 4:. Ketogenic diet downregulates cardiac ketone body catabolism.
a, Schematic of oxidative and non-oxidative ketone body catabolism. b-c, Gene expression for the ketolytic enzymes Bdh1 and Oxct1 from hearts of low fat (LF)- or ketogenic diet (KD)-fed fl/fl or CS-Mpc2−/− mice (n=7, 5, 6, and 6 for fl/fl LF, CS-Mpc2−/− LF, fl/fl KD, and CS-Mpc2−/− KD, respectively)(Oxct1: p=0.0058 for LF fl/fl vs CS-Mpc2−/−, p=0.0083 for fl/fl LF vs KD). d, Western blot images of BDH1 and Actin from heart tissue of LF- or KD-fed mice (n=3). e-l, Cardiac concentrations of metabolites associated with ketone body catabolism measured in hearts from LF- or KD-fed mice (n=6). m-n, Gene expression for Acaca and Acacb normalized to Rplp0 from hearts of LF- and KD-fed mice (n=7, 5, 6, and 6 for fl/fl LF, CS-Mpc2−/− LF, fl/fl KD, and CS-Mpc2−/− KD, respectively). Mean ± s.e.m. shown within dot plot. Each symbol represents an individual sample. Two-way ANOVA with Tukey’s multiple-comparisons test. *P < 0.05, **P < 0.01, ***P < 0.001.
Fig. 5:
Fig. 5:. Ketogenic diet enhances cardiac fatty acid metabolism.
a, Heatmap of acylcarnitine species measured in hearts of low fat (LF)- or ketogenic diet (KD)-fed fl/fl or CS-Mpc2−/− mice (n=6). b-d, Concentrations of free carnitine, total acylcarnitines, and the acylcarnitine/free carnitine ratio measured by mass-spectrometry of heart tissue (n=6). e-l, Gene expression markers of PPARα and fatty acid oxidation (Ppara, Ppargc1a, Pdk4, Acox1, Acot1, Acsl1, Cpt1b, and Hmgcs2) from heart tissue of LF- or KD-fed mice (n=7, 5, 6, and 6 for fl/fl LF, CS-Mpc2−/− LF, fl/fl KD, and CS-Mpc2−/− KD, respectively). Mean ± s.e.m. shown within dot plot. Each symbol represents an individual sample. Two-way ANOVA with Tukey’s multiple-comparisons test.
Fig. 6:
Fig. 6:. High fat diets also prevent cardiac remodeling and dysfunction in CS-MPC2−/− mice.
a, Comparison of diet macronutrient composition for low fat (LF), medium chain triglyceride (MCT), high fat (HF), and ketogenic diet (KD). b, Plasma total ketone body concentrations measured from mice after LF, MCT, or HF diet feeding (n=11, 4, 10, 8, 4, and 5 for fl/fl LF, CS-Mpc2−/− LF, fl/fl MCT, CS-Mpc2−/− MCT, fl/fl HF, and CS-Mpc2−/− HF, respectively). c-d, Echocardiography measures of left ventricular (LV) mass index and ejection fraction (EF) of mice fed LF, MCT, or HF diets (n=5, 4, 4, 8, 4, and 5 for fl/fl LF, CS-Mpc2−/− LF, fl/fl MCT, CS-Mpc2−/− MCT, fl/fl HF, and CS-Mpc2−/− HF, respectively). e-f, Heart weight and lung weight normalized to tibia length (n=11, 6, 10, 8, 4, and 5 for fl/fl LF, CS-Mpc2−/− LF, fl/fl MCT, CS-Mpc2−/− MCT, fl/fl HF, and CS-Mpc2−/− HF, respectively). g, Representative short-axis heart images stained with H&E (scale bar = 1mm; similar results obtained during four independent experiments of littermate mice). h-n, Gene expression markers of hypertrophy, heart failure, fibrosis, and the ketolytic enzyme Bdh1 from mouse hearts (n=11, 6, 10, 8, 4, and 5 for fl/fl LF, CS-Mpc2−/− LF, fl/fl MCT, CS-Mpc2−/− MCT, fl/fl HF, and CS-Mpc2−/− HF, respectively). Mean ± s.e.m. shown within dot plot. Each symbol represents an individual sample. Two-way ANOVA with Tukey’s multiple-comparisons test. Exact p values given unless ***P < 0.0001.
Fig. 7:
Fig. 7:. Improved cardiac remodeling during fasting is associated with enhanced fat oxidation.
a-c, Blood glucose, plasma non-esterified fatty acid (NEFA), and plasma total ketone body concentrations from fed or 24 h-fasted mice (n=22, 15, 16, and 14 for fl/fl fed, CS-Mpc2−/− fed, fl/fl fasted, and CS-Mpc2−/− fasted, respectively). d, Heart weight normalized to tibia length after feeding or fasting (n=22, 15, 16, and 14 for fl/fl fed, CS-Mpc2−/− fed, fl/fl fasted, and CS-Mpc2−/− fasted, respectively). e-l, Cardiac gene expression markers of heart failure, fibrosis, or ketone and fatty acid metabolizing enzymes (n=8, 9, 7, and 6 for fl/fl fed, CS-Mpc2−/− fed, fl/fl fasted, and CS-Mpc2−/− fasted, respectively). m-o, Oxygen consumption rates (OCR) measured from permeabilized cardiac muscle fibers using pyruvate (Pyr) or palmitoyl-CoA with carnitine and malate (Palm-CoA/Carn/Mal) as substrates (n=9, 9, 9, and 7 for fl/fl fed, CS-Mpc2−/− fed, fl/fl fasted, and CS-Mpc2−/− fasted, respectively). Data are presented as mean ± s.e.m. within dot plot. Each symbol in dot plot represents an individual sample. Two-way ANOVA with Tukey’s multiple-comparisons test.
Fig. 8:
Fig. 8:. Ketogenic diet can reverse heart failure in CS-Mpc2−/− mice.
a, Timeline for heart failure reversal experiment, in which CS-MPC2−/− mice were switched to low fat (LF) or ketogenic diet (KD) at 16 weeks of age for 3 weeks. b-d, Echocardiography measures of left ventricular (LV) mass index, end-diastolic volume (EDV), and ejection fraction (EF) of CS-MPC2−/− mice PRE and POST LF or KD feeding (n=3 LF, 5 KD; data presented as PRE-POST with first data point at 16-weeks old and second data point at 19-weeks old after 3 weeks of LF or KD). e, Plasma total ketone values from CS-MPC2−/− mice fed LF or KD (n=3 LF, 5 KD). f-g, Heart weight and lung weight normalized to tibia length (n=3 LF, 5 KD). h-j, Cardiac gene expression of hypertrophy, heart failure, fibrosis, and ketone body and fatty acid metabolizing genes (n=3 LF, 5 KD). Data presented either as PRE-POST, or mean ± s.e.m. shown within dot plot. Each symbol represents an individual sample. Two-tailed paired Student’s t test to compare PRE vs. POST, two-tailed unpaired Student’s t test to compare LF vs. KD.

References

    1. Bing RJ, Siegel A, Ungar I & Gilbert M Metabolism of the human heart. II. Studies on fat, ketone and amino acid metabolism. Am J Med 16, 504–515, doi:10.1016/0002-9343(54)90365-4 (1954). - DOI - PubMed
    1. Wisneski JA, Gertz EW, Neese RA & Mayr M Myocardial metabolism of free fatty acids. Studies with 14C-labeled substrates in humans. J Clin Invest 79, 359–366, doi:10.1172/JCI112820 (1987). - DOI - PMC - PubMed
    1. Lopaschuk GD & Spafford MA Energy substrate utilization by isolated working hearts from newborn rabbits. Am J Physiol 258, H1274–1280, doi:10.1152/ajpheart.1990.258.5.H1274 (1990). - DOI - PubMed
    1. Glatz JF & Veerkamp JH Postnatal development of palmitate oxidation and mitochondrial enzyme activities in rat cardiac and skeletal muscle. Biochim Biophys Acta 711, 327–335, doi:10.1016/0005-2760(82)90042-x (1982). - DOI - PubMed
    1. Lopaschuk GD, Spafford MA & Marsh DR Glycolysis is predominant source of myocardial ATP production immediately after birth. Am J Physiol 261, H1698–1705, doi:10.1152/ajpheart.1991.261.6.H1698 (1991). - DOI - PubMed

Publication types

MeSH terms

Substances