[Preprint]. 2021 Jan 4:2020.10.20.347187.
doi: 10.1101/2020.10.20.347187.

Chronic lung diseases are associated with gene expression programs favoring SARS-CoV-2 entry and severity

Collaborators, Affiliations

Chronic lung diseases are associated with gene expression programs favoring SARS-CoV-2 entry and severity

Linh T Bui et al. bioRxiv. .

Update in

Abstract

Patients with chronic lung disease (CLD) have an increased risk for severe coronavirus disease-19 (COVID-19) and poor outcomes. Here, we analyzed the transcriptomes of 605,904 single cells isolated from healthy and CLD lungs to identify molecular characteristics of lung cells that may account for worse COVID-19 outcomes in patients with chronic lung diseases. We observed a similar cellular distribution and relative expression of SARS-CoV-2 entry factors in control and CLD lungs. CLD epithelial cells expressed higher levels of genes linked directly to the efficiency of viral replication and innate immune response. Additionally, we identified basal differences in inflammatory gene expression programs that highlight how CLD alters the inflammatory microenvironment encountered upon viral exposure to the peripheral lung. Our study indicates that CLD is accompanied by changes in cell-type-specific gene expression programs that prime the lung epithelium for and influence the innate and adaptive immune responses to SARS-CoV-2 infection.

Keywords: COPD; COVID-19; genomics; pulmonary fibrosis; scRNA-seq.


Conflict of interest statement

Competing interests JAK has received advisory board fees from Boehringer Ingelheim, Inc, Janssen Pharmaceuticals, is on the scientific advisory board of APIE Therapeutics, and has research contracts with Genentech. In the last 36 months, NK reported personal fees from Biogen Idec, Boehringer Ingelheim, Third Rock, Samumed, Numedii, AstraZeneca, Life Max, Teravance, RohBar, and Pliant and Equity in Pliant; collaboration with MiRagen, AstraZeneca; Grant from Veracyte, all outside the submitted work. In addition, NK has a patent for New Therapies in Pulmonary Fibrosis, and Peripheral Blood Gene Expression licensed to Biotech. AGN has received advisory board fees from Boehringer Ingelheim, Galapagos, Medical Quantitative Image Analysis and personal fees for educational material from Up to Date and Boehringer Ingelheim. RGJ reports grants from AstraZeneca, grants from Biogen, personal fees from Boehringer Ingelheim, personal fees from Chiesi, personal fees Daewoong, personal fees from Galapagos, grants from Galecto, grants from GlaxoSmithKline, personal fees from Heptares, non-financial support from NuMedii, grants and personal fees from Pliant, personal fees from Promedior, non-financial support from Redx, personal fees from Roche, other from Action for Pulmonary Fibrosis, outside the submitted work.

Figures
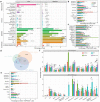
Fig. 1:
Fig. 1:
Percentage of cells expressing SARS-CoV-2 receptor genes in lung cell types in different diagnosis subgroups. (a) Percentage of cells expressing ACE2 and TMPRSS2 in all cell types. Total number of ACE2+ or TMPRSS2+ cells in the dataset (Percentage of ACE2+ or TMPRSS2+ cells). (b-c) Percentage of cells expressing ACE2 and TMPRSS2 in each diagnosis group, only cell types with at least 0.5% of cells expressing ACE2 (b) and at least 10% of cells expressing TMPRSS2 (c) are represented. (d) Venn diagram shows overlapping of cells co-expressing the proposed receptors (ACE2, BSG and NRP1) and the protease TMPRSS2. (e-f) Percentage of cells co-expressing receptors and TMPRSS2 split by cell type and diagnosis group. Significant differences between diagnosis groups were calculated using Tukey_HSD test, p-value < 0.05: *, p-value < 0.01: **, p-value < 0.001: ***, p-value < 0.0001: ****.
Fig. 2:
Fig. 2:
Expression profile of SARS-CoV-2 mediators and response genes in the epithelial cell population. (a) Binary heatmap with log2FC converted into a 1 (genes upregulated in the Disease samples) and 0 (genes downregulated in the Disease samples) shows the majority of the SARS-CoV-2 response genes are upregulated in the Disease samples compared to Control, the upregulation pattern in the disease samples were tested with an Exact binomial test, p-value = 9.909e-07. Up-regulation: genes up-regulated in Disease samples, Down-regulation: genes down-regulated in Disease samples, Not detected: gene expression was not detected in either of the two tested populations (Disease vs. Control). (b) SARS-CoV-2 entry module score in different cell types, SARS-CoV-2 mediators included ACE2, BSG (CD147), NPR1, HSPA5 (GRP78), TMPRSS2, CTSL, ADAM17, FURIN. The outliers were removed in this plot, please see Supplementary Fig. 6a with outliers included. *: p-value < 0.05, **: p-value < 0.01, ***: p-value < 0.001, ****: p-value < 0.0001, Tukey_HSD post-hoc test. (c) Significant gene expression correlation in AT2 cells between ADAM17 and ACE2, BSG (CD147) and NPR1 in COPD and IPF samples. (d) Boxplot shows differences in gene expression of selected Covid-19 response genes in the AT2 cell types, **: p_value_adj < 0.05 (negative binomial test, corrected for Age, Ethnicity, Smoking_status and Dataset). (e) Spearman gene correlation analysis identified genes correlated with ACE2 expression in AT2 ACE2+ cells in different diagnosis groups, p_value was adjusted using Benjamini-Hochberg corrections and dashed lines indicate the 99th percentile of Spearman rho values.
Fig. 3:
Fig. 3:
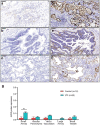
ACE2 and ITGB6 protein expression in IPF lung sections. (a-c) IPF lung sections stained for ACE2: (a) small airway, (b) large airway and (c) lung parenchyma. (d-f) IPF lung sections stained for αvβ6 : (d) small airway, (e) large airway and (f) lung parenchyma. (g) semi-quantitative evaluation of ACE2 scoring among control and IPF sections (both the percentage of staining and staining intensity of ACE2 expression;0-Negative; 1–0– 10%; 2–11– 25%; 3– 26%). Significant differences between IPF and control were calculated using Tukey HSD test, p-value < 0.05 *. Scale bar = 100μm.
Fig. 4:
Fig. 4:
Analysis of SARS-CoV-2 candidate immune response genes in immune cells. (a) quantification of cell types as a percent of all immune cells in control versus diseased lungs. (b) Binary heatmap shows the majority of the SARS-CoV-2 response genes are upregulated in the Disease samples compared to Control; p-value = 8.298e-08 (Exact binomial test); Up-regulation: genes being up-regulated in Disease samples, Down-regulation: genes being down-regulated in Disease samples, Not detected: gene expression was not detected in either of the two tested populations (Disease vs. Control). (c) Differential expression analysis for SARS-CoV-2 immune candidate genes in cDCs, Macrophages and Monocytes. *: p_adjusted_value < 0.1, **: p_adjusted_value < 0.05, p_adjusted_value was Bonferroni adjusted from Seurat FindMarkers differential expression analysis using a negative binomial test and corrected for Age, Ethnicity, Smoking_status and Dataset. (d) Compared to the healthy control samples, HLA type II score is higher in all disease groups (especially Other-ILD). (e-f) In the T cell population, cytotoxicity scores (e) and exhaustion scores (f) are higher in the disease samples than in control samples. (a), (d), (e) and (f): Boxes: interquartile range, *: p-value < 0.05, **: p-value < 0.01, ***: p-value < 0.001, ****: p-value < 0.0001, Tukey_HSD post-hoc test. See Supplementary Fig. 10 for plots with outliers included for (d), (e), (f).

References

    1. Huang C. et al. Clinical features of patients infected with 2019 novel coronavirus in Wuhan, China. Lancet 395, 497–506 (2020). - PMC - PubMed
    1. Zhu N. et al. A Novel Coronavirus from Patients with Pneumonia in China, 2019. N. Engl. J. Med. 382, 727–733 (2020). - PMC - PubMed
    1. Wang C., Horby P. W., Hayden F. G. & Gao G. F. A novel coronavirus outbreak of global health concern. The Lancet vol. 395 470–473 (2020). - PMC - PubMed
    1. Zhou P. et al. A pneumonia outbreak associated with a new coronavirus of probable bat origin. Nature 579, 270–273 (2020). - PMC - PubMed
    1. Marini J. J. & Gattinoni L. Management of COVID-19 Respiratory Distress. JAMA (2020) doi:10.1001/jama.2020.6825. - DOI - PubMed

Publication types