Comparative Study
. 2021 Feb;95(2):573-589.
doi: 10.1007/s00204-020-02937-6. Epub 2020 Oct 27.

Comparing in vitro human liver models to in vivo human liver using RNA-Seq

Affiliations
Comparative Study

Comparing in vitro human liver models to in vivo human liver using RNA-Seq

Rajinder Gupta et al. Arch Toxicol. 2021 Feb.

Abstract

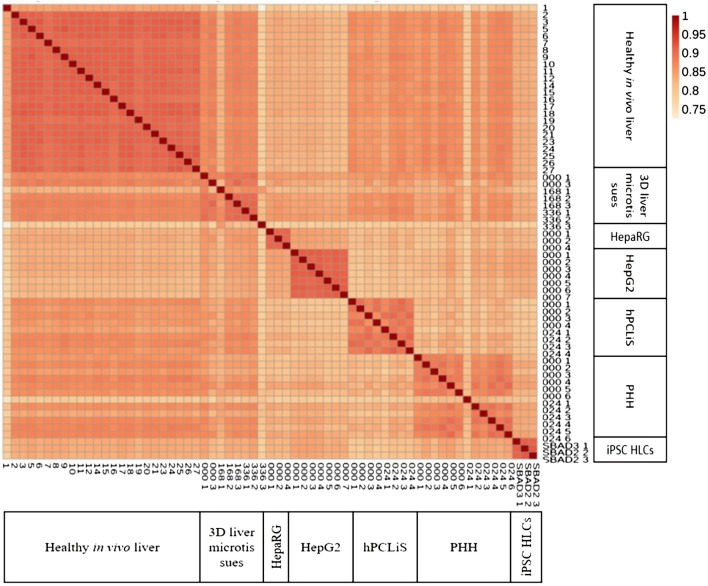
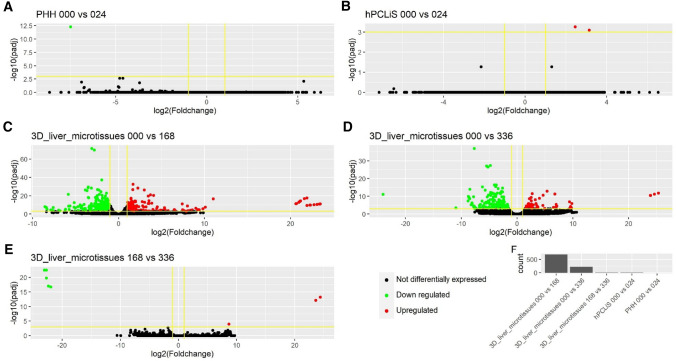
The liver plays an important role in xenobiotic metabolism and represents a primary target for toxic substances. Many different in vitro cell models have been developed in the past decades. In this study, we used RNA-sequencing (RNA-Seq) to analyze the following human in vitro liver cell models in comparison to human liver tissue: cancer-derived cell lines (HepG2, HepaRG 3D), induced pluripotent stem cell-derived hepatocyte-like cells (iPSC-HLCs), cancerous human liver-derived assays (hPCLiS, human precision cut liver slices), non-cancerous human liver-derived assays (PHH, primary human hepatocytes) and 3D liver microtissues. First, using CellNet, we analyzed whether these liver in vitro cell models were indeed classified as liver, based on their baseline expression profile and gene regulatory networks (GRN). More comprehensive analyses using non-differentially expressed genes (non-DEGs) and differential transcript usage (DTU) were applied to assess the coverage for important liver pathways. Through different analyses, we noticed that 3D liver microtissues exhibited a high similarity with in vivo liver, in terms of CellNet (C/T score: 0.98), non-DEGs (10,363) and pathway coverage (highest for 19 out of 20 liver specific pathways shown) at the beginning of the incubation period (0 h) followed by a decrease during long-term incubation for 168 and 336 h. PHH also showed a high degree of similarity with human liver tissue and allowed stable conditions for a short-term cultivation period of 24 h. Using the same metrics, HepG2 cells illustrated the lowest similarity (C/T: 0.51, non-DEGs: 5623, and pathways coverage: least for 7 out of 20) with human liver tissue. The HepG2 are widely used in hepatotoxicity studies, however, due to their lower similarity, they should be used with caution. HepaRG models, iPSC-HLCs, and hPCLiS ranged clearly behind microtissues and PHH but showed higher similarity to human liver tissue than HepG2 cells. In conclusion, this study offers a resource of RNA-Seq data of several biological replicates of human liver cell models in vitro compared to human liver tissue.

Keywords: CellNet; In vitro liver; In vivo liver; Non-DEGs; Non-DEGsDTU−; Pathway coverage; RNA-seq.


Conflict of interest statement

The authors declare that they have no conflict of interest.

Figures

Fig. 1
Fig. 1
Spearman’s correlation plot. The Spearman’s correlation plot for normalized read counts of all in vivo and in vitro samples taken after first sample filtration. For healthy in vivo liver, the replicate numbers are given. For all in vitro cell models, cultivation periods (000/024/168/336 h) and replicate numbers are indicated except iPSC-HLC. In the case of iPSC-HLC, the donor id (SABD2/3) and replicate number are given. The color bar indicates the Spearman correlation coefficient of each pairwise correlation
Fig. 2
Fig. 2
CellNet C/T classification score. The classification score for in vivo and in vitro samples compared to the liver, embryonic stem cell (ESC), and fibroblast data of CellNet, represented as a heat map. For healthy in vivo liver, the replicate numbers are indicated. For all in vitro cell models, time points (000/024/168/336 h) and replicate numbers are given except iPSC-HLC. In the case of iPSC-HLC, the samples are labeled as donor id (SABD2/3) and replicate number. The color bar represents the classification score as calculated by CellNet
Fig. 3
Fig. 3
Number of DEGs from combination of replicates during bootstrapping. There were variable number of replicates for the cell models. This may result in incomparable statistical analyses of the cell models. Therefore, to address this concern, a bootstrap strategy was applied to select the replicates that had the least number of DEGs when compared to in vivo liver. Different colors of the bar graph represent various combinations of the replicates
Fig. 4
Fig. 4
Overlap and number of non-DEGs. The number of non-DEGs for all cell models obtained after comparing against in vivo samples shown as horizontal bar plots on the left. The overlap between all cell models is shown as the main graph, top 50 overlaps are shown. For each cell model, the best three replicates were chosen as explained in the Bootstrapping section under Materials and methods. Different colors are used to enhance the readability of the graph
Fig. 5
Fig. 5
Pathway coverage of liver pathways by different cell models for the non-DEGs. The non-DEGs from all in vitro cell models were mapped onto important pathways in the liver for cell processes, regrowth and regeneration, cancer, viral infection, immune response, drug and xenobiotics metabolism, repair, and toxicity
Fig. 6
Fig. 6
Volcano plots for DEGs. aj The DEGs from various cell models when compared with healthy in vivo liver. The black dots represent not differentially expressed, green dots down regulated and red dots up-regulated genes. The x-axis is the log2foldchange of the gene expression between the healthy and in vitro cell models and y-axis is the p-adjusted (padj or q value). The horizontal yellow line corresponds to –log10 (0.05) where 0.05 is the threshold for padj and the vertical lines correspond to log2 foldchange <  − 1 and > 1. (K) Number of DEGs from each comparison
Fig. 7
Fig. 7
Overlap between the GO function for the DEGs. An enrichment analyses for the DEGs from all in vitro cell models was performed and the overlap for the resulting GO functions is presented. Different colors are used to enhance the readability of the graph
Fig. 8
Fig. 8
Pathway coverage of liver pathways by different cell models for the DEGs. The DEGs from all in vitro cell models were mapped onto important pathways in the liver for cell processes, regrowth and regeneration, cancer, viral infection, immune response, drug and xenobiotics metabolism, repair, and toxicity
Fig. 9
Fig. 9
Volcano plots for differentially expressed genes (DEGs) from comparison of incubation periods for the cell models. RNA-Seq data was available for different time points for PHH (0 and 24 h), hPCLiS (0 and 24 h), and 3D liver microtissues (0, 168, and 336 h). DEGs were computed between different incubation times for each cell model. ae Volcano plots for the DEGs computed for different comparisons. The black dots represent not differentially expressed, green dots down regulated and red dots up-regulated genes. The x-axis is the log2 foldchange of the gene expression between the healthy and in vitro cell models and y-axis is the p-adjusted (padj or q value). The horizontal yellow line corresponds to –log10 (0.05) where 0.05 is the threshold for padj and the vertical lines correspond to log2 foldchange <  − 1 and > 1. f Number of DEGs from each comparison
Fig. 10
Fig. 10
Examples of four non-DEGs that show major differential transcript usage (DTU). Transcript usage illustrated for four genes that were not differentially expressed at the gene level (non-DEGs) but had differential transcript usage (DTU). The most expressed protein coding transcript in vivo is replaced by other protein coding and/or non-coding transcripts a POLR2F, b HSPA8, c GOLGA8B, and d ARHGAP21

References

    1. Aken BL, Ayling S, Barrell D, et al. The Ensembl gene annotation system. Database. 2016 doi: 10.1093/database/baw093. - DOI - PMC - PubMed
    1. Albrecht W, Kappenberg F, Brecklinghaus T, et al. Prediction of human drug-induced liver injury (DILI) in relation to oral doses and blood concentrations. Arch Toxicol. 2019;93(6):1609–1637. doi: 10.1007/s00204-019-02492-9. - DOI - PubMed
    1. Bae H, Monti S, Montano M, Steinberg MH, Perls TT, Sebastiani P. Learning bayesian networks from correlated data. Sci Rep-Uk. 2016 doi: 10.1038/Srep25156. - DOI - PMC - PubMed
    1. Bahin M, Noël BF, Murigneux V, et al. ALFA: annotation landscape for aligned reads. BMC Genom. 2019;20(1):250. doi: 10.1186/s12864-019-5624-2. - DOI - PMC - PubMed
    1. Bolger AM, Lohse M, Usadel B. Trimmomatic: a flexible trimmer for Illumina sequence data. Bioinformatics. 2014;30(15):2114–2120. doi: 10.1093/bioinformatics/btu170. - DOI - PMC - PubMed

Publication types