. 2021 Jan;595(1):14-25.
doi: 10.1002/1873-3468.13969. Epub 2020 Nov 18.

Phosphorylation of NANOG by casein kinase I regulates embryonic stem cell self-renewal

Affiliations

Phosphorylation of NANOG by casein kinase I regulates embryonic stem cell self-renewal

Nicholas P Mullin et al. FEBS Lett. 2021 Jan.

Abstract

The self-renewal efficiency of mouse embryonic stem cells (ESCs) is determined by the concentration of the transcription factor NANOG. While NANOG binds thousands of sites in chromatin, the regulatory systems that control DNA binding are poorly characterised. Here, we show that NANOG is phosphorylated by casein kinase I, and identify target residues. Phosphomimetic substitutions at phosphorylation sites within the homeodomain (S130 and S131) have site-specific functional effects. Phosphomimetic substitution of S130 abolishes DNA binding by NANOG and eliminates LIF-independent self-renewal. In contrast, phosphomimetic substitution of S131 enhances LIF-independent self-renewal, without influencing DNA binding. Modelling the DNA-homeodomain complex explains the disparate effects of these phosphomimetic substitutions. These results indicate how phosphorylation may influence NANOG homeodomain interactions that underpin ESC self-renewal.

Keywords: DNA binding; NANOG; casein kinase I; phosphorylation; self-renewal.


Figures

Fig. 1
Fig. 1
NANOG is phosphorylated by casein kinase I. (A) Immunoblot of recombinant NANOG incubated with CKI and ATP in 0, 1, 10 or 50 µmtriamterene or D4476. (B) Domain diagram of NANOG with phosphorylation sites identified by mass spectrometry marked as stars. ND – N‐terminal domain, HD – homeodomain, CD1 – C‐terminal domain 1, WR – tryptophan repeat, CD2 – C‐terminal domain 2. Sequences of phosphorylated NANOG peptides are shown with potential phosphorylation sites highlighted. For all peptides, NANOG residue numbering is shown above the sequence. For the homeodomain‐derived peptide, the canonical homeodomain numbering is shown below the sequence.
Fig. 2
Fig. 2
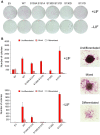
Self‐renewal assays of E14/T cells transfected with NANOG variants. (A) E14/T ESCs were transfected with pPyCAGIP plasmids encoding the indicated NANOG mutants and cultured in media containing puromycin in the presence or absence of LIF (EV, empty vector; WT, wild‐type NANOG). After 12 days, plates were stained for alkaline phosphatase activity. Assays were performed in triplicate. (B) Left, Quantitative assessment of colony morphologies from (A) determined in the presence or absence of LIF. Data shown are from a single experiment (data and error bars are the means and standard deviations, respectively, from three technical replicates) and are representative of three independent biological replicates. Biological replicates are shown in Fig.S1. Right, examples of colony morphologies containing undifferentiated ES cells, differentiated cells or a mix of both.
Fig. 3
Fig. 3
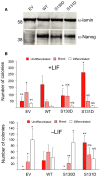
Self‐renewal assays ofNANOGnull ESCs rescued with NANOG variants. (A)NANOG −/−ESCs (44cre6) were electroporated with linearised pPyCAGIP plasmids encoding the indicated NANOG mutants and selected in puromycin LIF (EV, empty vector; WT, wild‐type NANOG). After expansion, cell extracts were assayed for expression level by immunoblotting. (B) Quantitative assessment of colony morphologies of stably expressing lines from (A) plated at clonal density in the presence or absence of LIF and stained for alkaline phosphatase activity after 6 days. Data and error bars are the means and standard deviations, respectively, of three independent experiments. Significance of variation from WT *P < 0.1, **P < 0.05 and n/s – not significant (Student’st‐test).
Fig. 4
Fig. 4
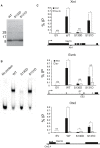
DNA binding by NANOG mutants. (A) SDS/PAGE of purified homeodomains expressed inE. coli.(B) EMSAs with recombinant homeodomains performed using a probe corresponding to the NANOG‐binding site within theTcf3locus [36]. (C) ChIP‐PCR of NANOG at known binding sites. ChIP was performed with NANOG antibody using the stable populations described in Fig. 3. Three known NANOG‐binding sites withinXist,EsrrbandOtx2were assessed; regions within the same genes which do not bind NANOG provided negative controls. The positive binding regions (Xin1, EE2 and Otx2 A) are diagrammed below each gene and negative control regions (Xex1b, E7 and Otx2 B) above each gene. Data are mean of three replicates. Error bars are standard deviation. *P < 0.05, n/s – not significant.
Fig. 5
Fig. 5
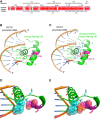
Model of mouse NANOG homeodomain in complex with DNA. (A) Alignment of the homeodomain (HD) sequences of mouse (amino acids 94–155) and human NANOG (93–155). White letters on red background indicate conserved amino acids; red letters on white background indicate similar amino acids. Two potential phosphorylation sites, S130 and S131, are highlighted with stars. Secondary structure elements of the mouse NANOG HD crystal structure (PDBID:2VI6) and the human NANOG HD cocrystal structure with DNA (PDBID:4RBO) are shown above and below the alignment, respectively. (B) Structural model of mouse NANOG HD bound toOCT4promoter DNA, based on the human NANOG HD:DNA cocrystal structure. Four amino acids in α‐helix 3 that contact DNA (Y137, K138, N146, R148) are shown as sticks, along with S130 and S131 (purple). (C) Structural model of mouse NANOG HD, phosphorylated at S130 (S130‐P) and S131 (S131‐P), bound toOCT4promoter DNA. Phosphorylation of S130 introduces steric clashes with the amino acid residues shown in blue (L135, S136, Y137, V140) sticks. (D, E) Expanded view of region around S130. Atoms of Y137 and Ser130/ pSer130 are shown as spheres representing van der Waal radii. Residues in blue as per C.

References

    1. Whitmarsh AJ and Davis RJ (2000) Regulation of transcription factor function by phosphorylation. Cell Mol Life Sci 57, 1172–1183. - PMC - PubMed
    1. Ozcan S, Andrali SS and Cantrell JE (2010) Modulation of transcription factor function by O‐GlcNAc modification. Biochim Biophys Acta 1799, 353–364. - PMC - PubMed
    1. Das C and Kundu TK (2005) Transcriptional regulation by the acetylation of nonhistone proteins in humans – a new target for therapeutics. IUBMB Life 57, 137–149. - PubMed
    1. Hammond‐Martel I, Yu H and el Affar B (2012) Roles of ubiquitin signaling in transcription regulation. Cell Signal 24, 410–421. - PubMed
    1. Levy DE and Darnell JE Jr (2002) Stats: transcriptional control and biological impact. Nat Rev Mol Cell Biol 3, 651–662. - PubMed

Publication types