A Physiologically Based Pharmacokinetic Model to Predict Potential Drug-Drug Interactions and Inform Dosing of Acumapimod, an Oral p38 MAPK Inhibitor
- PMID: 33107218
- PMCID: PMC7825188
- DOI: 10.1002/psp4.12565
A Physiologically Based Pharmacokinetic Model to Predict Potential Drug-Drug Interactions and Inform Dosing of Acumapimod, an Oral p38 MAPK Inhibitor
Abstract
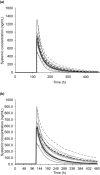
Acumapimod, an investigational oral p38 mitogen-activated protein kinase inhibitor for treatment during severe acute exacerbations of chronic obstructive pulmonary disease, is metabolized primarily by cytochrome P450 3A4 (CYP3A4) and is a P-glycoprotein (P-gp) substrate. Concerns about drug-drug interactions (DDIs) have meant patients receiving drugs that inhibit CYP3A4 were ineligible for acumapimod trials. We report on how 2 acumapimod clinical DDI studies and a physiologically-based pharmacokinetic (PBPK) model assessing how co-administration of a weak (azithromycin) and strong (itraconazole) CYP3A4 inhibitor affected acumapimod systemic exposure, informed decision making and supported concomitant use of CYP3A4 and P-gp inhibitors. Studies MBCT102 and MBCT103, respectively, demonstrated that co-administration of azithromycin or itraconazole had no clinically meaningful impact on acumapimod pharmacokinetics. Findings were consistent with PBPK model results. Safety profiles were similar when acumapimod was co-administered with azithromycin or itraconazole. These studies highlight the value of PBPK modeling in drug development, and its potential to inform DDI investigations.
© 2020 Mereo BioPharma 1 Limited. CPT: Pharmacometrics & Systems Pharmacology published by Wiley Periodicals LLC on behalf of the American Society for Clinical Pharmacology and Therapeutics.
Conflict of interest statement
A.A. reports personal fees from Mereo BioPharma, Takeda, and Pfizer outside the submitted work. C.F. is an employee of ICON Clinical Research. W.M., and J.P. are employees of Mereo BioPharma.
Figures


References
-
- Wedzicha, J. , MacKinnon, A. & Parkin, J. Effectiveness of acumapimod oral p38 inhibitor in the treatment of acute severe exacerbations of COPD: results of the AETHER phase II trial. Am. J. Resp. Crit. Care Med. 197, A7710 (2018).
-
- MacNee, W. , Allan, R.J. , Jones, I. , De Salvo, M.C. & Tan, L.F. Efficacy and safety of the oral p38 inhibitor PH‐797804 in chronic obstructive pulmonary disease: a randomised clinical trial. Thorax 68, 738–745 (2013). - PubMed
Publication types
MeSH terms
Substances
LinkOut - more resources
Full Text Sources
Miscellaneous

