

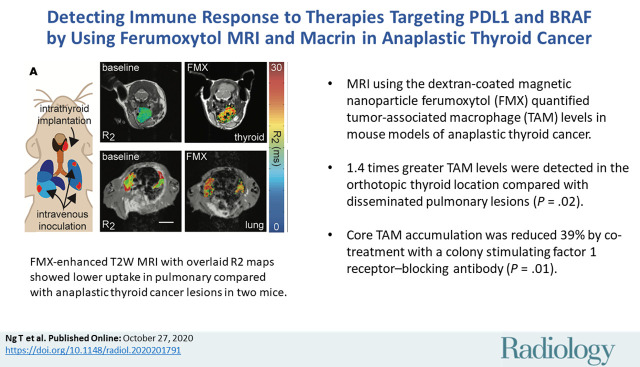
Detecting Immune Response to Therapies Targeting PDL1 and BRAF by Using Ferumoxytol MRI and Macrin in Anaplastic Thyroid Cancer
- PMID: 33107799
- PMCID: PMC7771993
- DOI: 10.1148/radiol.2020201791
Detecting Immune Response to Therapies Targeting PDL1 and BRAF by Using Ferumoxytol MRI and Macrin in Anaplastic Thyroid Cancer
Abstract
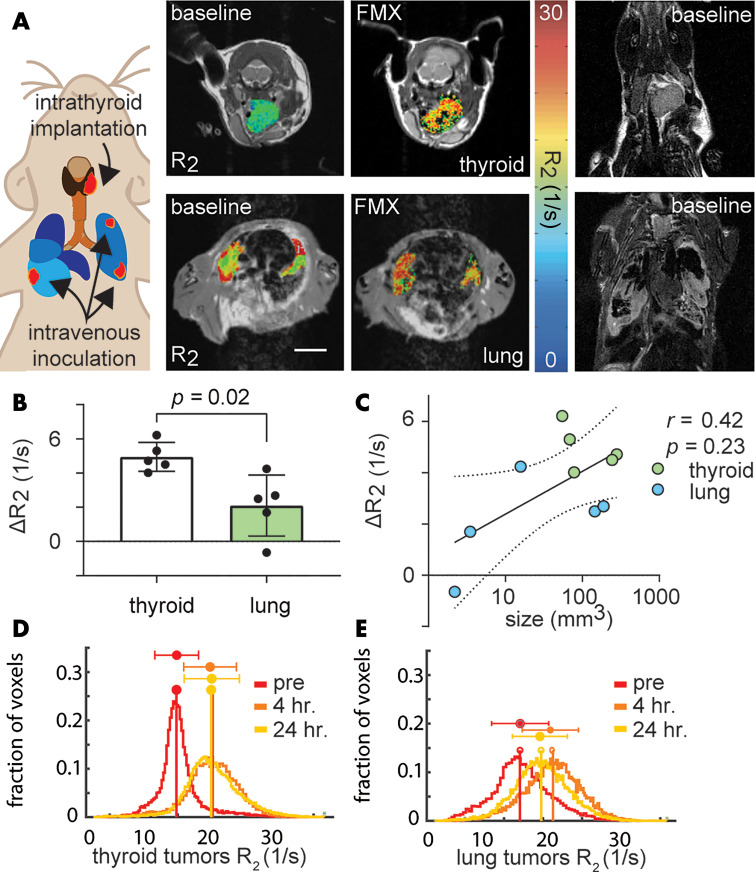
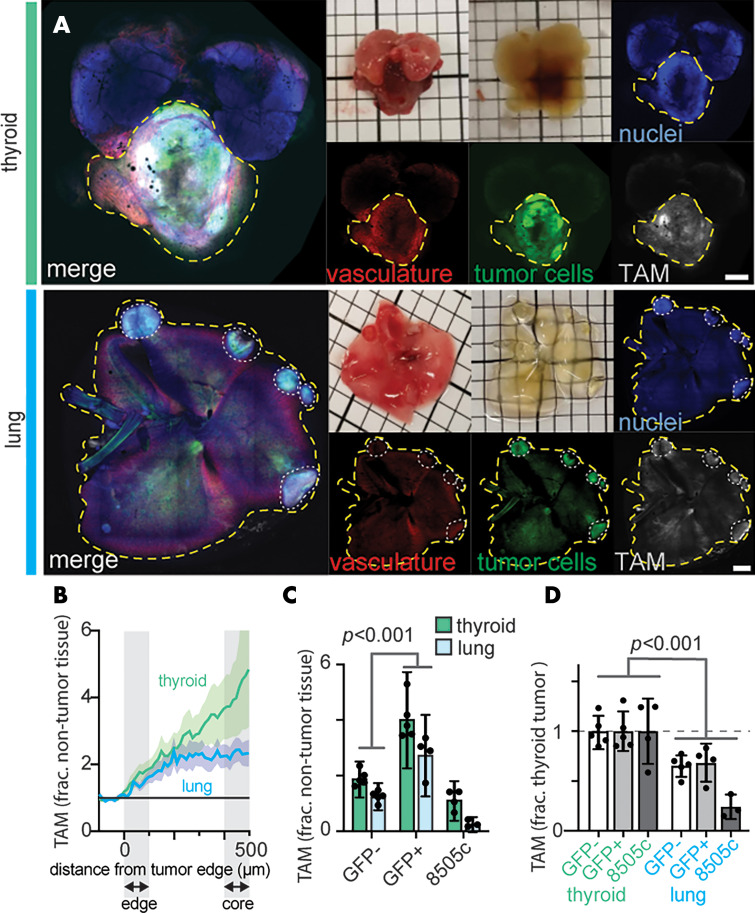
Background Anaplastic thyroid cancer (ATC) is aggressive with a poor prognosis, partly because of the immunosuppressive microenvironment created by tumor-associated macrophages (TAMs). Purpose To understand the relationship between TAM infiltration, tumor vascularization, and corresponding drug delivery by using ferumoxytol-enhanced MRI and macrin in an ATC mouse model. Materials and Methods ATC tumors were generated in 6-8-week-old female B6129SF1/J mice through intrathyroid injection to model orthotopic tumors, or intravenously to model hematogenous metastasis, and prospectively enrolled randomly into treatment cohorts (n = 94 total; August 1, 2018, to January 15, 2020). Mice were treated with vehicle or combined serine/threonine-protein kinase B-Raf (BRAF) kinase inhibitor (BRAFi) and anti-PDL1 antibody (aPDL1). A subset was cotreated with therapies, including an approximately 70-nm model drug delivery nanoparticle (DDNP) to target TAM, and an antibody-neutralizing colony stimulating factor 1 receptor (CSF1R). Imaging was performed at the macroscopic level with ferumoxytol-MRI and microscopically with macrin. Genetically engineered BrafV600E/WT p53-null allografts were used and complemented by a GFP-transgenic derivative and human xenografts. Tumor-bearing organs were processed by using tissue clearing and imaged with confocal microscopy and MRI. Two-tailed Wilcoxon tests were used for comparison (≥five per group). Results TAM levels were higher in orthotopic thyroid tumors compared with pulmonary metastatic lesions by 79% ± 23 (standard deviation; P < .001). These findings were concordant with ferumoxytol MRI, which showed 136% ± 88 higher uptake in thyroid lesions (P = .02) compared with lung lesions. BRAFi and aPDL1 combination therapy resulted in higher tumor DDNP delivery by 39% ± 14 in pulmonary lesions (P = .004). Compared with the untreated group, tumors following BRAFi, aPDL1, and CSF1R-blocking antibody combination therapy did not show greater levels of TAM or DDNP (P = .82). Conclusion In a mouse model of anaplastic thyroid cancer, ferumoxytol MRI showed 136% ± 88 greater uptake in orthotopic thyroid tumors compared with pulmonary lesions, which reflected high vascularization and greater tumor-associated macrophage (TAM) levels. Serine/threonine-protein kinase B-Raf inhibitor and anti-programmed death ligand 1 antibody elicited higher local TAM levels and 43% ± 20 greater therapeutic nanoparticle delivery but not higher vascularization in pulmonary tumors. © RSNA, 2020 Online supplemental material is available for this article. See also the editorial by Luker in this issue.
Figures
![Immunologic assessment of ferumoxytol and macrin cellular uptake. Lungs bearing anaplastic thyroid cancer (ATC) tumors, by using the TBP-3743 model, were excised 24 hours after administration with ferumoxytol and macrin. Within tumors, arrows mark colocalization in cellular staining of, A, iron oxide (by using Prussian blue) and F4/80, and, B, macrin and F4/80. C, Uptake of macrin on a per-cell basis was quantified by flow cytometry, after immunologic definition of cell populations from tumor-bearing lung tissue (Fig E2 [online] shows gating scheme). DAPI = 4’,6-diamidino-2-phenylindole, frac. max = fraction maximum, MΦ = macrophages.](https://cdn.ncbi.nlm.nih.gov/pmc/blobs/8adb/7771993/a4ccd4563936/radiol.2020201791.fig2.jpg)
![Quantification of how combination serine/threonine-protein kinase B-Raf inhibitor (BRAFi) and anti–programmed death ligand 1 (aPDL1) affects tumor-associated macrophage (TAM) accumulation and nanomedicine delivery. A, Representative confocal microscopy of optically cleared tumors reveals macrin accumulation at 24 hours after administration, following an 8-day course of treatment with combination BRAFi and aPDL1 in the murine TBP model of anaplastic thyroid cancer (ATC; scale bar, 5 mm). B, Corresponding to A, the scatter dot plot shows TAM density quantified across single cells from microscopy data by using macrin to identify TAM. Bonferroni correction applied for multiple hypothesis testing (n = 2 hypotheses, corresponding to lung and thyroid, comparing with or without combination BRAFi and aPDL1 treatment). C, Graph shows macrin and drug delivery nanoparticle (DDNP) uptake correlated across treatment groups on a tumor-by-tumor basis (see Fig E11 [online] for individual tumor-by-tumor correlation within individual subjects). D, Scatter dot plots show DDNP uptake quantified by confocal microscopy in TAM (macrin+) and other (macrin-) cells by using the TBP model as a fraction of average uptake in macrin+ cells. See Figure E9 (online) for comparison across drug treatments. For B and D, data are means ± standard deviation.](https://cdn.ncbi.nlm.nih.gov/pmc/blobs/8adb/7771993/2b68991a52a2/radiol.2020201791.fig4.jpg)

![The influence of anti-colony stimulating factor 1 antibody treatment (aCSF1R) on tumor-associated macrophage (TAM) levels following combination threonine-protein kinase B-Raf inhibitor (BRAFi) and anti–programmed death ligand 1 (aPDL1) treatment. By using the TBP model, lungs bearing TBP-3743 tumors were excised 24 hours after treatment with macrin and drug delivery nanoparticle (DDNP), which were co-injected intravenously after an 8-day treatment course of aPDL1, BRAFi, and CSF1R-blocking antibody, as defined in Figure E1 (online). A, Scatter dot plot shows macrophage abundance quantified by flow cytometry of tumor-bearing lungs; the two macrophage populations were normalized to their abundances in the control group (see Fig E2 [online] for gating schemes and absolute abundance). B, Plot shows expression of CD206 quantified in interstitial macrophages by flow cytometry. C, As in Figure 5, confocal microscopy of cleared tumor-bearing lungs quantified TAM in tumor cores relative to edges. D, Scatterplot shows total TAM levels in tumors correlated with total DDNP uptake, shown as average values across tumors in individual mice. A–C, Bonferroni correction applied. Data are means ± standard deviation.](https://cdn.ncbi.nlm.nih.gov/pmc/blobs/8adb/7771993/ff67ac7e1d48/radiol.2020201791.fig6.jpg)
Comment in
-
Imaging the Immune Tumor Microenvironment to Monitor and Improve Therapy.Radiology. 2021 Jan;298(1):133-134. doi: 10.1148/radiol.2020203799. Epub 2020 Oct 27. Radiology. 2021. PMID: 33112715 Free PMC article. No abstract available.
References
Publication types
MeSH terms
Substances
Grants and funding
LinkOut - more resources
Full Text Sources
Other Literature Sources
Medical
Research Materials
Miscellaneous
