Measuring Mobility and Room Occupancy in Clinical Settings: System Development and Implementation
- PMID: 33107838
- PMCID: PMC7655473
- DOI: 10.2196/19874
Measuring Mobility and Room Occupancy in Clinical Settings: System Development and Implementation
Abstract
Background: The use of location-based data in clinical settings is often limited to real-time monitoring. In this study, we aim to develop a proximity-based localization system and show how its longitudinal deployment can provide operational insights related to staff and patients' mobility and room occupancy in clinical settings. Such a streamlined data-driven approach can help in increasing the uptime of operating rooms and more broadly provide an improved understanding of facility utilization.
Objective: The aim of this study is to measure the accuracy of the system and algorithmically calculate measures of mobility and occupancy.
Methods: We developed a Bluetooth low energy, proximity-based localization system and deployed it in a hospital for 30 days. The system recorded the position of 75 people (17 patients and 55 staff) during this period. In addition, we collected ground-truth data and used them to validate system performance and accuracy. A number of analyses were conducted to estimate how people move in the hospital and where they spend their time.
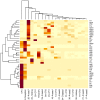
Results: Using ground-truth data, we estimated the accuracy of our system to be 96%. Using mobility trace analysis, we generated occupancy rates for different rooms in the hospital occupied by both staff and patients. We were also able to measure how much time, on average, patients spend in different rooms of the hospital. Finally, using unsupervised hierarchical clustering, we showed that the system could differentiate between staff and patients without training.
Conclusions: Analysis of longitudinal, location-based data can offer rich operational insights into hospital efficiency. In particular, they allow quick and consistent assessment of new strategies and protocols and provide a quantitative way to measure their effectiveness.
Keywords: Bluetooth; efficiency; indoor; localization; metrics; mobile phone; mobility; occupancy; smartphone.
©Gabriele Marini, Benjamin Tag, Jorge Goncalves, Eduardo Velloso, Raja Jurdak, Daniel Capurro, Clare McCarthy, William Shearer, Vassilis Kostakos. Originally published in JMIR mHealth and uHealth (http://mhealth.jmir.org), 27.10.2020.
Conflict of interest statement
Conflicts of Interest: None declared.
Figures


References
-
- Lorcan C, Steve N, Paddy N, Aaron Q. Sensor Aggregation and Integration in Healthcare Location Based Services. Pervasive Health Conference and Workshops; PCTHEALTH'06; November 29-December 1, 2006; Innsbruck, Austria. 2006. - DOI
-
- Miclo R, Fontanili F, Marquès G, Bomert P, Lauras M. RTLS-Based Process Mining: Towards an Automatic Process Diagnosis in Healthcare. International Conference on Automation Science and Engineering; CASE'15; August 24-28, 2015; Gothenburg, Sweden. 2015. - DOI
-
- Kamel Boulos MN, Berry G. Real-time locating systems (RTLS) in healthcare: a condensed primer. Int J Health Geogr. 2012 Jun 28;11:25. doi: 10.1186/1476-072X-11-25. https://ij-healthgeographics.biomedcentral.com/articles/10.1186/1476-072... - DOI - DOI - PMC - PubMed
-
- YNOMIA and CSIRO Collaboration. [2020-09-22]. https://ynomia.io/technology.
Publication types
MeSH terms
LinkOut - more resources
Full Text Sources
Medical

