. 2021 Feb 1;218(2):e20200476.
doi: 10.1084/jem.20200476.

Nfkb2 variants reveal a p100-degradation threshold that defines autoimmune susceptibility

Affiliations

Nfkb2 variants reveal a p100-degradation threshold that defines autoimmune susceptibility

Rushika C Wirasinha et al. J Exp Med. .

Abstract

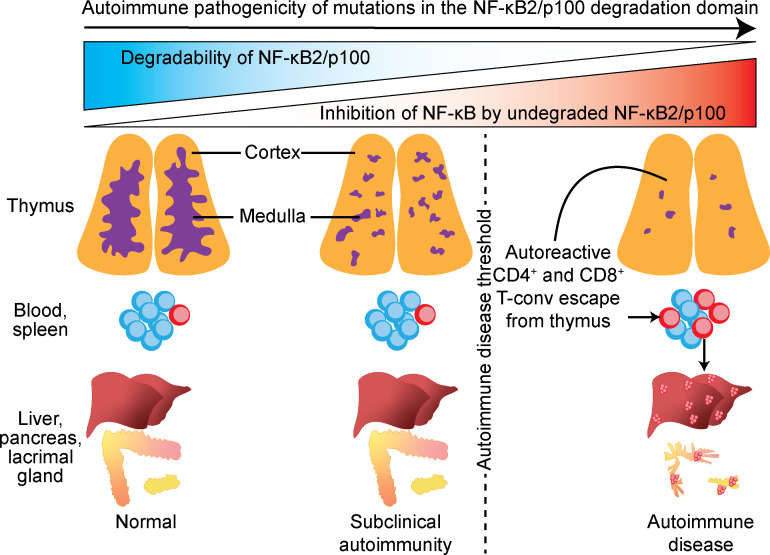
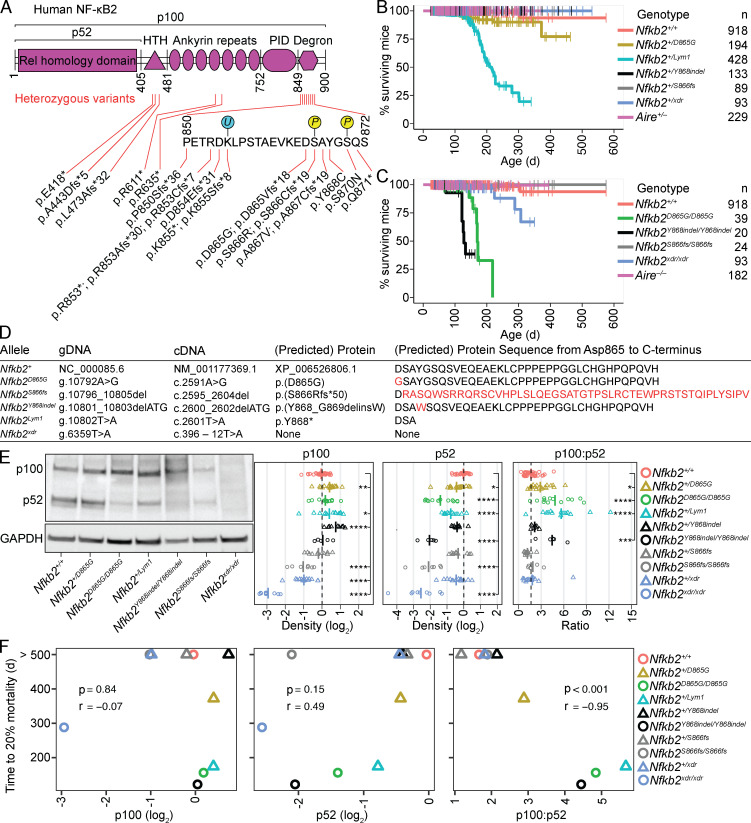
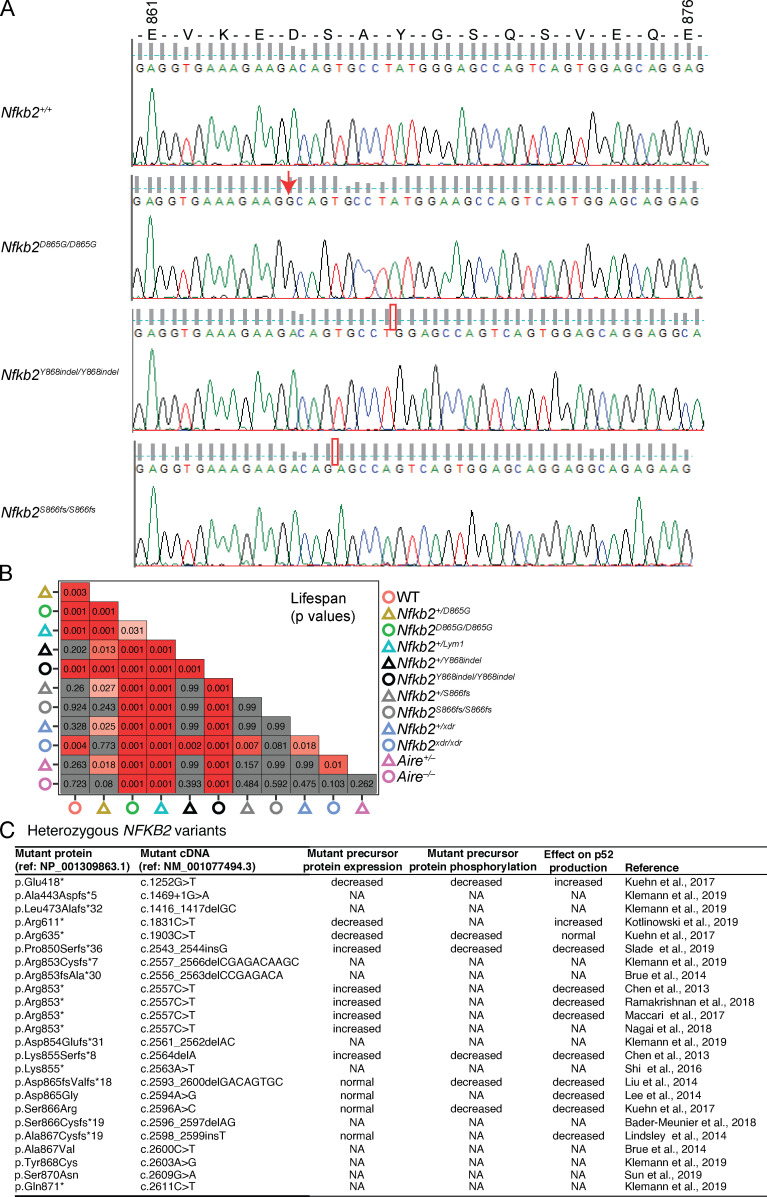
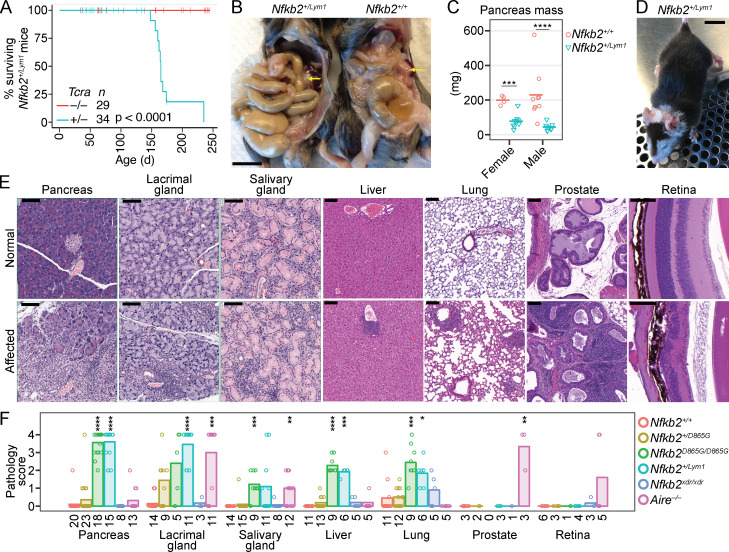
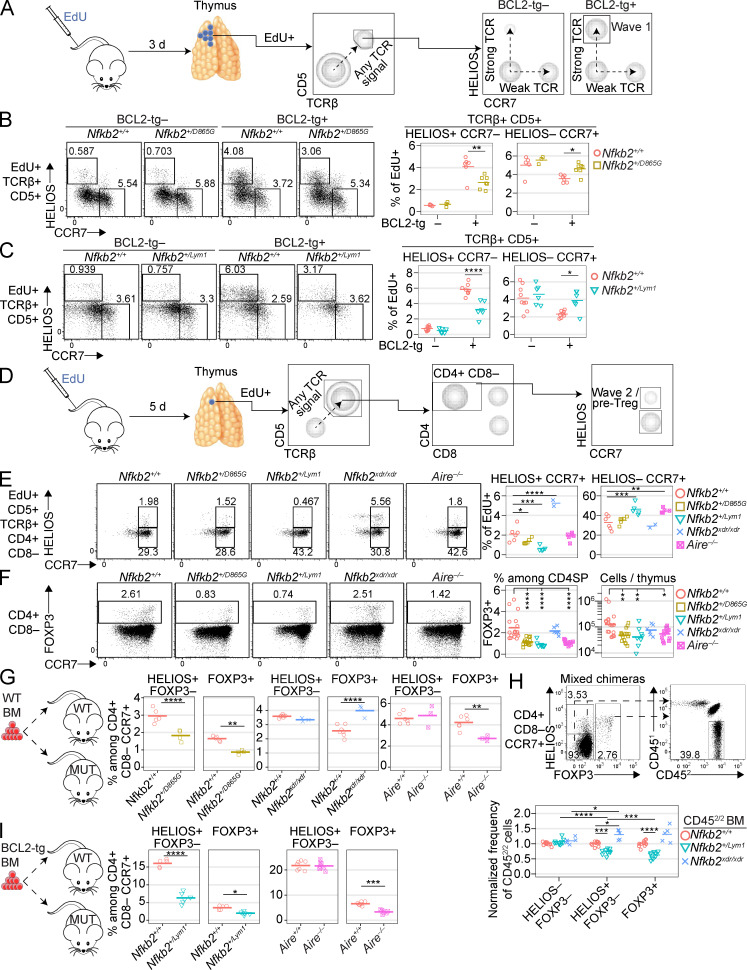
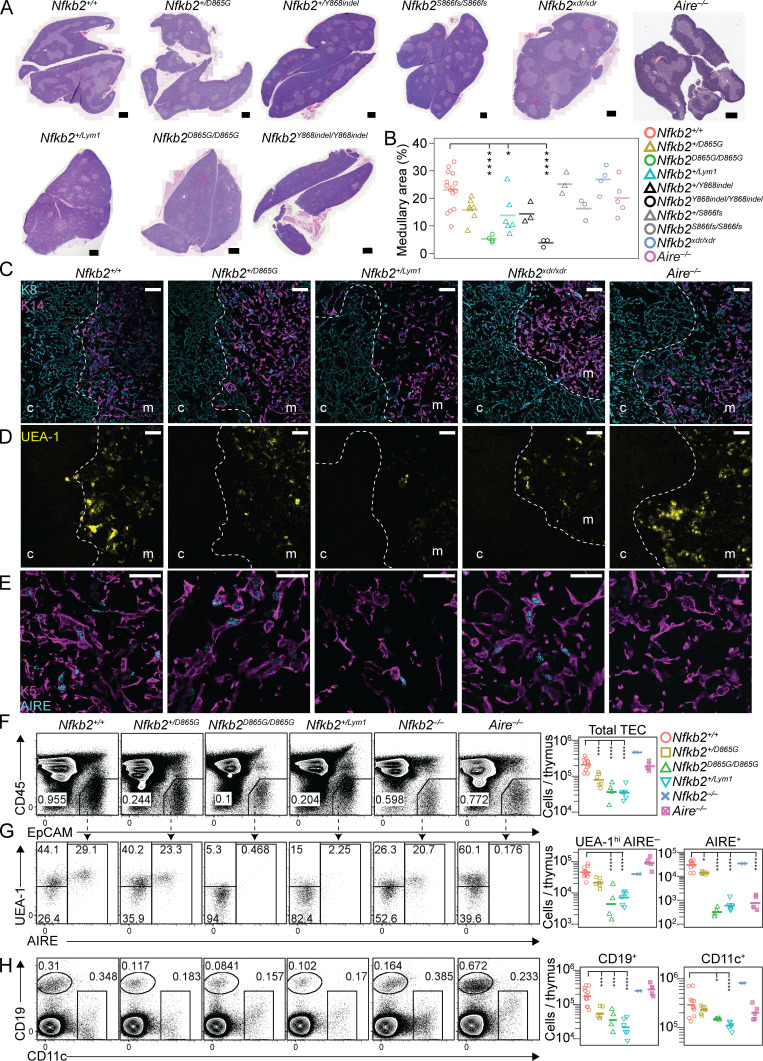
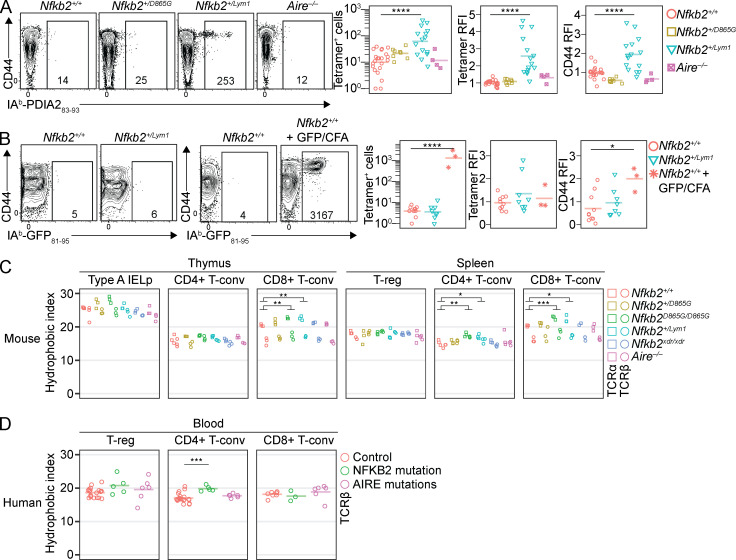
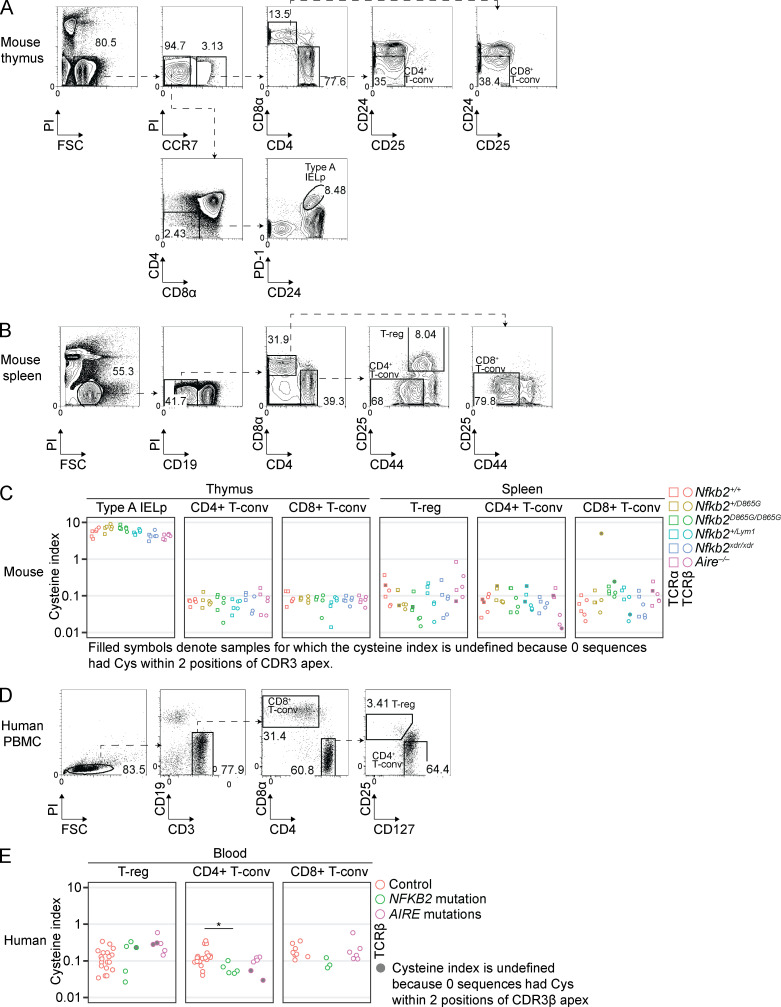
NF-κB2/p100 (p100) is an inhibitor of κB (IκB) protein that is partially degraded to produce the NF-κB2/p52 (p52) transcription factor. Heterozygous NFKB2 mutations cause a human syndrome of immunodeficiency and autoimmunity, but whether autoimmunity arises from insufficiency of p52 or IκB function of mutated p100 is unclear. Here, we studied mice bearing mutations in the p100 degron, a domain that harbors most of the clinically recognized mutations and is required for signal-dependent p100 degradation. Distinct mutations caused graded increases in p100-degradation resistance. Severe p100-degradation resistance, due to inheritance of one highly degradation-resistant allele or two subclinical alleles, caused thymic medullary hypoplasia and autoimmune disease, whereas the absence of p100 and p52 did not. We inferred a similar mechanism occurs in humans, as the T cell receptor repertoires of affected humans and mice contained a hydrophobic signature of increased self-reactivity. Autoimmunity in autosomal dominant NFKB2 syndrome arises largely from defects in nonhematopoietic cells caused by the IκB function of degradation-resistant p100.


Conflict of interest statement

Disclosures: M.D. Keller reported "other" from Gilead outside the submitted work. D.H.D. Gray reported grants from Servier Pharmacetuicals outside the submitted work and is an employee of The Walter and Eliza Hall Institute of Medical Research, which receives milestone and royalty payments related to venetoclax (BCL-2 inhibitor). No other disclosures were reported.

Figures

None
Graphical abstract
Figure 1.
Figure 1.
Decreased lifespan in mice with Nfkb2 genotypes that result in above-threshold p100 accumulation relative to p52 (see also Fig. S1). (A) Cartoon of human NF-κB2, showing its domains and known pathological variants. (B and C) Lifespans of WT mice compared with mice that were heterozygous (B) or homozygous (C) for the indicated Nfkb2 or Aire genotypes. Small vertical lines indicate observations censored for reasons unrelated to illness. See Fig. S1 B for statistical analyses. (D) Nfkb2 alleles studied in this paper. See Fig. S1 A for DNA sequence chromatograms. (E) Nfkb2 genotype affects p100 and p52 expression. Spleen lysates were subjected to SDS-PAGE followed by immunoblotting with an antibody reactive with p100 and p52 or GAPDH as a loading control. Graphs (right) show the density of p100 or p52 normalized to GAPDH for each sample and then divided by the mean of Nfkb2+/+ control samples on the same gel. Far right graph shows the p100/p52 ratio, excluding Nfkb2xdr/xdr samples, in which the p100 and p52 densities were below the limit of detection. Each symbol on a graph represents an individual mouse, determined as the mean of one to five technical replicates. Vertical dashed lines mark the mean of the Nfkb2+/+ group. Data from female and male mice were comparable and were pooled from 26 experiments. Nfkb2S866fs/S866fs mice (mean ± SD, 372 ± 289 d; range, 61–614 d) were older than Nfkb2+/+ mice (mean ± SD, 163 ± 99 d; range, 60–571 d); otherwise, ages were not significantly different from the Nfkb2+/+ group. Each genotype was compared with the Nfkb2+/+ group using one-way ANOVA with Dunnett’s post-test; *, P < 0.05; **, P < 0.01; ***, P < 0.001; ****, P < 0.0001. (F) For the indicated mouse strains (far right), the graphs show the time to 20% mortality plotted against the mean p100 density (left), mean p52 density (middle), or mean p100/p52 ratio (right), annotated with P and r values calculated using Pearson’s test for correlation.
Figure S1.
Figure S1.
NFKB2/Nfkb2 variants and statistical analysis of lifespan in the murine Nfkb2 allelic series (related to Fig. 1). (A) Sanger sequencing chromatograms for DNA encoding the p100 degron of a control B6 mouse (Nfkb2+/+) and mice of the indicated Nfkb2 genotypes generated in this study. (B) For pairs of survival curves shown in Fig. 1, B and C, the grid shows the P values of log-rank tests. (C) NFKB2 variants identified in patients, including effects of variants on expression and phosphorylation of the mutant precursor protein and on p52 expression, as well as the reference. NA, not available.
Figure 2.
Figure 2.
T cell–dependent multiorgan autoimmunity caused by p100 degron mutations. (A) Lifespans of cohoused Tcra+/− Nfkb2+/Lym1 and Tcra−/− Nfkb2+/Lym1 sibling mice (P value, log-rank test). Small vertical lines indicate observations censored for reasons unrelated to illness. (B) Abdominal viscera of Nfkb2+/+ and Nfkb2+/Lym1 littermates aged 150 d. Yellow arrows indicate the pancreas, which is small in the Nfkb2+/Lym1 mouse; scale bar, 1 cm. (C) Pancreas mass in Nfkb2+/+ and Nfkb2+/Lym1 mice stratified by sex. (D) A male Nfkb2+/Lym1 mouse aged 225 d with dermatitis on the face and ears and vitiligo; scale bar, 1 cm. (E) Histology of organs (denoted above) showing normal (top row) and affected (bottom row) tissue sections; scale bars, 100 µm. (F) Pathology score for each organ colored by genotype, with bars showing the group mean. The number of mice per group is shown below the x axis. In F, the Aire−/− mice (mean ± SD, 182 ± 60 d; range, 92–272 d) were significantly older than the Nfkb2+/+ mice (mean ± SD, 118 ± 43 d; range, 84–211 d). The ages of all other groups in F and the Nfkb2+/Lym1 mice in C were not significantly different from the Nfkb2+/+ group. In A and F, data from female and male mice were comparable and therefore pooled. For each sex in C or organ in F, each genotype was compared with the Nfkb2+/+ group using two-way ANOVA with Sidak’s post-test (C) or Kruskal-Wallis tests with Dunn’s post-test (F); *, P < 0.05; **, P < 0.01; ***, P < 0.001; ****, P < 0.0001.
Figure 3.
Figure 3.
Diminished thymic tolerance mechanisms in mice with p100 degron mutations (see also Fig. S2). (A) Quantification of wave 1 deletion. At 3 d after proliferating thymocytes incorporate EdU, nascent (EdU+) TCR-signaled (CD5+ TCRβ+) thymocytes were analyzed to resolve Helios+ CCR7 and Helios CCR7+ subsets, which have received a strong or weak TCR signal, respectively. BCL2-tg expression inhibits apoptotic deletion, enabling measurement of the scale of wave 1 deletion. (B) Helios/CCR7 phenotypes of EdU+ CD5+ TCRβ+ thymocytes from Nfkb2+/+ or Nfkb2+/D865G mice, which were negative or positive for BCL2-tg (top), 3 d after EdU injection, with summaries (right) showing the frequencies of gated populations among EdU+ thymocytes. (C) Nfkb2+/+ and Nfkb2+/Lym1 mice were examined as in B. The age ranges of mice were 68–94 d (B) and 40–70 d (C). (D) Quantification of thymocytes that received a weak or strong TCR signal at the wave 2 checkpoint. At 5 d after EdU injection, the EdU+ CD5+ TCRβ+ CD4SP population was analyzed to resolve Helios+ CCR7+ (strongly TCR-signaled) and Helios CCR7+ (weakly TCR-signaled) subsets. (E) Plots show the Helios/CCR7 phenotype of EdU+ CD5+ TCRβ+ CD4SP thymocytes from mice of the indicated genotypes 5 d after EdU injection, with summaries showing the frequencies of gated populations among EdU+ thymocytes. The Nfkb2xdr/xdr mice (45 d old) were significantly younger than the Nfkb2+/+ mice (mean ± SD, 86 ± 22 d; range 53–105 d). The ages of all other groups were not significantly different from the Nfkb2+/+ group. (F) For the genotypes examined in E, plots show Foxp3/CCR7 phenotype of CD4SP thymocytes, with a graph showing the frequency and number of Foxp3+ cells in the CD4SP population. Age of mice did not differ significantly between groups (mean ± SD, 84 ± 24 d; range, 50–158 d). (G) Nfkb2+/+, Nfkb2+/D865G, Nfkb2xdr/xdr, Aire+/+, or Aire−/− mice aged 42–98 d were irradiated then reconstituted with WT BM. Graphs show the frequencies of Helios+ Foxp3 and Foxp3+ cells among CD4SP CCR7+ thymocytes in the chimeric mice 5–14 wk after transplantation. (H) WT CD451/1 mice aged 57–145 d were irradiated then reconstituted with WT CD451/2 BM mixed with Nfkb2+/+, Nfkb2+/Lym1, or Nfkb2xdr/xdr CD452/2 BM. All donors and recipients were male. 8–27 wk later, flow cytometry was used to determine the frequency of CD452/2 cells among DP thymocytes and among three subsets of CD4SP CCR7+ thymocytes defined by Helios and Foxp3 expression as gated in the plots. The graph shows the frequency of CD452/2 cells in the subsets indicated on the x axis, divided by the frequency of CD452/2 cells among DP thymocytes in the same sample. To enable comparisons between CD4SP CCR7+ thymocyte subsets, data were then divided by the mean of the Nfkb2+/+ group for each subset. (I) Nfkb2+/+, Nfkb2+/Lym1, Aire+/+, or Aire−/− mice aged 42–96 d were irradiated then reconstituted with BCL2-tg+ BM. Graphs show the frequencies of Helios+ Foxp3 and Foxp3+ cells among CD4SP CCR7+ thymocytes in the chimeric mice 7–10 wk after transplantation. Each symbol in a summary graph represents an individual mouse, and horizontal bars show the group means. Each graph shows data compiled from one (G and I), two (B, C, and E), three (H), or eight (F) separate experiments. Unless otherwise stated, graphs show data from female and male mice. Statistical comparisons used one-way (E and F) or two-way (B, C, and H) ANOVA with Sidak’s multiple comparisons tests or Student’s t tests (G and I); *, P < 0.05; **, P < 0.01; ***, P < 0.001; ****, P < 0.0001.
Figure S2.
Figure S2.
Quantification of thymic deletion at waves 1 and 2 (related to Fig. 3). (A and B) Thymocyte phenotypes of Nfkb2+/+ and Nfkb2+/D865G mice, which were negative or positive for BCL2-tg (top), 3 d after a single dose of EdU. (A) Forward scatter (FSC) versus EdU on all thymocytes with a gate for EdU+ cells, including a negative control sample from an uninjected mouse (column 6). (B) CD5/TCRβ phenotype of EdU+ thymocytes with a gate to identify CD5+ TCRβ+ (TCR-signaled) cells, including a negative control sample from a Tcra–/– mouse (column 5). (C and D) Nfkb2+/+ and Nfkb2+/Lym1 mice, which were negative or positive for BCL2-tg (top), were examined as above in A and B. A BCL2-tg+ B2m–/– H2-Aa–/– mouse was used as a negative control for the gating of CD5+ TCRβ+ cells (column 5). (E–G) Mice of the indicated genotypes were injected with a single dose of EdU and thymocytes were analysed 5 d later. (E) FSC versus EdU on all thymocytes with a gate for EdU+ cells. (F and G) Plots show gating of CD5+ TCRβ+ cells among EdU+ thymocytes (F) and CD4+ CD8α cells among EdU+ CD5+ TCRβ+ thymocytes (G). Each symbol in a graph (right) represents a measurement from one mouse and horizontal bars show the group means. Data in A and B, C and D, and E–G were compiled from two separate experiments each. Statistical comparisons used one-way ANOVA with Sidak’s multiple comparisons tests; *, P < 0.05; **, P < 0.01.
Figure 4.
Figure 4.
Quantitative and functional T reg cell deficiencies conferred by p100 degron mutations. (A) Plots show CD25/CD127 phenotypes of human peripheral blood CD19 CD4+ CD8 cells, with a graph showing the CD25+ CD127 T reg cell frequency from healthy control subjects or patients with mutations in NFKB2 or AIRE (see Table S1 for details). (B) Frequencies of Foxp3+ and CD44hi Foxp3 cells among CD4+ splenocytes in mice of the indicated genotypes. Age of mice did not differ significantly between groups (mean ± SD, 119 ± 48 d; range, 51–219 d). (C) From mixed chimeras (described in Fig. 3 H) harboring WT CD451/2 BM and WT, Nfkb2+/Lym1, or Nfkb2xdr/xdr CD452/2 BM; plots show the gates used to resolve three subsets of B220 CD4+ CD8 splenocytes based on CD44/Foxp3 phenotype. The graph shows the frequency of CD452/2 cells in the subsets indicated on the x axis, divided by the frequency of CD452/2 cells among CD44lo Foxp3 cells in the same sample. (D) Survival curves of Tcra−/− Nfkb2+/+ female mice after irradiation at 62–90 d of age followed by reconstitution with CD451/2 Foxp3−/y BM alone or mixed 1:1 with CD451/1 Nfkb2+/D865G BM or CD451/1 Nfkb2+/Lym1 BM (see key, middle). All BM donors were male. Grid (right) shows the P values of log-rank tests comparing each pair of experimental groups. (E) For the chimeras described in D at 106 d after transplantation, plots show the gates used to determine the frequency of Foxp3+ and CD44+ Foxp3 cells among the CD451/2 and CD451/1 subsets of B220 CD4+ CD8 splenocytes, enumerated for multiple mice in the graph (right). Unless otherwise stated, graphs show data from female and male mice compiled from 1 (D and E), 3 (C), 5 (A), or 11 (B) separate experiments. Statistical comparisons used one-way (A and B) or two-way (C and E) ANOVA with Sidak’s multiple comparisons tests; *, P < 0.05; **, P < 0.01; ****, P < 0.0001.
Figure 5.
Figure 5.
Autoimmune susceptibility arises from effects within nonhematopoietic cells. (A) Posttransplant survival curves of Nfkb2+/+, Nfkb2+/Lym1 or Nfkb2+/D865G mice, which were αβ T cell–deficient (Tcra−/−) and aged 63–85 d at irradiation and reconstitution with T cell–depleted BM from Nfkb2+/+ or Nfkb2+/Lym1 donors (see key, middle). (B) Survival curves of Nfkb2+/Lym1 mice after irradiation and reconstitution with Nfkb2+/+ BM on day 0 without further treatment (blue trace) with some Nfkb2+/Lym1 mice subsequently receiving FACS-sorted Foxp3GFP+ spleen and lymph node cells from WT Foxp3GFP mice at day 8 (red trace). In the group receiving T reg cells, some recipients were Tcra−/− and aged 78–122 d, whereas others were Tcra+/+ and aged 54–88 d, at irradiation. Since T reg cell transfer prevented disease in three out of four Tcra−/− recipients and two out of six Tcra+/+ recipients, these groups were combined. Other Tcra−/− Nfkb2+/Lym1 mice received whole Nfkb2+/+ splenocytes on day 0 in the absence of any other treatment (gray trace). Data in A and B were combined from two separate experiments each. Grids show the P values of log-rank tests comparing each pair of experimental groups.
Figure 6.
Figure 6.
Impaired thymic medullary development in mice with p100 degron mutations. (A and B) Thymus sections stained with hematoxylin and eosin (A; scale bars, 500 µm) with a graph showing the percentage area occupied by the medulla (B). Age did not differ significantly between genotypes (mean ± SD, 110 ± 35 d; range, 55–181 d). (C–E) Immunofluorescence microscopy on thymus sections from mice at 61–86 d of age detecting K8 (cyan) and cytokeratin-14 (K14; magenta; C), UEA-1 (yellow; D), or cytokeratin-5 (K5; magenta) and AIRE (cyan; E); c, cortex; m, medulla; dashed line, corticomedullary border (n = 2 mice per genotype in a single experiment; scale bars, 50 µm). The detection of different proteins in the same set of sections is shown in C and D. (F and G) From mice aged 84–133 d, thymic cells released by enzymatic digestion were analyzed by flow cytometry for CD45/EpCAM (F) to identify CD45 EpCAM+ TECs that were analyzed for binding of UEA-1 and expression of AIRE (G). (H) Plots show the CD19/CD11c phenotype of thymic CD45+ cells with gates for B cells (CD19+) and DCs (CD11c+). For each subset gated in the plots, graphs show the number of cells per thymus (right). Each symbol in a graph represents an individual mouse and horizontal bars mark the group mean compiled from two separate experiments. Graphs show data from female and male mice. Each genotype was compared with the Nfkb2+/+ group using one-way ANOVA with Sidak’s multiple comparisons test; log10-transformed values were used in F–H; *, P < 0.05; ***, P < 0.001; ****, P < 0.0001.
Figure 7.
Figure 7.
Increased self-reactivity of T cells selected in the presence of pathogenic NFKB2/Nfkb2 genotypes (see also Fig. S3). (A) After magnetic bead-based enrichment of IAb-PDIA2 tetramer-binding cells from pooled spleen and lymph nodes, plots show IAb-PDIA2 tetramer staining versus CD44 expression on CD4+ T cells, with summaries (right) showing the total number of tetramer-binding CD4+ cells detected per mouse, tetramer relative fluorescence intensity (RFI), and CD44 RFI of the tetramer-binding cells. To calculate RFI, mean fluorescence intensities were divided by the mean of Nfkb2+/+ samples analyzed on the same day. (B) For mice of the indicated genotypes (top), some of which had been immunized with GFP81–95 emulsified in CFA, plots show IAb-GFP81-95 tetramer staining versus CD44 expression on CD4+ T cells, with summaries presented as in A (right). In A and B, numbers on plots indicate the number of cells in the gate shown, and each symbol in a graph represents one mouse while horizontal bars show group means. Age did not differ significantly between genotypes or peptides (mean ± SD, 135 ± 48 d; range, 63–312 d). Graphs show data from female and male mice compiled from seven (A) or two (B) separate experiments. (C) For T cell subsets sorted from the thymus or spleen (top) of female mice of the indicated genotypes (color coded, right), graphs show the percentage of unique TCRα (squares) or TCRβ (circles) sequences with a self-reactivity-promoting amino acid doublet at CDR3 P6-P7 (hydrophobic index; Stadinski et al., 2016). Age did not differ significantly between genotypes (mean ± SD, 105 ± 12 d; range, 84–120 d). IELp, precursors of CD8αα intestinal intraepithelial lymphocytes. (D) Hydrophobic index of the TCRβ repertoire of T cell subsets (top) sorted from the blood of healthy control subjects or individuals with mutations in NFKB2 or AIRE (see key, right). Each symbol represents an individual sample. Statistical comparisons used one-way (A, B, and D) or two-way (C) ANOVA to compare each group with the control group, followed by Sidak’s multiple comparisons test, using log10-transformed values for tetramer+ cell counts (A and B) and TCRα and TCRβ values matched by mouse (C); *, P < 0.05; **, P < 0.01; ***, P < 0.001; ****, P < 0.0001.
Figure S3.
Figure S3.
T cell sorting gates for TCR-sequencing and cysteine index results (related to Fig. 7). (A and B) Flow cytometry gates used to sort T cell subsets from (A) thymus and (B) spleen of female Nfkb2+/+, Nfkb2+/D865G, Nfkb2D865G/D865G, Nfkb2+/Lym1, Nfkb2xdr/xdr, and Aire−/− mice aged 84–120 d (n = 3/genotype). (C) For T cell subsets sorted from the thymus or spleen (top) of mice of the indicated genotypes (color coded, right), graphs show the percentage of unique TCRα (squares) or TCRβ (circles) sequences with cysteine within two positions of the CDR3 apex (cysteine index). (D) Gating strategy to sort T cell subsets from human PBMC for TCR sequencing. (E) Cysteine index of T cell subsets (bottom) sorted from PBMC of healthy control subjects or individuals with mutations in NFKB2 or AIRE (see key, right). In C and E, filled symbols indicate samples that had zero sequences with cysteine within two positions of the CDR3 apex; in these cases, the symbols represent the reciprocal of the number of unique sequences in the sample, expressed as a percentage; *, P < 0.05; one-way ANOVA with Sidak’s multiple comparisons test.

Similar articles

Cited by

References

    1. Allan, C., Burel J.M., Moore J., Blackburn C., Linkert M., Loynton S., Macdonald D., Moore W.J., Neves C., Patterson A., et al. . 2012. OMERO: flexible, model-driven data management for experimental biology. Nat. Methods. 9:245–253. 10.1038/nmeth.1896 - DOI - PMC - PubMed
    1. Basak, S., Kim H., Kearns J.D., Tergaonkar V., O’Dea E., Werner S.L., Benedict C.A., Ware C.F., Ghosh G., Verma I.M., and Hoffmann A.. 2007. A fourth IkappaB protein within the NF-kappaB signaling module. Cell. 128:369–381. 10.1016/j.cell.2006.12.033 - DOI - PMC - PubMed
    1. Betts, J.C., and Nabel G.J.. 1996. Differential regulation of NF-kappaB2(p100) processing and control by amino-terminal sequences. Mol. Cell. Biol. 16:6363–6371. 10.1128/MCB.16.11.6363 - DOI - PMC - PubMed
    1. Brue, T., Quentien M.H., Khetchoumian K., Bensa M., Capo-Chichi J.M., Delemer B., Balsalobre A., Nassif C., Papadimitriou D.T., Pagnier A., et al. . 2014. Mutations in NFKB2 and potential genetic heterogeneity in patients with DAVID syndrome, having variable endocrine and immune deficiencies. BMC Med. Genet. 15:139 10.1186/s12881-014-0139-9 - DOI - PMC - PubMed
    1. Cao, Y., Bonizzi G., Seagroves T.N., Greten F.R., Johnson R., Schmidt E.V., and Karin M.. 2001. IKKalpha provides an essential link between RANK signaling and cyclin D1 expression during mammary gland development. Cell. 107:763–775. 10.1016/S0092-8674(01)00599-2 - DOI - PubMed

Publication types