. 2021 Jan 4;131(1):e129115.
doi: 10.1172/JCI129115.

Zeb1 modulates hematopoietic stem cell fates required for suppressing acute myeloid leukemia

Affiliations

Zeb1 modulates hematopoietic stem cell fates required for suppressing acute myeloid leukemia

Alhomidi Almotiri et al. J Clin Invest. .

Abstract

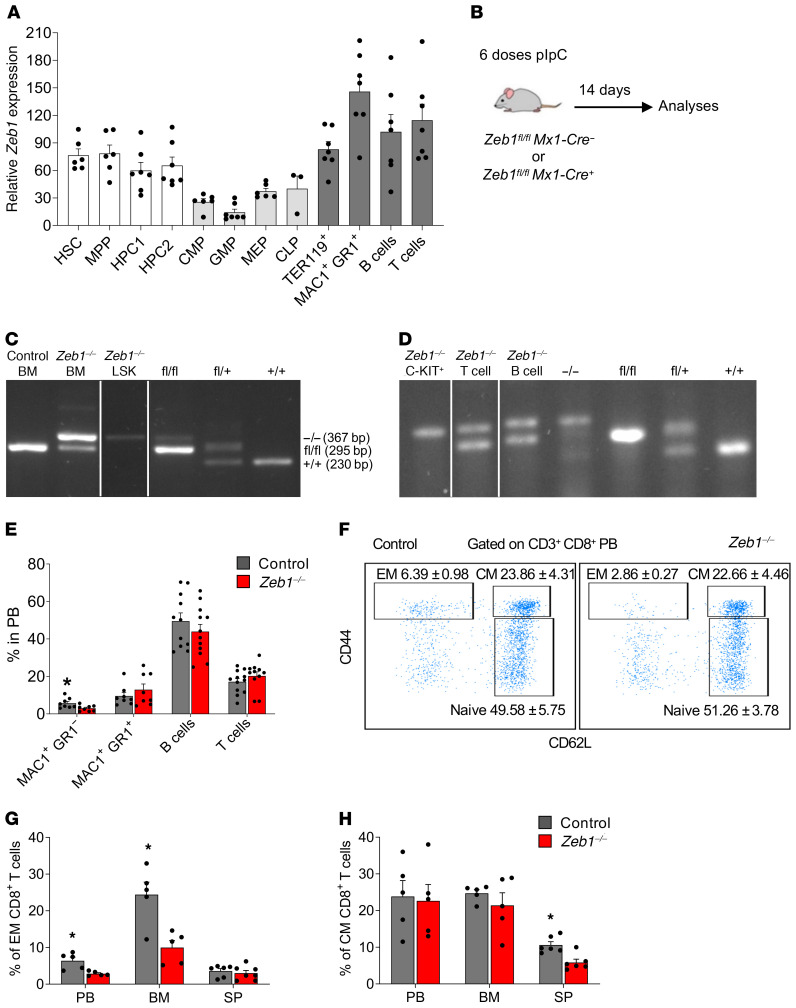
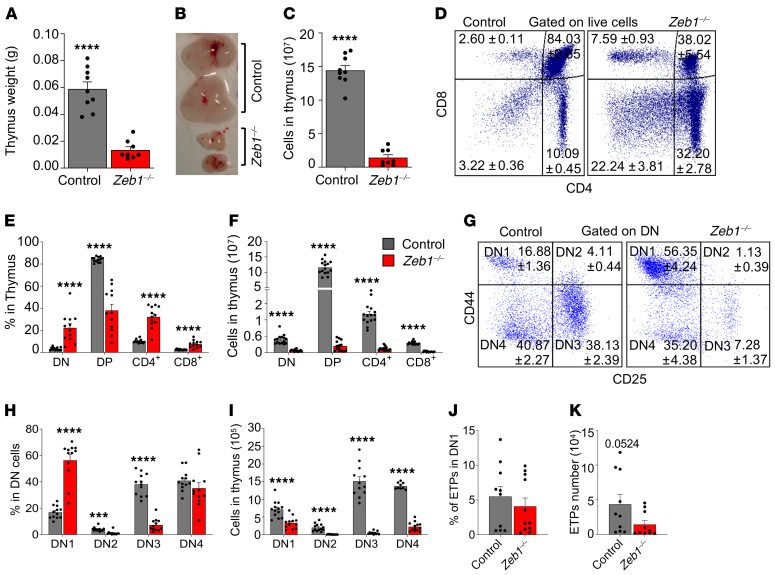
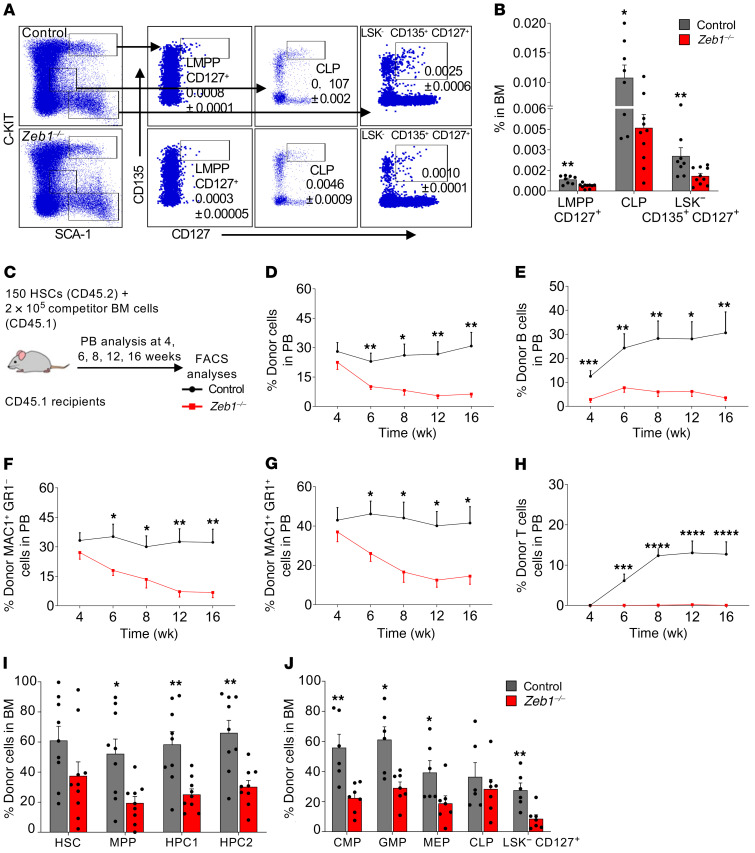
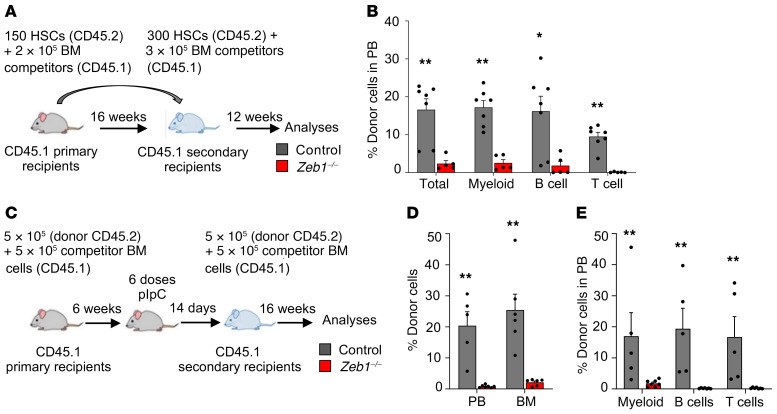
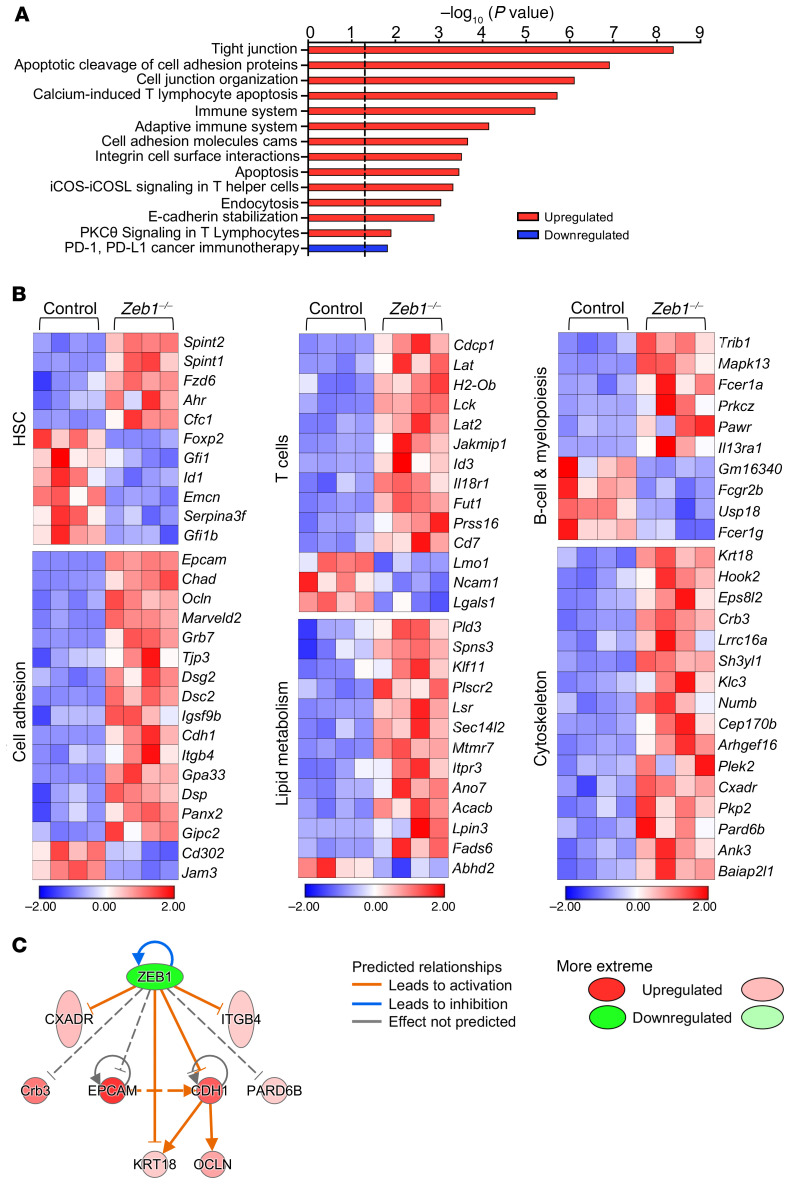
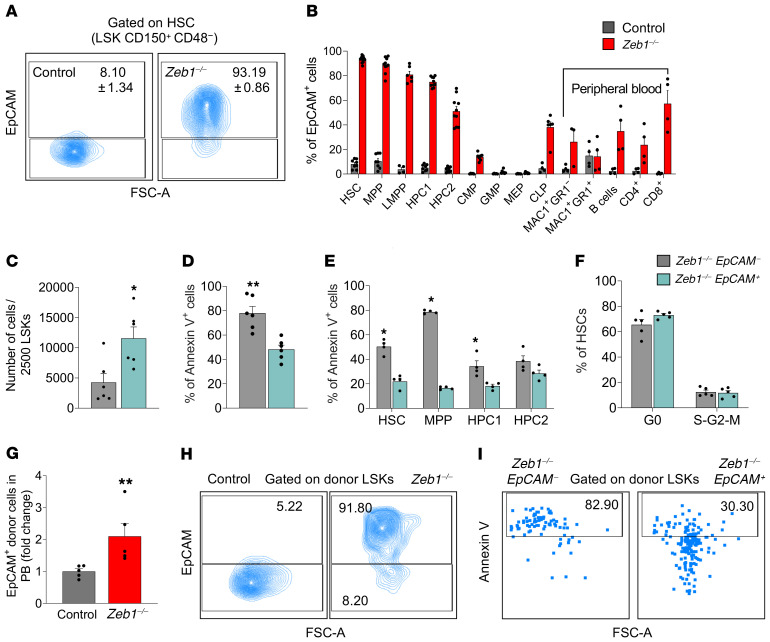
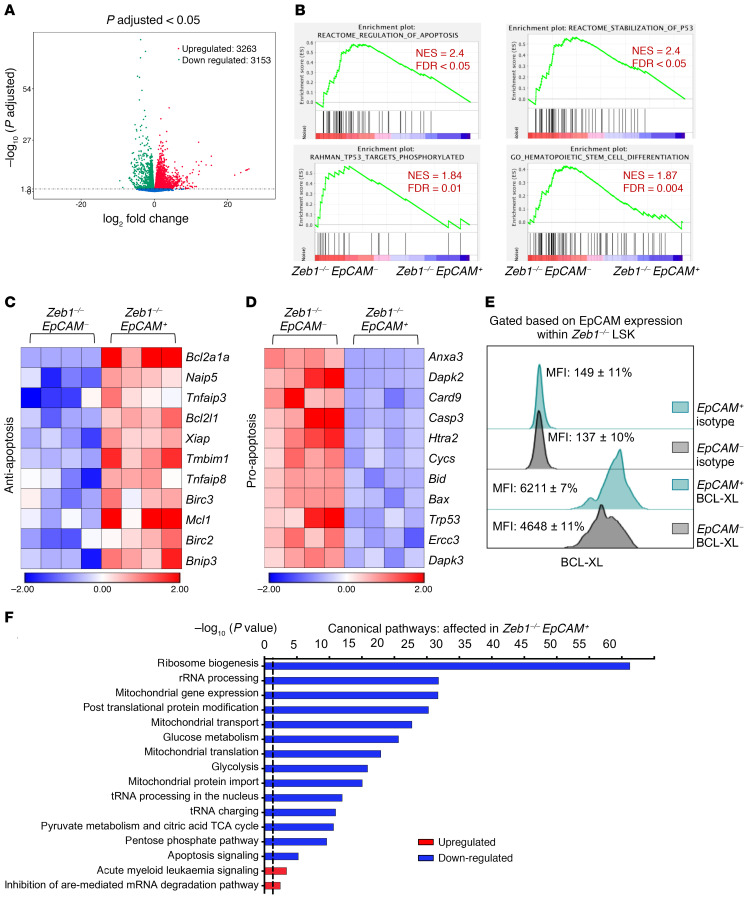
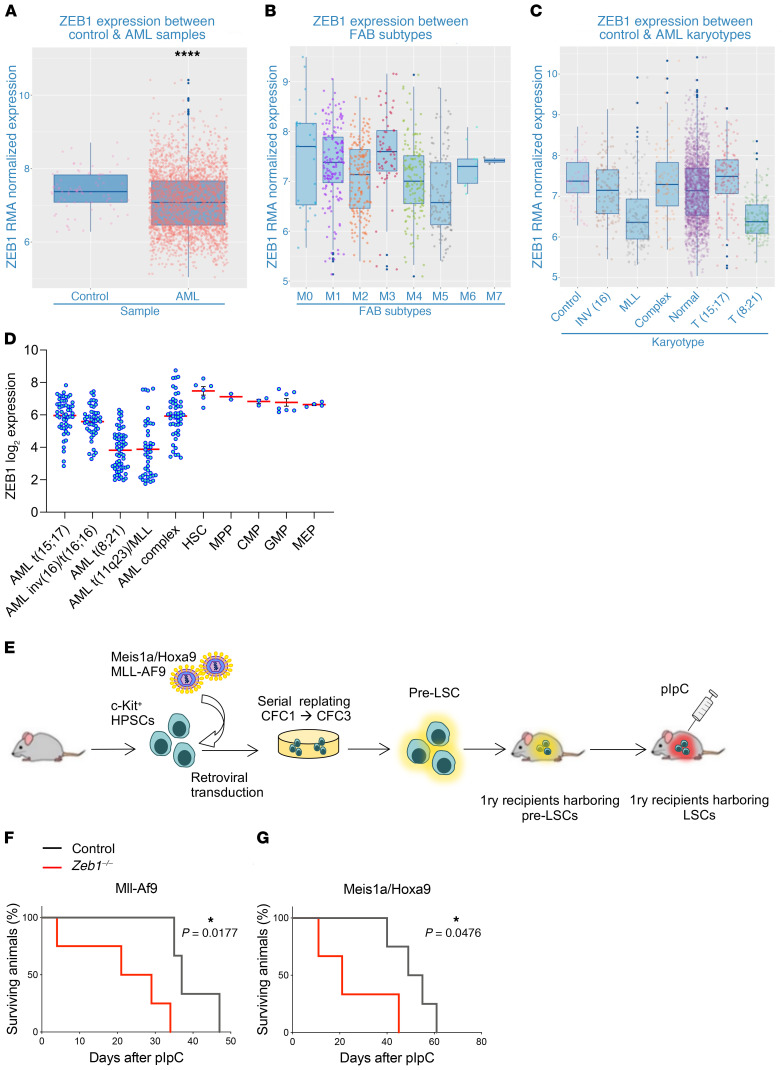
Zeb1, a zinc finger E-box binding homeobox epithelial-mesenchymal transition (EMT) transcription factor, confers properties of "stemness," such as self-renewal, in cancer. Yet little is known about the function of Zeb1 in adult stem cells. Here, we used the hematopoietic system as a well-established paradigm of stem cell biology to evaluate Zeb1-mediated regulation of adult stem cells. We employed a conditional genetic approach using the Mx1-Cre system to specifically knock out (KO) Zeb1 in adult hematopoietic stem cells (HSCs) and their downstream progeny. Acute genetic deletion of Zeb1 led to rapid-onset thymic atrophy and apoptosis-driven loss of thymocytes and T cells. A profound cell-autonomous self-renewal defect and multilineage differentiation block were observed in Zeb1-KO HSCs. Loss of Zeb1 in HSCs activated transcriptional programs of deregulated HSC maintenance and multilineage differentiation genes and of cell polarity consisting of cytoskeleton-, lipid metabolism/lipid membrane-, and cell adhesion-related genes. Notably, epithelial cell adhesion molecule (EpCAM) expression was prodigiously upregulated in Zeb1-KO HSCs, which correlated with enhanced cell survival, diminished mitochondrial metabolism, ribosome biogenesis, and differentiation capacity and an activated transcriptomic signature associated with acute myeloid leukemia (AML) signaling. ZEB1 expression was downregulated in AML patients, and Zeb1 KO in the malignant counterparts of HSCs - leukemic stem cells (LSCs) - accelerated MLL-AF9- and Meis1a/Hoxa9-driven AML progression, implicating Zeb1 as a tumor suppressor in AML LSCs. Thus, Zeb1 acts as a transcriptional regulator in hematopoiesis, critically coordinating HSC self-renewal, apoptotic, and multilineage differentiation fates required to suppress leukemic potential in AML.

Keywords: Bone marrow differentiation; Hematology; Stem cells.


Conflict of interest statement

Conflict of interest: The authors have declared that no conflict of interest exists.

Figures

Figure 1
Figure 1. Loss of Zeb1 affects effector and CM CD8+ T cells.
(A) Q-PCR analysis of mRNA Zeb1 expression in different hematopoietic populations (n = 6–7 except CLP n = 3). (B) Schematic of pIpC treatment to delete Zeb1 in Zeb1fl/fl;Mx1-Cre (control) and Zeb1fl/fl;Mx1-Cre+ (Zeb1–/–) mice and analysis at day 14 after the last pIpC dose. (C) Representative gel electrophoresis analysis confirming Zeb1 deletion in BM cells and LSK population 14 days after the last dose of pIpC. (D) Representative gel electrophoresis analysis of Zeb1 deletion in BM C-KIT+ cells and spleen B (B220+) and T (CD3+) cells 14 days after the last dose of pIpC. (E) Frequency of differentiated cells in PB from control and Zeb1–/– mice 14 days after the last dose of pIpC from 4 independent experiments (n = 8–12 per group). (F) Gating strategy of naive, EM, and CM T cells using CD62L and CD44 markers along with T cell markers CD3, CD4, and CD8 in PB. Frequency of EM T cells (G) and CM T cells (H) within CD3+CD8+ T cells in PB, BM, and SP from control (n = 5 PB and BM, 6 SP) and Zeb1–/– (n = 5 PB and BM, 6–7 SP) mice from 2 independent experiments. Error bars show mean ± SEM. Mann-Whitney U test was used to calculate significance. *P < 0.05.
Figure 2
Figure 2. Loss of Zeb1 results in T cell reduction in thymus associated with early differentiation defects in thymus.
Thymus weight (A), representative photograph (B), and total thymus cellularity (C) from control (n = 9) and Zeb1–/– (n = 8) mice from 5 independent experiments at day 14 after the last pIpC dose. (D) Representative FACS plots of T cell analysis in thymus based on CD4 and CD8 cell-surface markers (DN: CD4CD8, DP: CD4+CD8+, CD4+, CD8+). (E) Frequency of T cell subsets in thymus from control (n = 13) and Zeb1–/– (n = 12) mice from 6 independent experiments at day 14 after the last pIpC dose. (F) Total cell count of T cell subsets in thymus from control (n = 14–15) and Zeb1–/– (n = 14–15) mice from 7 independent experiments at day 14 after the last pIpC dose. (G) Representative FACS plots showing gating strategy of early stages within CD4+CD8+ DN population using CD25 and CD44 (DN1: CD44+CD25, DN2: CD44+CD25+, DN3: CD44CD25+, DN4: CD44CD25) between control and Zeb1–/– at day 14 after the last pIpC dose. (H) Frequency of DN populations (DN1, DN2, DN3, DN4) in DN cells from control (n = 12) and Zeb1–/– (n = 12) mice from 5 independent experiments at day 14 after the last pIpC dose. (I) Total cell count of DN populations in thymus from control (n = 9-13) and Zeb1–/– (n = 11–13) mice from 4 independent experiments at day 14 after the last pIpC dose. (J) Frequency and (K) total count of ETPs (DN1 cKithi) from control (n = 10) and Zeb1–/– (n = 10–11) mice from 4 independent experiments at day 14 after last pIpC dose. Error bars show mean ± SEM. Mann-Whitney U test was used to calculate significance. ***P < 0.001; ****P < 0.0001.
Figure 3
Figure 3. Loss of Zeb1 results in a reduction of lymphoid progenitors in BM and a multilineage hematopoietic differentiation defect after HSC transplantation.
(A) Representative FACS plots of the analysis of LMPP CD127+ (nonconventional LMPP: LSK CD135+CD127+), CLP (LIN SCA-1loC-KITloCD135+CD127+), and LSKCD127+CD135+ 14 days after the last dose of pIpC. (B) Frequency of LMPP CD127+, CLP, and LSKCD 127+CD135+ in the BM from control (n = 8) and Zeb1–/– (n = 10) mice from 4 independent experiments at day 14 after the last pIpC dose. (C) Schematic of competitive HSC transplantation. 150 HSCs from control or Zeb1–/– mice (donor CD45.2) mixed with 2 × 10⁵ BM competitor cells (CD45.1) were transplanted into lethally irradiated recipients (CD45.1), and the mice were monitored by bleeding the tail vein at different time points until week 16. (D) Percentage of donor cells in PB at different time points after HSC transplantation from control (n = 10) and Zeb1–/– (n = 10) mice from 3 independent experiments. Analysis of PB donor contribution to B cells (B220+) (E), MAC1+GR1 myeloid cells (F), MAC1+GR1+ myeloid cells (G), and T cells (CD4+CD8+) (H) from control (n = 10) and Zeb1–/– (n = 8–10) mice from 3 independent experiments. Donor contribution to BM HSPCs (I) (HSC: LSK CD150+CD48, MPP: LSK CD150CD48, HPC1: LSK CD150CD48+, HPC2: LSK CD150+CD48+) from control (n = 9) and Zeb1–/– (n = 9) from 3 independent experiments and BM committed progenitors (J) (CMP: LK CD34+CD16/32, GMP: CD34+CD16/32+, MEP: CD34CD16/32, CLP: LIN SCA-1loC-KITloCD127+, and LSKCD127+ from control (n = 6) and Zeb1–/– (n = 7) from 2 independent experiments. Error bars show mean ± SEM. Mann-Whitney U test was used to calculate significance. *P < 0.05; **P < 0.01; ***P < 0.001; ****P < 0.0001.
Figure 4
Figure 4. Zeb1 regulates HSC self-renewal and differentiation in a cell-autonomous manner.
(A) Schematic of secondary HSC transplantation. 300 CD45.2+ HSCs from primary recipients from control or Zeb1–/– mice mixed with 3 × 10⁵ BM competitor cells (CD45.1) were transplanted into lethally irradiated recipients (CD45.1), and the mice were analyzed at week 12. (B) Percentage of donor cells in PB and donor contribution to myeloid (MAC1+), B (B220+), and T (CD4+/CD8+) cells at week 12 after secondary HSC transplantation from control (n = 7) and Zeb1–/– (n = 5) from 2 independent experiments. (C) Schematic of the secondary total BM transplantation in cell-autonomous manner. 5 × 10⁵ CD45.2+ BM cells from primary recipients 14 days after the last pIpC dose from control or Zeb1–/– mice mixed with 5 × 10⁵ BM competitor cells (CD45.1) were transplanted into lethally irradiated recipients (CD45.1), and the mice were analyzed at week 16. (D) Percentage of donor cells in PB and BM at week 16 after secondary cell autonomous total BM transplantation from control (PB n = 5, BM = 6) and Zeb1–/– (PB n = 7, BM = 6) mice from 1 experiment. (E) Donor contribution to PB MAC1+ myeloid cells, B220+ B cells, and CD4+/CD8+ T cells at week 16 after secondary cell-autonomous total BM transplantation from control (n = 5) and Zeb1–/– (n = 7) mice from 1 experiment. Error bars show mean ± SEM. Mann-Whitney U test was used to calculate significance. *P < 0.05; **P < 0.01.
Figure 5
Figure 5. Zeb1–/– HSCs display deregulation of hematopoietic function and cell polarity transcriptional programming.
RNA-Seq was performed in sorted control and Zeb1–/– HSCs (LSK CD150+CD48) 14 days after last pIpC dose (n = 4 for each genotype). (A) Biological pathway analysis shows the top enriched pathways in Zeb1–/– HSCs compared with control. Data are shown as –log10 (P value), and the dashed black line indicates P value of 0.05. (B) Heatmaps of the DEGs after Zeb1 deletion related to HSC function, T cells, and B cells as well as cytoskeleton, lipid metabolism, and cell adhesion. Heatmap scale represents z score. (C) A network of Zeb1 interaction with several target genes related to polarity, cytoskeleton, and cell adhesion using IPA software. Due to their confirmed binding to ZEB1 in the literature, Epcam, Pard6b, and Crb3 were added manually.
Figure 6
Figure 6. Increased EpCAM expression confers survival advantage and differentiation block in Zeb1–/– HSCs.
(A) Representative flow cytometry plots of EpCAM expression in HSCs 14 days after pIpC injection. (B) Analysis of EpCAM expression in BM subpopulations and PB mature cells 14 days after pIpC injection from control (n = 8 for HSC, MPP, HPC1, and HPC2; n = 4 for LMPP, CLP and mature PB populations; n = 5 for CMP, GMP, and MEP) and Zeb1–/– (n = 10 for HSC, MPP, HPC1, and HPC2; n = 6 for LMPP and CLP; n= 4 for mature PB populations except MAC1+GR1 n = 3; n = 7 for CMP, GMP, and MEP). (C) Cell number after culturing 2500 LSKs from Zeb1–/– EpCAM (n = 6) and Zeb1–/– EpCAM+ (n = 6) from 3 independent experiments. (D) Analysis of apoptosis in LSKs after culture from Zeb1–/– EpCAM (n = 6) and Zeb1–/– EpCAM+ (n = 6) from 3 independent experiments. (E) Analysis of apoptosis in fresh BM HSPCs 14 days after pIpC injection from Zeb1–/– EpCAM (n = 4) and Zeb1–/– EpCAM+ (n = 4) from 2 independent experiments. (F) Cell cycle analysis of HSCs using Ki67 and DAPI 14 days after pIpC injection from Zeb1–/– EpCAM (n = 5) and Zeb1–/– EpCAM+ (n = 5) from 1 experiment. (G) Analysis of EpCAM expression in donor PB at week 16 after primary HSC transplantation from control (n = 5) and Zeb1–/– (n = 5) from 1 experiment represented as fold change. (H) Representative FACS plots of the analysis of EpCAM expression in LSKs 16 weeks after primary HSC transplantation from control (n = 2) and Zeb1–/– (n = 1) from 1 experiment. (I) Representative FACS plots of the analysis of apoptosis using annexin V in EpCAM-negative and -positive fractions within donor LSKs 16 weeks after primary HSC transplantation from control (n = 2) and Zeb1–/– (n = 1) from 1 experiment. Error bars show mean ± SEM. Mann-Whitney U test was used to calculate significance. *P < 0.05; **P < 0.01.
Figure 7
Figure 7. Zeb1–/– EpCAM+ HSPCs display enhanced cell survival and diminished mitochondrial metabolism, RNA biogenesis, and differentiation transcriptional signatures.
(A) Volcano plot showing the relationship between magnitude of gene expression change (log2 of fold-change; x axis) and statistical significance of this change (–log10 of adjusted P value; y axis) in a comparison of Zeb1–/– EpCAM+ to Zeb1–/– EpCAM LSK cells. Colored points represent DEGs (cutoff FDR < 0.05) that are either overexpressed (red) or underexpressed (green) in Zeb1–/– EpCAM+ compared with Zeb1–/– EpCAM. (B) GSEA plots of regulation of apoptosis, stabilization of P53, TP53 targets phosphorylated, and HSC differentiation. Heatmaps of the DEGs within EpCAM+ and EpCAM LSK after Zeb1 deletion related to antiapoptosis (C) and proapoptosis (D). (E) Representative histogram of BCL-XL levels in EpCAM fractions within Zeb1–/– LSK. (F) Canonical pathways that were mostly enriched in Zeb1–/– EpCAM+ LSK cells derived from the IPA, BioCarta, KEGG, PID, and Reactome pathway databases. Data are shown as –log10 (P value), and the dashed black line indicates P value of 0.05. Analysis was performed using the GSEA software and IPA.
Figure 8
Figure 8. Zeb1 is downregulated in AML patient samples and acts as a tumor suppressor in MLL-AF9 and Meis1a/Hoxa9-driven AML.
(AC) ZEB1 RMA–normalized expression from combined published data sets in (A) control and AML, (B) across FAB subtypes and, (C) karyotypes. (D) ZEB1 log2 expression data in human HSPC and AML karyotypes. Data from BloodSpot. Error bars show mean ± SEM. Student’s t test was used unless otherwise indicated. ****P < 0.0001. (E) C-KIT+ cells from control and Zeb1fl/fl;Mx1-Cre+ mice were transduced with retroviruses expressing MLL-AF9 or Meis1a/Hoxa9 oncogenes and plated into CFC assays. After CFC3 (6 days each CFC), pre-LSCs (CD45.2+C-KIT+) were sorted and transplanted into lethally irradiated recipients together with CD45.1+ unfractionated BM cells. Three weeks later, mice were administered pIpC to induce gene deletion and monitored for AML development. (F and G) Kaplan-Meier survival curve of primary recipients transplanted with (F) MLL-AF9 (n = 4) or (G) Meis1a/Hoxa9 (n = 4) pre-LSCs. Mantel-Cox test. *P < 0.05.

References

    1. Nieto MA, Huang RY, Jackson RA, Thiery JP. EMT: 2016. Cell. 2016;166(1):21–45. doi: 10.1016/j.cell.2016.06.028. - DOI - PubMed
    1. Kalluri R, Weinberg RA. The basics of epithelial-mesenchymal transition. J Clin Invest. 2009;119(6):1420–1428. doi: 10.1172/JCI39104. - DOI - PMC - PubMed
    1. Postigo AA, Dean DC. ZEB, a vertebrate homolog of Drosophila Zfh-1, is a negative regulator of muscle differentiation. EMBO J. 1997;16(13):3935–3943. doi: 10.1093/emboj/16.13.3935. - DOI - PMC - PubMed
    1. Postigo AA, Ward E, Skeath JB, Dean DC. zfh-1, the Drosophila homologue of ZEB, is a transcriptional repressor that regulates somatic myogenesis. Mol Cell Biol. 1999;19(10):7255–7263. doi: 10.1128/MCB.19.10.7255. - DOI - PMC - PubMed
    1. Jethanandani P, Kramer RH. Alpha7 integrin expression is negatively regulated by deltaEF1 during skeletal myogenesis. J Biol Chem. 2005;280(43):36037–36046. doi: 10.1074/jbc.M508698200. - DOI - PubMed

Publication types

MeSH terms

Substances