. 2021 Jan 4;131(1):e139807.
doi: 10.1172/JCI139807.

Humanized neurofibroma model from induced pluripotent stem cells delineates tumor pathogenesis and developmental origins

Affiliations

Humanized neurofibroma model from induced pluripotent stem cells delineates tumor pathogenesis and developmental origins

Juan Mo et al. J Clin Invest. .

Erratum in

Abstract

Neurofibromatosis type 1 (NF1) is a common tumor predisposition syndrome caused by NF1 gene mutation, in which affected patients develop Schwann cell lineage peripheral nerve sheath tumors (neurofibromas). To investigate human neurofibroma pathogenesis, we differentiated a series of isogenic, patient-specific NF1-mutant human induced pluripotent stem cells (hiPSCs) into Schwannian lineage cells (SLCs). We found that, although WT and heterozygous NF1-mutant hiPSCs-SLCs did not form tumors following mouse sciatic nerve implantation, NF1-null SLCs formed bona fide neurofibromas with high levels of SOX10 expression. To confirm that SOX10+ SLCs contained the cells of origin for neurofibromas, both Nf1 alleles were inactivated in mouse Sox10+ cells, leading to classic nodular cutaneous and plexiform neurofibroma formation that completely recapitulated their human counterparts. Moreover, we discovered that NF1 loss impaired Schwann cell differentiation by inducing a persistent stem-like state to expand the pool of progenitors required to initiate tumor formation, indicating that, in addition to regulating MAPK-mediated cell growth, NF1 loss also altered Schwann cell differentiation to promote neurofibroma development. Taken together, we established a complementary humanized neurofibroma explant and, to our knowledge, first-in-kind genetically engineered nodular cutaneous neurofibroma mouse models that delineate neurofibroma pathogenesis amenable to future therapeutic target discovery and evaluation.

Keywords: Neurological disorders; Neuroscience; Oncology; Tumor suppressors.


Conflict of interest statement

Conflict of interest: The authors have declared that no conflict of interest exists.

Figures

Figure 1
Figure 1. Differentiation of hiPSCs to SCPs.
(A) Pluripotency of isogenic NF1+/+, NF1+/–, and NF1–/– hiPSCs was confirmed by expression of NANOG, Oct3/4, SOX2, and TRA1-60. (B) Differentiation of isogenic hiPSCs into SCPs was confirmed by negative staining for Oct3/4 on day 6 and positive staining for p75, SOX10, and HOXb7 on day 10. Yellow arrows depict the colocalization of SOX10 and HOXb7 in hiPSC-SCPs. (C) Differentiation of isogenic hiPSCs into SCPs was confirmed by positive staining for GAP43 and nestin on day 10 and for SOX10 and AP2a on day 20, respectively. The morphology was distinct from that of original hiPSCs 10 days after differentiation. BF, bright-field. Scale bar: 50 μm.
Figure 2
Figure 2. NF1 loss impairs Schwann cell differentiation by maintaining stemness.
(AC) Flow cytometry was performed to measure the percentage of p75+ cells after differentiation. (D) mRNA levels for SCP markers including MPZ, CDH19, PLP, SOX10, and ITGA4 were compared in NF1+/+, NF1+/–, and NF1–/– hiPSC-SCPs. (EG) hiPSCs were grown in SCP-DM for 4 days, followed by suspension culture for an extra 6–14 days. Neurosphere numbers were counted (E), and the average (Ave.) diameters were calculated (F) (n = 15–27/group). Comparisons among groups were performed by 1-way ANOVA. (G) Frequencies of isogenic hiPSC-SCPs were assessed as the percentage of cells that formed neurospheres. Comparisons among groups were performed by 1-way ANOVA. (H) Expression of neurofibromin, p-ERK (Thr202/Thr204), t-ERK, GAP43, SOX10, and p53 as determined by Western blotting in NF1+/– and NF1–/– hiPSC-SCPs, with GAPDH used as an internal loading control. (I) Protein expression of neurofibromin, nestin, p-ERK, t-ERK, p-S6 (Ser240/244), t-S6, GAP43, SOX10, and p53 was measured by Western blotting in adeno-GFP virus–infected and adeno-Cre virus–infected E13.5 Nf1fl/fl DNSCs. (J) mRNA levels of stem cell markers (Ednrb, Lgr5, Sox2, Ccnd2, Cd133, Igf2bp2, Lif, Olfm4, and Hopx) and Schwann cell markers (MPZ, Ngfr, ErbB3, p75, Sox10, Dhh, S100β, and Krox20) were compared between GFP adenovirus–infected and Cre adenovirus–infected E13.5 Nf1fl/fl DNSCs. For the box-and-whisker plots in D, F, G and J, the plots show the median (line) and lower and upper quartiles (box), and the ends of the whiskers represent the lowest and highest values. Comparisons among groups were performed by 1-way ANOVA. D0, day 0; D10, day 10.
Figure 3
Figure 3. NF1–/– hiPSC-SCPs give rise to pNFs.
(A) The non–tumor-bearing left sciatic nerve (SN) injected with NF1+/– hiPSC-SCPs and the neurofibroma-bearing right sciatic nerve injected with NF1–/– hiPSC-SCPs were fully characterized by H&E staining as well as immunostaining with the human-specific Ku80, GAP43, S100β, SOX10, HOXb7, p-ERK, p-s6, and Iba1 antibodies. Yellow arrows show the colocalization of GAP43+ and Ku80+ cells. Green arrows show GAP43+Ku80 cells. Black arrow shows the Meissner-like corpuscle in the neurofibroma. n = 5. (B) Characterization of human pNF tissue by H&E staining and immunostaining for GAP43, S100β, SOX10, HOXb7, and nestin. SN, sciatic nerve. Scale bars: 50 μm and 25 μm (inset in A).
Figure 4
Figure 4. The nerve microenvironment promotes NCSC differentiation into SLCs and the formation of neurofibromas.
(AC) After differentiation, hiPSC-NCSCs were immunonegative for Oct3/4 on day 4, immunopositive for p75 on days 4, 8, and 20, and immunopositive for HNK1 on day 20. (D) hiPSC-NCSCs were subdermally injected into athymic mice. Formation of cartilage derived from injected Ku80+ cells was observed under the skin following NF1–/– hiPSC-NCSC implantation, but not in the left sciatic nerve after NF1+/+ hiPSC-NCSC implantation. n = 3. (E) hiPSC-NCSCs were injected into the sciatic nerves of athymic mice. Formation of cartilage and tumors with neurofibroma histological and molecular characteristics was observed in the right sciatic nerves following implantation of NF1–/– hiPSC-NCSCs. Colocalization of Ku80 and GAP43 was observed. The left sciatic nerve injected with NF1+/+ hiPSC-NCSCs was immunopositive for Ku80 but still well-organized, without histological features of neurofibroma. n = 3. White arrow points to tumor in the right sciatic nerve. Scale bars: 50 μm and 10 μm (inset in E).
Figure 5
Figure 5. Differentiation into SCPs of hiPSCs with loss of NF1 and TP53.
(A and B) TP53 loss was genetically engineered using CRISPR/Cas9 in NF1–/– hiPSCs. Expression of neurofibromin, Cas9, and TP53 was measured by Western blotting. GAPDH was used as an internal loading control. (C) qPCR was performed to measure mRNA levels of TP53 and p21 in NF1–/– sgTP53 hiPSCs. (D) After editing and single-cell clone selection, NF1–/– sgTP53 hiPSCs retained their pluripotency, as verified by the expression of pluripotent markers (NANOG, SOX2, and Oct3/4). However, the SCP marker SOX10 was negative. Differentiation of NF1–/– sgTP53 hiPSCs into SCPs was confirmed by fluorescence staining using SCP markers (SOX10, AP2a, p75, GAP43, and nestin). Scale bar: 50 μm. (E) mRNA levels of the indicated SCP markers were measured. (F) Cell proliferation was compared between NF1–/– sgScr hiPSC-SCPs and NF1–/– sgTP53 hiPSC-SCPs using the CellTiter-Glo assay. Comparisons between groups were performed by 2-way ANOVA. Lum, luminescence. (G and H) mRNA levels of the indicated SCP markers (G) and stem cell markers (H) were compared between NF1–/– sgScr hiPSC-SCPs and NF1–/– sgTP53 hiPSC-SCPs.
Figure 6
Figure 6. Loss of NF1 and TP53 in hiPSC-SCPs drives MPNST development.
After implantation of NF1–/– sgTP53 hiPSC-SCPs into the right sciatic nerve, MPNSTs were observed and characterized by H&E staining and expression of S100β, SOX10, GAP43, Ki67, Ku80, and p-H3. The inset shows the colocalization of GAP43+ and Ku80+ cells. The left sciatic nerve injected with medium served as a control. n = 3. Scale bars: 50 μm and 25 μm (inset).
Figure 7
Figure 7. SOX10-expressing cells contain proliferating tumorigenic cells for pNF.
(A) Sox10-CreERT2 Nf1fl/fl mice treated with tamoxifen demonstrated neurofibroma formation, characterized by abnormally enlarged DRGs, as well as hypercellular and disorganized DRGs. The pNF was positive for S100β, GAP43, and SOX10 expression, with infiltration of mast cells. (B) A representative Sox10-CreERT2 Nf1fl/fl mouse treated with tamoxifen developed classic giant, diffuse pNFs (white arrow) with hyperpigmentation and thickening of the skin, which was positive for S100β, GAP43, and SOX10 expression, with mast cell infiltration. n = 43. Scale bars: 50 μm.
Figure 8
Figure 8. SOX10-expressing cells contain proliferating tumorigenic cells for cNF.
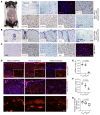
(A) Sox10-CreERT2 Nf1fl/fl mice gradually developed discrete cNFs (white arrow), characterized by increased skin thickness, positive staining for SOX10, S100β, GAP43, and Iba1, with mast cell infiltration. (B) The area distant from the tumor sites of discrete cNFs was characterized by S100β, GAP43, and Iba1 expression and toluidine blue staining. (C) Tissue from a patient with cNF was positive for S100β, GAP43, Iba1, and SOX10. n = 38. (D) Cutaneous NF tumors from Sox10-CreERT2 Nf1fl/fl R26-tdTomato mice before MEK inhibitor treatment (B.T.), after treatment with vehicle, and after treatment with the MEK inhibitor PD901 were harvested and stained for p-ERK, t-ERK (insets), and SOX10. n = 3 per treatment group. (E) Quantification of p-ERK+ cells. Comparisons among groups were performed by 1-way ANOVA. (F) Quantification of SOX10+ cells. Comparisons among groups were performed by 1-way ANOVA. (G) Quantification of tdTomato red intensity. n = 7–9/group. Comparisons among groups were performed by 1-way ANOVA. For the box-and-whisker plots in E, F, and G, the plots show the median (line) and lower and upper quartiles (box), and the ends of the whiskers represent the lowest and highest values. Scale bars: 50 μm and 25 μm (insets in D).

References

    1. Zhu Y, Ghosh P, Charnay P, Burns DK, Parada LF. Neurofibromas in NF1: Schwann cell origin and role of tumor environment. Science. 2002;296(5569):920–922. doi: 10.1126/science.1068452. - DOI - PMC - PubMed
    1. Zheng H, et al. Induction of abnormal proliferation by nonmyelinating schwann cells triggers neurofibroma formation. Cancer Cell. 2008;13(2):117–128. doi: 10.1016/j.ccr.2008.01.002. - DOI - PubMed
    1. Wu J, et al. Plexiform and dermal neurofibromas and pigmentation are caused by Nf1 loss in desert hedgehog-expressing cells. Cancer Cell. 2008;13(2):105–116. doi: 10.1016/j.ccr.2007.12.027. - DOI - PMC - PubMed
    1. Chen Z, Liu C, Patel AJ, Liao CP, Wang Y, Le LQ. Cells of origin in the embryonic nerve roots for NF1-associated plexiform neurofibroma. Cancer Cell. 2014;26(5):695–706. doi: 10.1016/j.ccell.2014.09.009. - DOI - PMC - PubMed
    1. Mayes DA, et al. Perinatal or adult Nf1 inactivation using tamoxifen-inducible PlpCre each cause neurofibroma formation. Cancer Res. 2011;71(13):4675–4685. doi: 10.1158/0008-5472.CAN-10-4558. - DOI - PMC - PubMed

Publication types