. 2020 Oct 27;4(20):5285-5296.
doi: 10.1182/bloodadvances.2020002206.

Oligomonocytic and overt chronic myelomonocytic leukemia show similar clinical, genomic, and immunophenotypic features

Affiliations

Oligomonocytic and overt chronic myelomonocytic leukemia show similar clinical, genomic, and immunophenotypic features

Xavier Calvo et al. Blood Adv. .

Abstract

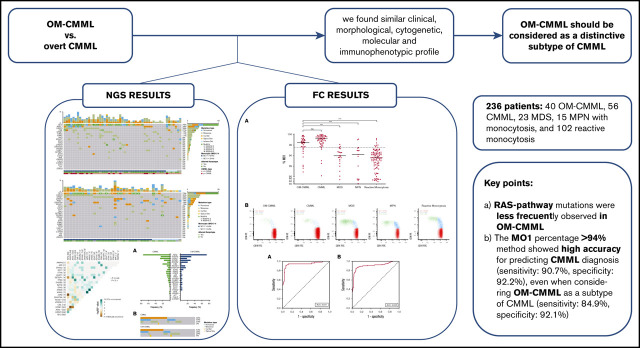
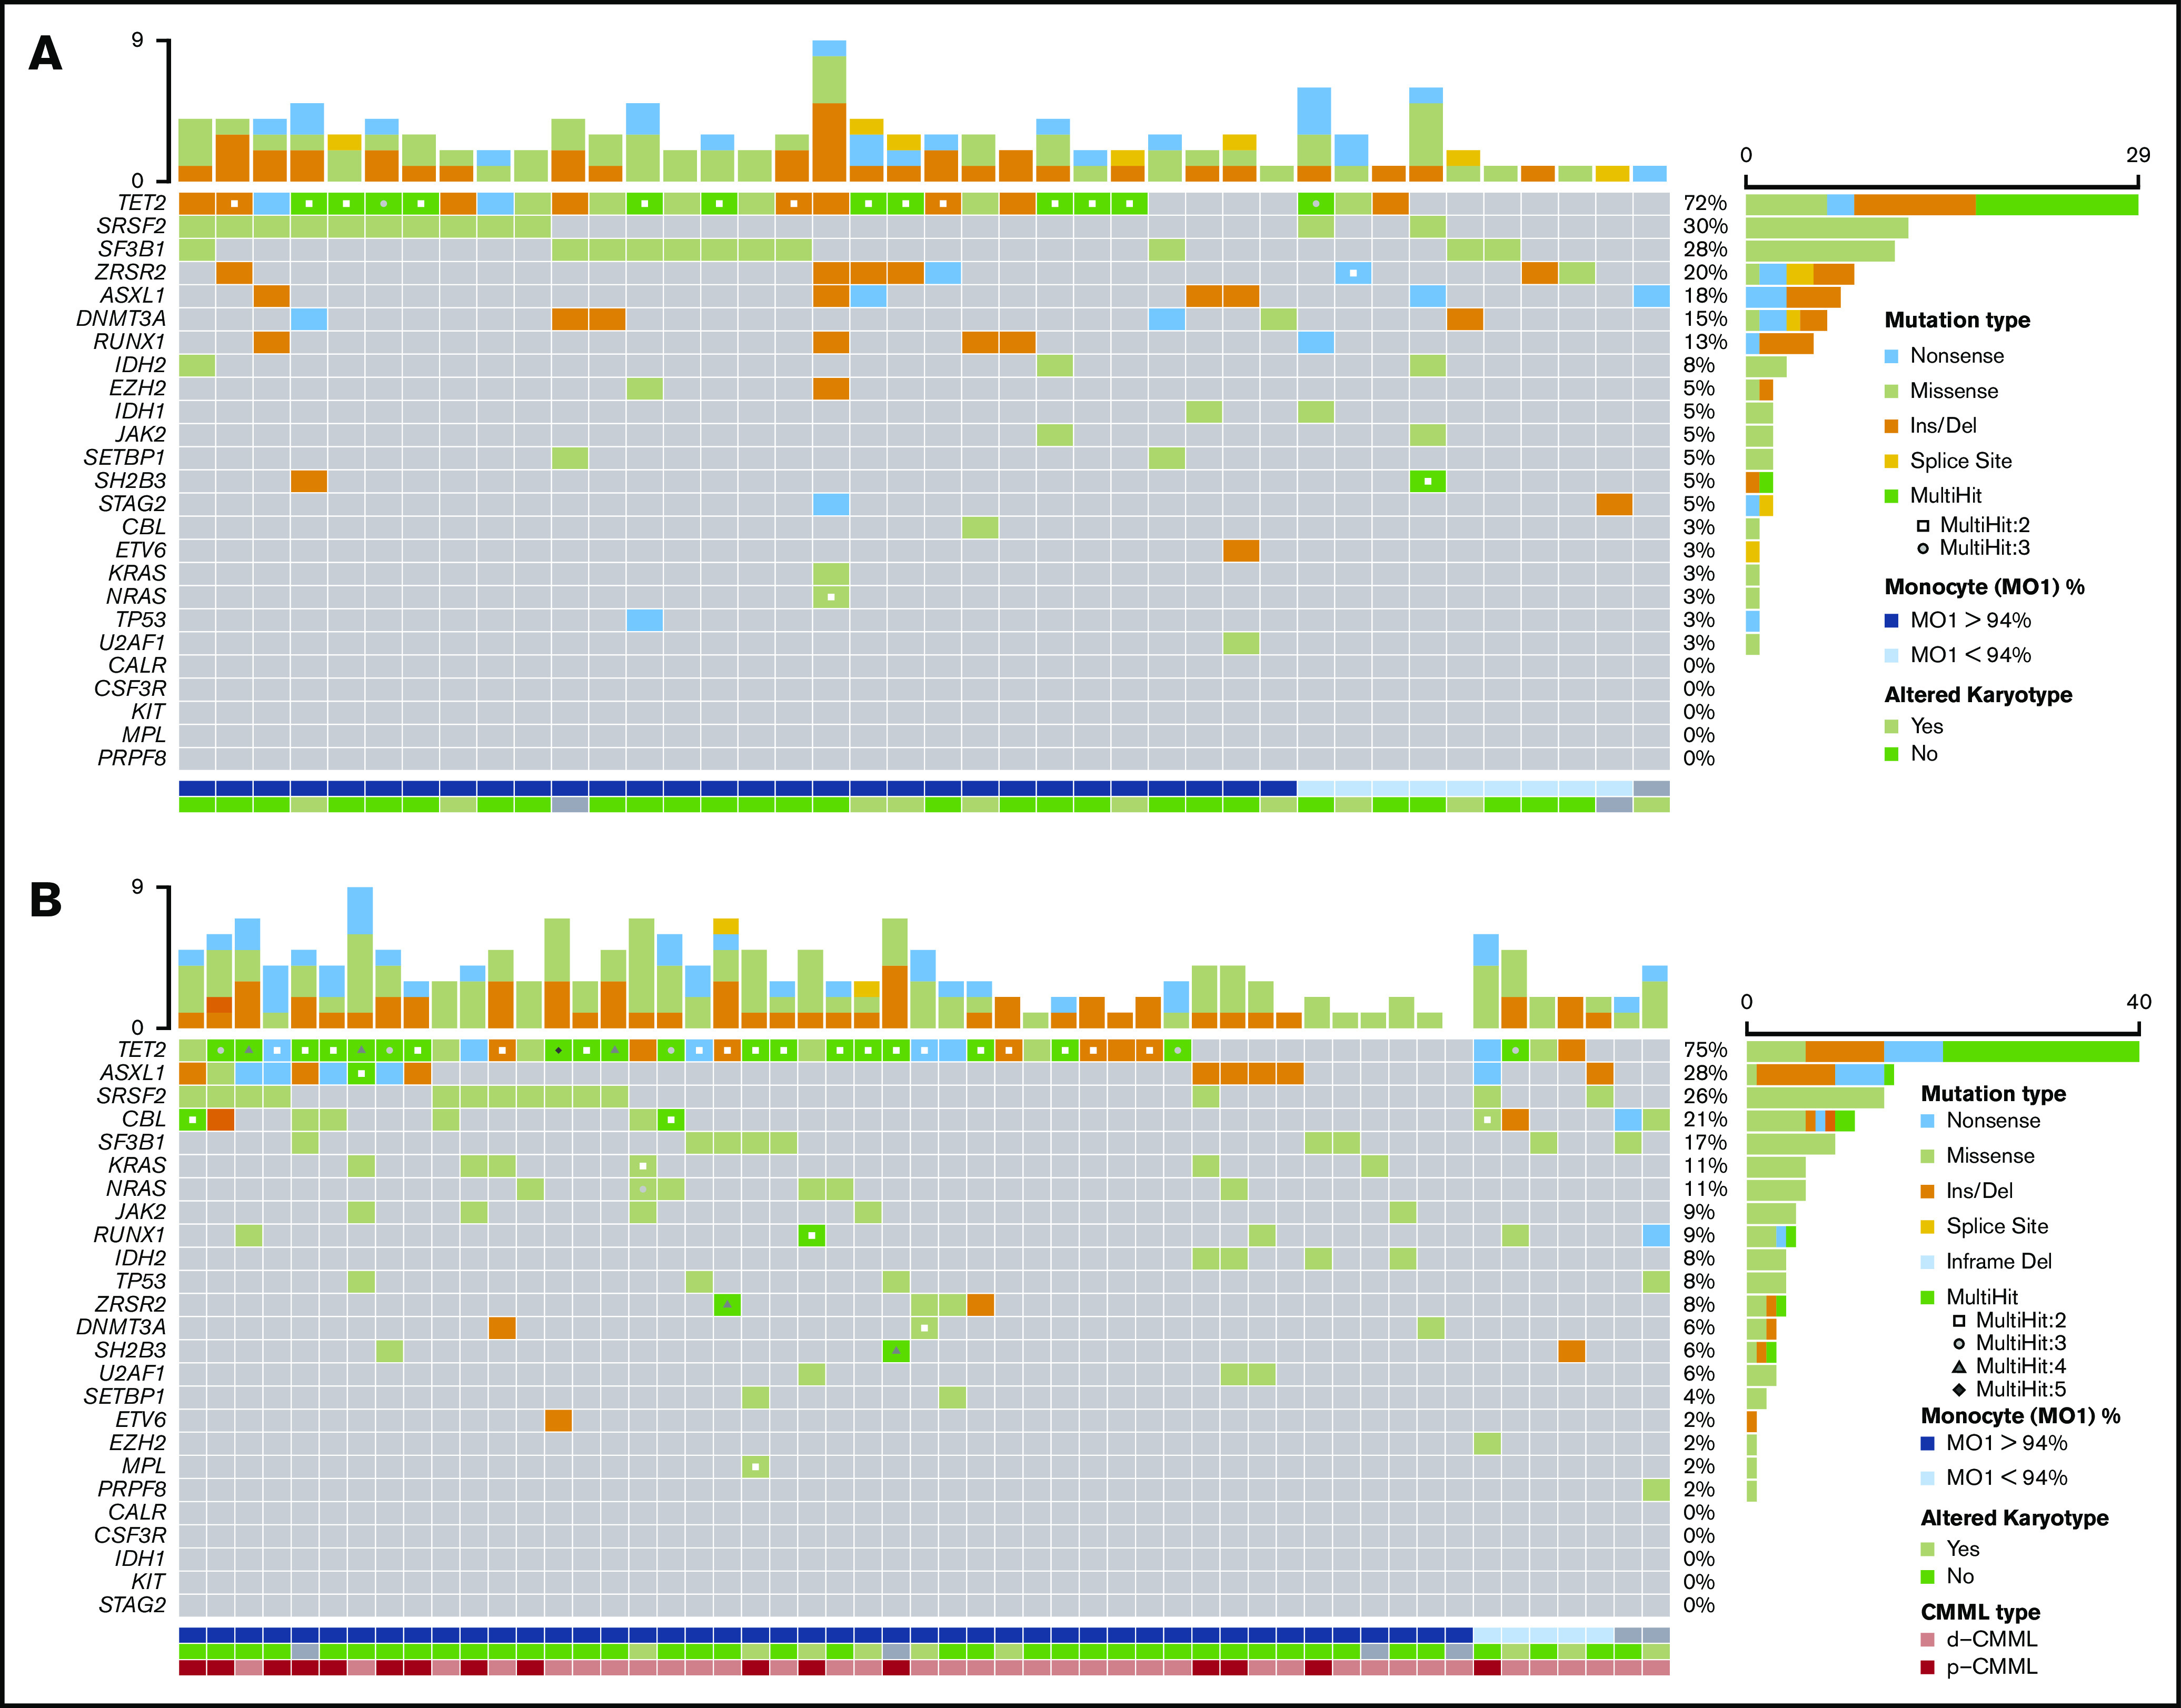
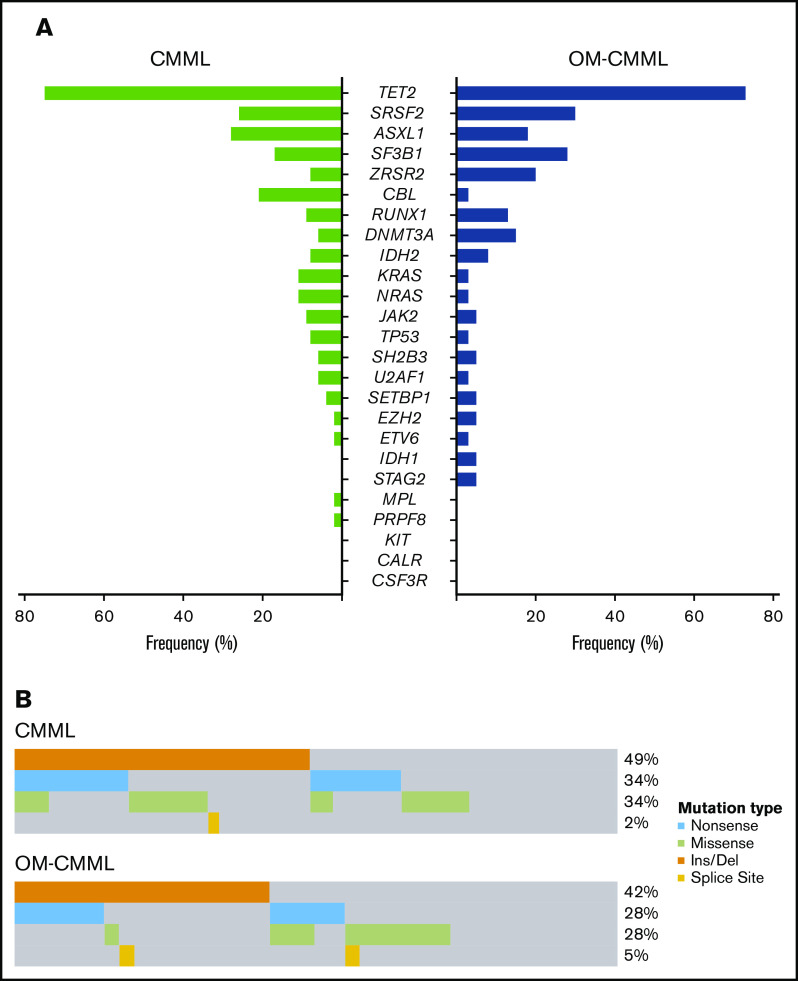
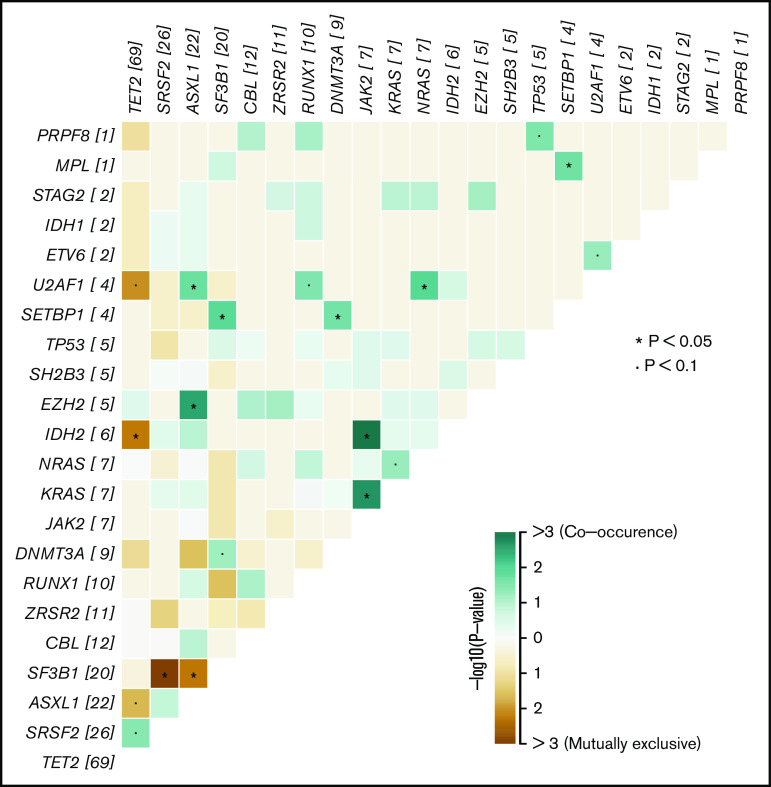
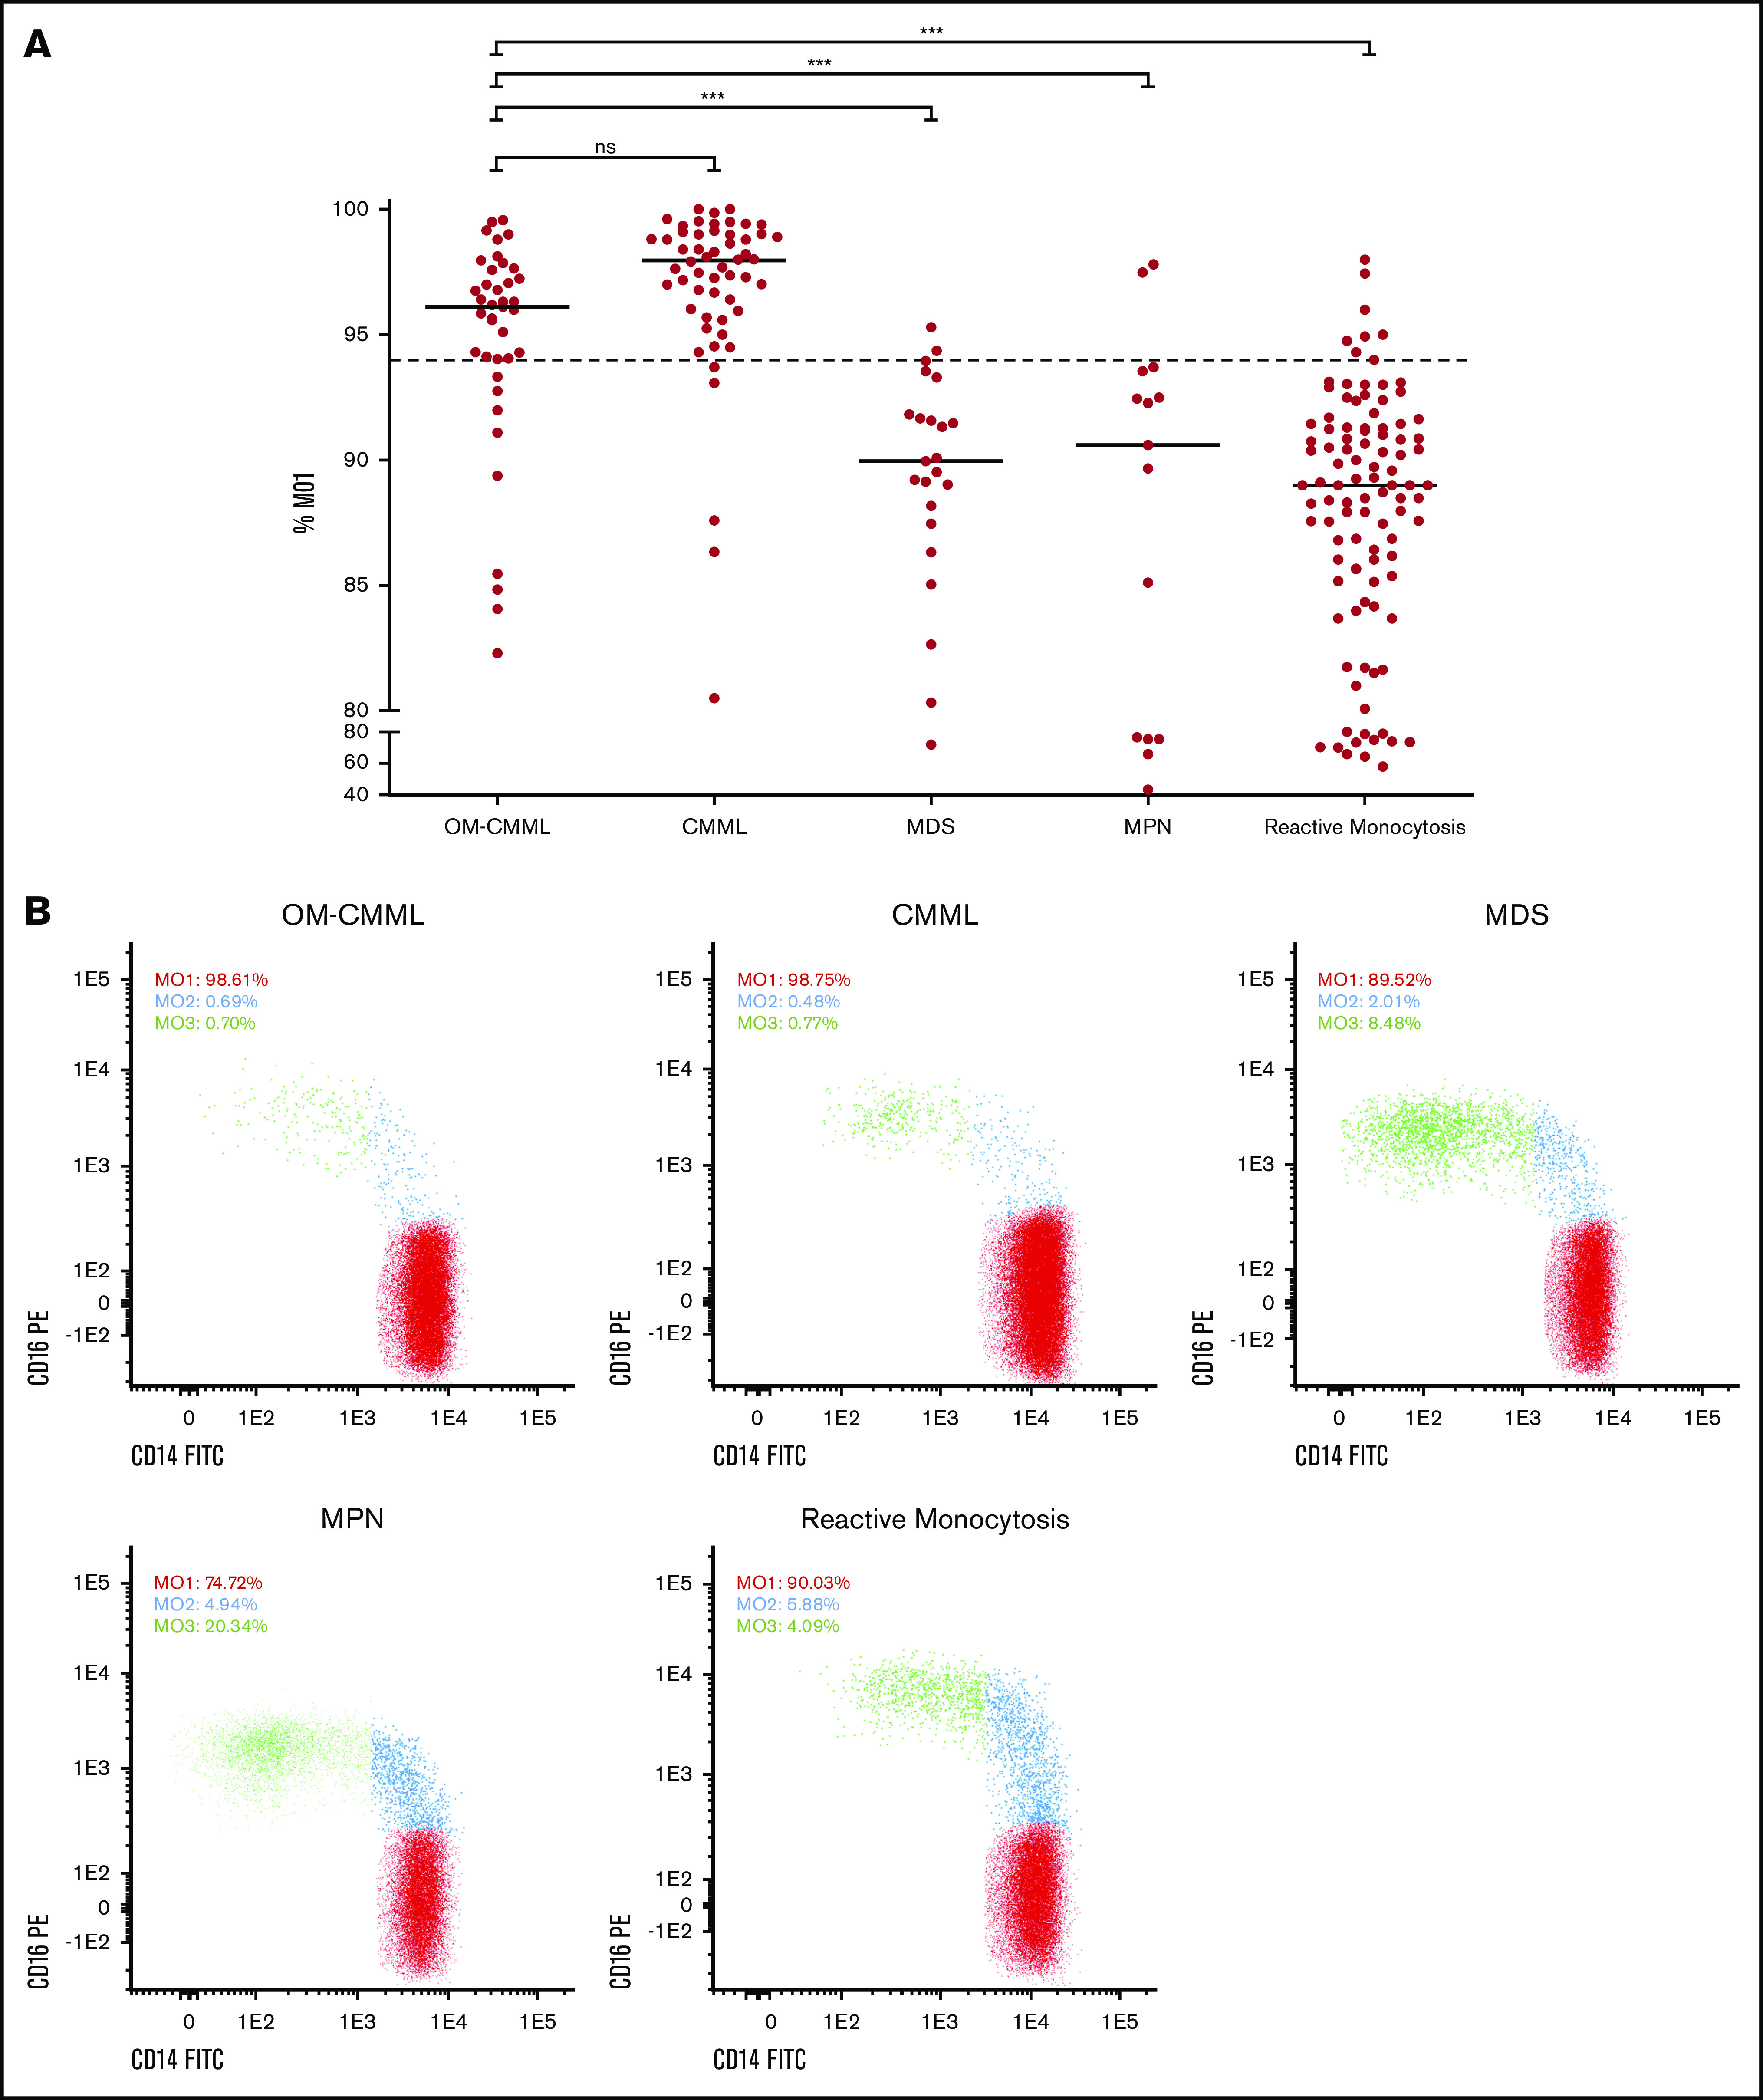
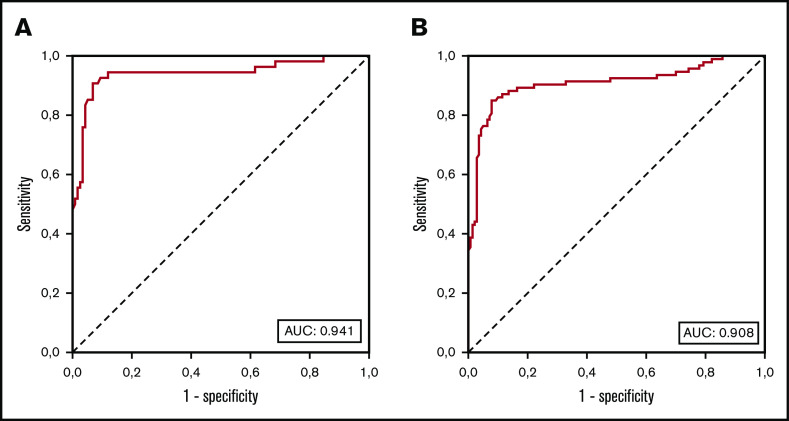
Oligomonocytic chronic myelomonocytic leukemia (OM-CMML) is defined as those myelodysplastic syndromes (MDSs) or myelodysplastic/myeloproliferative neoplasms, unclassifiable with relative monocytosis (≥10% monocytes) and a monocyte count of 0.5 to <1 × 10⁹/L. These patients show clinical and genomic features similar to those of overt chronic myelomonocytic leukemia (CMML), although most of them are currently categorized as MDS, according to the World Health Organization 2017 classification. We analyzed the clinicopathologic features of 40 patients with OM-CMML with well-annotated immunophenotypic and molecular data and compared them to those of 56 patients with overt CMML. We found similar clinical, morphological, and cytogenetic features. In addition, OM-CMML mirrored the well-known complex molecular profile of CMML, except for the presence of a lower percentage of RAS pathway mutations. In this regard, of the different genes assessed, only CBL was found to be mutated at a significantly lower frequency. Likewise, the OM-CMML immunophenotypic profile, assessed by the presence of >94% classical monocytes (MO1s) and CD56 and/or CD2 positivity in peripheral blood monocytes, was similar to overt CMML. The MO1 percentage >94% method showed high accuracy for predicting CMML diagnosis (sensitivity, 90.7%; specificity, 92.2%), even when considering OM-CMML as a subtype of CMML (sensitivity, 84.9%; specificity, 92.1%) in our series of 233 patients (39 OM-CMML, 54 CMML, 23 MDS, and 15 myeloproliferative neoplasms with monocytosis and 102 reactive monocytosis). These results support the consideration of OM-CMML as a distinctive subtype of CMML.


Conflict of interest statement

Conflict-of-interest disclosure: The authors declare no competing financial interests.

Figures

None
Graphical abstract
Figure 1.
Figure 1.
Mutational profile in patients with OM-CMML and CMML. Mutations were identified by NGS in 40 patients with OM-CMML (A) and in 53 patients with CMML (B). Results of the sequencing of the 25 genes are shown in the plot, where each column represents a patient and each row represents a gene. The number of mutations identified per patient is represented as columns in the top row. Genes are ordered from the most to the least frequently mutated, and frequencies for each gene are displayed (right), as well as the mutation type (nonsense, missense, insertion/deletion, splice site, or multihit). Patients with more than 1 mutation in the same gene are represented as shown in the key (2, 3, 4, or 5 mutations in the same gene). The immunophenotypic profile, assessed by the presence of MO1s upper 94%, is shown (bottom; MO1 >94%, blue, MO1 ≤94%, light blue, nonanalyzed, gray). Cytogenetic results are also displayed (bottom row; altered karyotype, lime green; normal karyotype, light green; nonanalyzed, gray). CMML types are also shown (bottom row: d-CMML, light red; p-CMML, red).
Figure 2.
Figure 2.
Distribution of mutated genes in CMML and OM-CMML. (A) Frequencies of the 25 genes analyzed by NGS in the CMML and OM-CMML groups. Genes are ordered from the most to the least frequently mutated, combining the CMML and OM-CMML cases. CBL was the only gene mutated at a significantly different frequency in the groups (2.5% vs 20.8%; OM-CMML vs CMML; P = .011). (B) The plot represents all the mutations identified in the TET2 gene classified by the type of alteration, with insertions or deletions of nucleotides (orange) being the most frequent mutations identified. Nonsense mutations, producing a stop codon in the sequence (light blue), and missense mutations, producing a change in 1 amino acid (lime green), were the second most commonly identified. The least common alterations in our cohort were splice site mutations (yellow). No significant differences were observed in the distribution of mutations in TET2 when both disease groups were compared.
Figure 3.
Figure 3.
Co-occurrence or mutual exclusivity of genes in both OM-CMML and CMML. The plot shows, for the whole group of OM-CMML and CMML, all genes found to be altered in our cohort ordered by the number of mutations identified. In those genes that were frequently found to be comutated in the same patient, the interactions are depicted in lime green. In genes that were observed to be mutually exclusive and thus not frequently altered in the same patient, the interactions are depicted in brown. *P < .05; P < .1.
Figure 4.
Figure 4.
Percentage of MO1s in the 233 cases grouped by disease. (A) Flow cytometry results are shown as the percentage of MO1 identified for the 5 groups analyzed (39 OM-CMML, 54 CMML, and 23 MDS that did not meet OM-CMML diagnostic criteria; 15 MPN with ≥1 × 10⁹/L monocytes, and 102 reactive monocytosis). Each dot represents a patient result for the MO1 test, and lines represent the median percentage for each disease group. The dotted line indicates the 94% cutoff of the test. ***P < .001. (B) The distribution of monocyte subsets is shown for 5 examples, each one from a different disease group. The percentage of the 3 monocyte subsets (MO1, MO2, and MO3) out of the total monocytes is displayed for each example. ns, not significant.
Figure 5.
Figure 5.
ROC AUC curves of the percentage of MO1s in our series. (A) ROC curve analysis of diagnostic sensitivity and specificity of the MO1 percentage in 171 patients with ≥1 × 10⁹/L PB monocytes (54 CMML, 15 MPN with monocytosis, and 102 with reactive monocytosis). (B) ROC curve analysis of diagnostic sensitivity and specificity of the MO1 percentage in PB monocytes of 233 patients (93 recoded CMML, including 39 OM-CMML and 54 overt CMML; 23 MDS not meeting OM-CMML diagnostic criteria; 15 MPN with monocytosis; and 102 with reactive monocytosis).

References

    1. Swerdlow SH, Campo E, Harris NL, et al. . WHO classification of tumours of haematopoietic and lymphoid tissues 4th ed, revised Lyon, France: International Agency for Research on Cancer, WHO; 2017.
    1. Arber DA, Orazi A, Hasserjian R, et al. . The 2016 revision to the World Health Organization classification of myeloid neoplasms and acute leukemia. Blood. 2016;127(20):2391-2405. - PubMed
    1. Valent P, Orazi A, Savona MR, et al. . Proposed diagnostic criteria for classical chronic myelomonocytic leukemia (CMML), CMML variants and pre-CMML conditions. Haematologica. 2019;104(10):1935-1949. - PMC - PubMed
    1. Meggendorfer M, Haferlach T, Alpermann T, et al. . Specific molecular mutation patterns delineate chronic neutrophilic leukemia, atypical chronic myeloid leukemia, and chronic myelomonocytic leukemia. Haematologica. 2014;99(12):e244-e246. - PMC - PubMed
    1. Itzykson R, Kosmider O, Renneville A, et al. . Prognostic score including gene mutations in chronic myelomonocytic leukemia. J Clin Oncol. 2013;31(19):2428-2436. - PubMed

Publication types

MeSH terms