. 2020 Nov 10;16(11):6795-6813.
doi: 10.1021/acs.jctc.0c00676. Epub 2020 Oct 27.

An Information-Theory-Based Approach for Optimal Model Reduction of Biomolecules

Affiliations

An Information-Theory-Based Approach for Optimal Model Reduction of Biomolecules

Marco Giulini et al. J Chem Theory Comput. .

Abstract

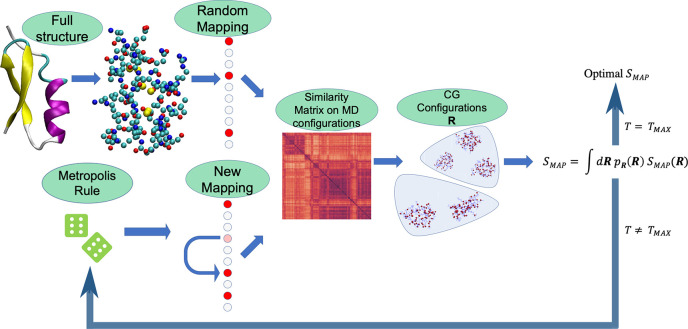
In theoretical modeling of a physical system, a crucial step consists of the identification of those degrees of freedom that enable a synthetic yet informative representation of it. While in some cases this selection can be carried out on the basis of intuition and experience, straightforward discrimination of the important features from the negligible ones is difficult for many complex systems, most notably heteropolymers and large biomolecules. We here present a thermodynamics-based theoretical framework to gauge the effectiveness of a given simplified representation by measuring its information content. We employ this method to identify those reduced descriptions of proteins, in terms of a subset of their atoms, that retain the largest amount of information from the original model; we show that these highly informative representations share common features that are intrinsically related to the biological properties of the proteins under examination, thereby establishing a bridge between protein structure, energetics, and function.


Conflict of interest statement

The authors declare no competing financial interest.

Figures

Figure 1
Figure 1
Distributions of the values of the mapping entropy Σ [in kJ mol–1 K–1] in eq 17 for random mappings (light-blue histograms) and optimized solutions (green histograms). Dark-blue dashed lines show the best fit with normal distributions over the random cases. Each column corresponds to an analyzed protein and each row to a given number N of retained atoms. In the first and last rows, corresponding to numbers of CG sites equal to the numbers of Cα atoms and backbone atoms (Nα and Nbkb, respectively), the values of the mapping entropy associated with the physically intuitive choice of the CG sites (see the text) are indicated by vertical lines (red for N = Nα, purple for N = Nbkb). It should be noted that the σ ranges have the same width in all of the plots.
Figure 2
Figure 2
Values of the mapping entropy Σ [in kJ mol–1 K–1] for mappings connecting two optimal solutions. In each plot, one per protein under examination, the two lowest-Σ mappings are taken as initial and final end points (black dots) for paths constructed by swapping pairs of atoms between them (blue dots). For each protein, 100 independent paths at the given N = Nαβ were constructed, and the mapping entropy of each intermediate point was computed. In each plot, horizontal lines represent the mean (red) and minimum (green) values of Smap obtained from the corresponding distributions of random mappings presented in Figure 1.
Figure 3
Figure 3
Probability Pcons that a given atom is retained in the optimal mapping at various numbers N of CG sites and for each analyzed protein, expressed as a function of the atom index. Atoms are ordered according to their numbers in the PDB file. The secondary structure of the proteins is depicted using Biotite: green waves represent α-helices, and orange arrows correspond to β-strands.
Figure 4
Figure 4
Structure of tamapin (one bead per atom) colored according to Pcons, the probability for each atom to be retained in the pool of optimal mappings. Each structure corresponds to a different number N of retained CG sites. Residues presenting the highest retainment probability across N (ARG6 and ARG13) are highlighted.
Figure 5
Figure 5
Schematic representation of the algorithmic procedure described in the text that we employ to minimize the mapping entropy, the latter being calculated by means of eq 25. The full similarity matrix is computed once every TK steps, while in the intermediate steps we resort to the approximation given by eq 23. TK depends on both the protein and N. TMAX is the number of simulated annealing steps (here TMAX = 2 × 10⁴).

References

    1. Car R.; Parrinello M. Unified Approach for Molecular Dynamics and Density-Functional Theory. Phys. Rev. Lett. 1985, 55, 2471–2474. 10.1103/PhysRevLett.55.2471. - DOI - PubMed
    1. Alder B. J.; Wainwright T. E. Studies in Molecular Dynamics. I. General Method. J. Chem. Phys. 1959, 31, 459–466. 10.1063/1.1730376. - DOI
    1. Karplus M. Molecular Dynamics Simulations of Biomolecules. Acc. Chem. Res. 2002, 35, 321–323. 10.1021/ar020082r. - DOI - PubMed
    1. Takada S. Coarse-grained molecular simulations of large biomolecules. Curr. Opin. Struct. Biol. 2012, 22, 130–137. 10.1016/j.sbi.2012.01.010. - DOI - PubMed
    1. Noid W. G. Perspective: Coarse-grained models for biomolecular systems. J. Chem. Phys. 2013, 139, 090901.10.1063/1.4818908. - DOI - PubMed