. 2020 Oct 28;287(1937):20202133.
doi: 10.1098/rspb.2020.2133. Epub 2020 Oct 28.

Sarcomere length non-uniformities dictate force production along the descending limb of the force-length relation

Affiliations

Sarcomere length non-uniformities dictate force production along the descending limb of the force-length relation

Ricarda Haeger et al. Proc Biol Sci. .

Abstract

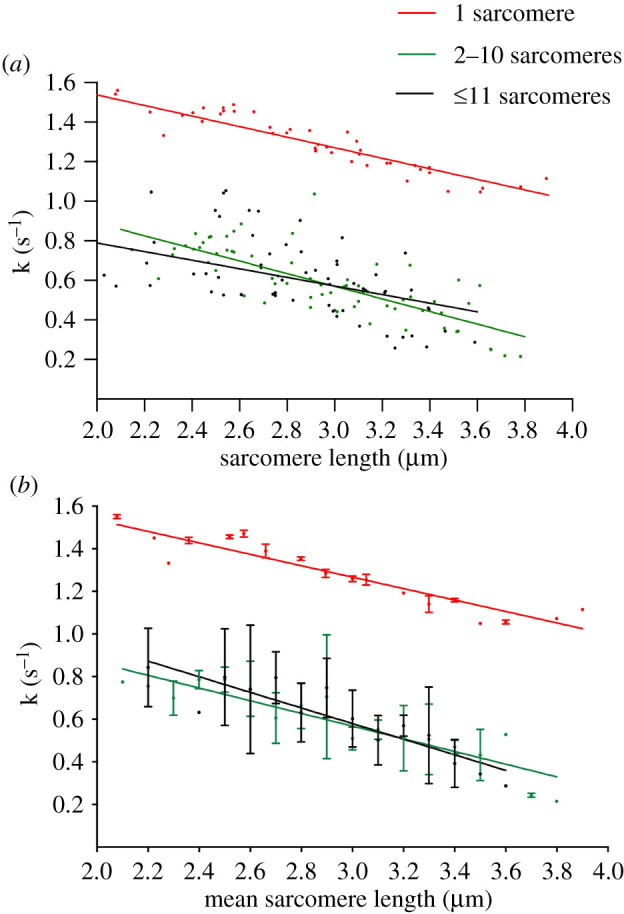
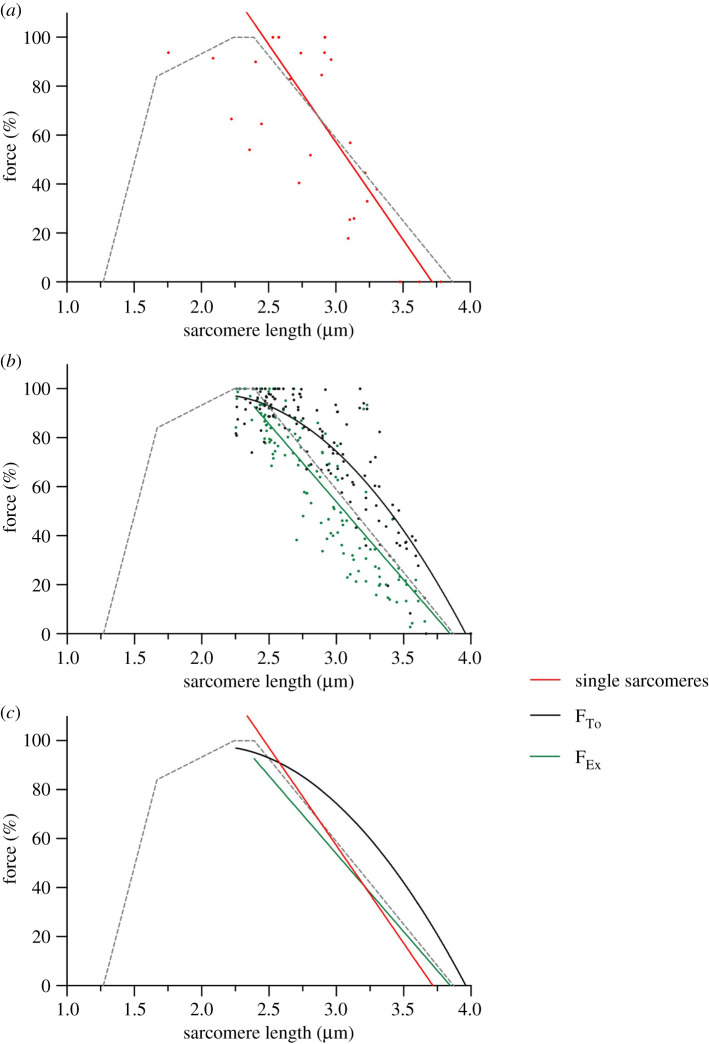
The force-length relation is one of the most defining features of muscle contraction, and yet a topic of debate in the literature. The sliding filament theory predicts that the force produced by muscle fibres is proportional to the degree of overlap between myosin and actin filaments, producing a linear descending limb of the active force-length relation. However, several studies have shown forces that are larger than predicted, especially at long sarcomere lengths (SLs). Studies have been conducted with muscle fibres, preparations containing thousands of sarcomeres that make measurements of individual SL challenging. The aim of this study was to evaluate force production and sarcomere dynamics in isolated myofibrils and single sarcomeres from the rabbit psoas muscle to enhance our understanding of the theoretically predicted force-length relation. Contractions at varying SLs along the plateau (SL = 2.25-2.39 µm) and the descending limb (SL > 2.39 µm) of the force-length relation were induced in sarcomeres and myofibrils, and different modes of force measurements were used. Our results show that when forces are measured in single sarcomeres, the experimental force-length relation follows theoretical predictions. When forces are measured in myofibrils with large SL dispersions, there is an extension of the plateau and forces elevated above the predicted levels along the descending limb. We also found an increase in SL non-uniformity and slowed rates of force production at long lengths in myofibrils but not in single sarcomere preparations. We conclude that the deviation of the descending limb of the force-length relation is correlated with the degree of SL non-uniformity and slowed force development.

Keywords: force–length relation; myofibril; sarcomere length non-uniformity; single sarcomere.


Conflict of interest statement

We declare we have no competing interests

Figures

Figure 1.
Figure 1.
Images of isolated sarcomeres and myofibrils held between two glass needles and visualized at high magnification (X100). (a) Plot profile of a single sarcomere matching the greyscale pattern of the sarcomere image, in which the A-band can be visualized. The two glass needles produce larger peaks at the beginning and end of the plots. (b) Myofibril with four sarcomeres in series before (top) and during (bottom) contraction. (c) Myofibril with 18 sarcomeres in series before (top) and during (bottom) contraction. (Online version in colour.)
Figure 2.
Figure 2.
Typical force traces during a contraction. (a) Force traces of a single sarcomere contracting from an initial SL (SLi) of 2.09 µm shortening to a final SL (SLf) of 1.65 µm (orange, i), and contracting from a SLi of 2.39 µm shortening to a final SL of 2.11 µm (red, ii); total active forces reached 120.49 nN µm−2 and 104.56 nN µm−2, respectively. Note the similarity of rates of force development in both contractions. (b) Force traces of a myofibril containing 12 sarcomeres in series contracting from a SLi of 2.27 µm shortening to a final SL of 2.20 µm (green, i) and contracting from a SLi of 2.79 µm shortening to a final SL of 2.47 µm (blue, ii); total active forces reached 83.27 nN µm−2 and 66.10 nN µm−2, respectively. The rate of force development is noticeably slower in the contraction induced at a SLi at 2.97 µm compared to the contraction induced at SLi 2.27 µm. (Online version in colour.)
Figure 3.
Figure 3.
Rate constants of force development in single sarcomeres (red, top line), myofibrils with 2–10 sarcomeres (green), and myofibrils with ≥11 sarcomeres (black) using all data collected in our experiments. (a) All data points for rate constant values in the three groups. (b) Average values of rate constants obtained during similar final SLs. The trends in rate change with increasing SLs were fitted with linear regressions obtaining slopes of −0.29 ± 0.03 µm s−1 for single sarcomeres (red, r2 = 0.86), −0.30 ± 0.03 µm s−1 for 2–10 sarcomeres (green, r2 = 0.83), and −0.37 ± 0.05 µm s−1 for ≥11 sarcomeres (black, r2 = 0.81). (Online version in colour.)
Figure 4.
Figure 4.
Data in green (middle line) represents myofibrils with 2–10 sarcomeres in series. Data in black (top line) represents myofibrils containing ≥11 sarcomeres in series. Data in blue (bottom line) represents the SL dispersion from both groups while at rest. (a) Individual SL dispersions per myofibril, including all data from all preparations investigated in the study. (b) Average values of SL dispersion at a given final SL. The dataset of each group was fitted using a linear regression, obtaining slopes of 0.08 ± 0.01 (green, middle, r2 = 0.70) and 0.16 ± 0.01 (black, top, r2 = 0.94) for 2–10 sarcomeres, ≥11 sarcomeres, and all myofibrils in the relaxed state, respectively. (Online version in colour.)
Figure 5.
Figure 5.
Trace of a myofibril with 13 sarcomeres in series, contracting at an initial SL of 3.1 µm. (a) The red trace shows the one-phase association fit, obtaining a rate constant of force development (k) of 0.57/s, and a value for the total active force obtained during the contraction (F) of 74.44 nN µm−2. (b) The method for defining force using the extrapolation method. The method uses two tangents: one along the initial rise phase and one along the span of the stabilization region of the contraction. The extrapolated force in this myofibril was 66.5 nN µm−2. (Online version in colour.)
Figure 6.
Figure 6.
The force–length relation of different groups investigated in this study. In all graphs, the broken grey lines represent the theoretical force–length relation based on filament lengths and relative overlap [10,23]. Forces were normalized, and only points on the theoretical descending limb (SL > 2.39 µm) were considered for the fits. (a) Single sarcomere force values and linear regression analysis (r2 = 0.65). The data were collected from 11 individual sarcomeres, using 2–3 contractions for each sarcomere. (b) The data and the curve fits for myofibrils with several sarcomeres in series. The black line (curved line) represents the total active forces, FTo, while the green line (straight line) shows force values obtained with the extrapolation method shown in figure 5, FEx. Total active forces were fit with a second-order polynomial (r2 = 0.84) and extrapolated forces with a linear regression (r2 = 0.80). The data were collected from 31 individual myofibrils, using 3–12 contractions for each myofibril. (c) Lines of best fit for the descending limb of all three groups are shown on one graph: single sarcomere data (red, long straight line), total active force data (black, curved line), and extrapolated force data (green, short straight line). (Online version in colour.)

References

    1. Huxley AF, Niedergerke R. 1954. Structural changes in muscle during contraction: interference microscopy of living muscle fibres. Nature 173, 971–973. (10.1038/173971a0) - DOI - PubMed
    1. Huxley HE, Hanson J. 1954. Changes in the cross-striations of muscle during contraction and stretch and their structural interpretation. Nature 173, 973–976. (10.1038/173973a0) - DOI - PubMed
    1. Huxley AF. 1957. Muscle structure and theories of contraction. Prog. Biophys. Biophys Chem. 7, 255–318. (10.1016/S0096-4174(18)30128-8) - DOI - PubMed
    1. Huxley AF, Simmons RM. 1971. Proposed mechanism of force generation in striated muscle. Nature 233, 533–538. (10.1038/233533a0) - DOI - PubMed
    1. Gordon AM, Huxley AF, Julian FJ. 1966. The variation in isometric tension with sarcomere length in vertebrate muscle fibres. J. Physiol. 184, 170–192. (10.1113/jphysiol.1966.sp007909) - DOI - PMC - PubMed

Publication types

LinkOut - more resources