. 2020 Oct 27;21(1):747.
doi: 10.1186/s12864-020-07168-8.

Blood-based epigenetic estimators of chronological age in human adults using DNA methylation data from the Illumina MethylationEPIC array

Affiliations

Blood-based epigenetic estimators of chronological age in human adults using DNA methylation data from the Illumina MethylationEPIC array

Yunsung Lee et al. BMC Genomics. .

Abstract

Background: Epigenetic clocks have been recognized for their precise prediction of chronological age, age-related diseases, and all-cause mortality. Existing epigenetic clocks are based on CpGs from the Illumina HumanMethylation450 BeadChip (450 K) which has now been replaced by the latest platform, Illumina MethylationEPIC BeadChip (EPIC). Thus, it remains unclear to what extent EPIC contributes to increased precision and accuracy in the prediction of chronological age.

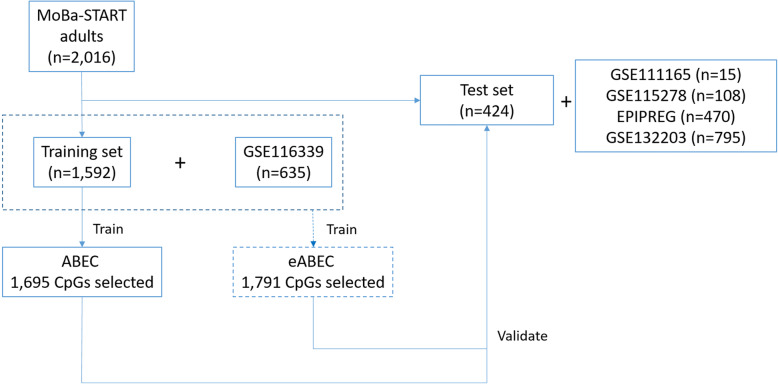
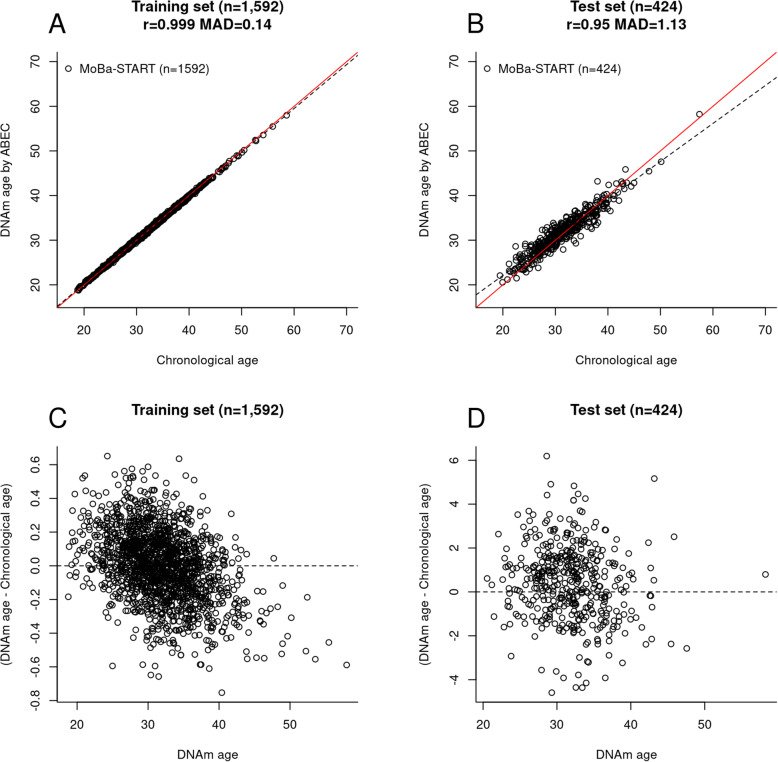
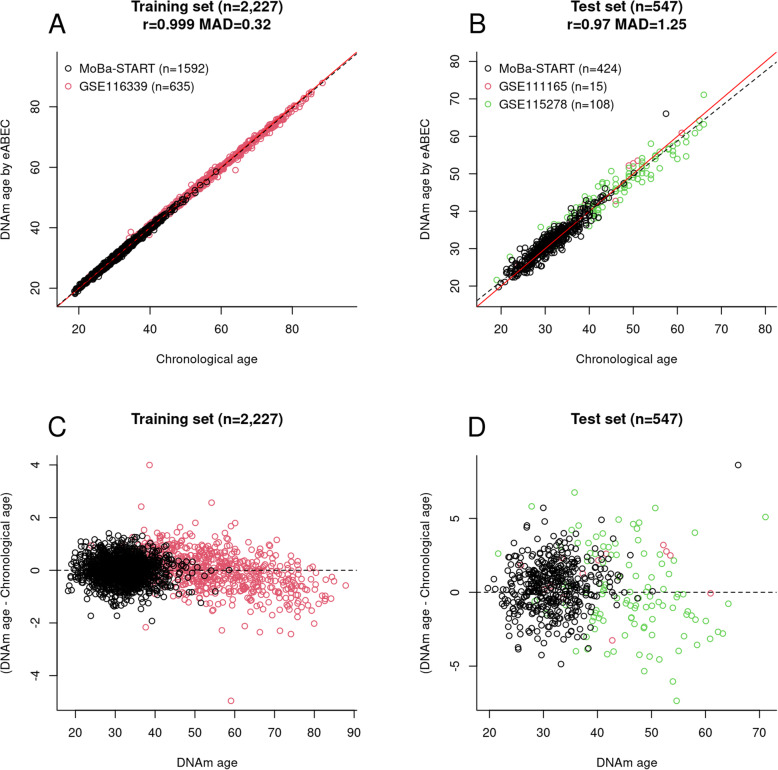
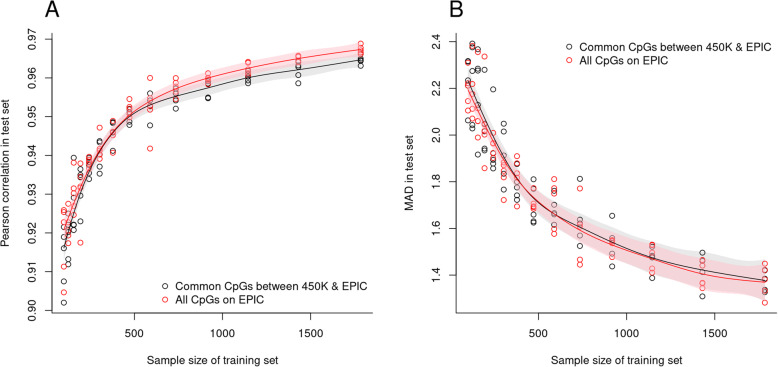
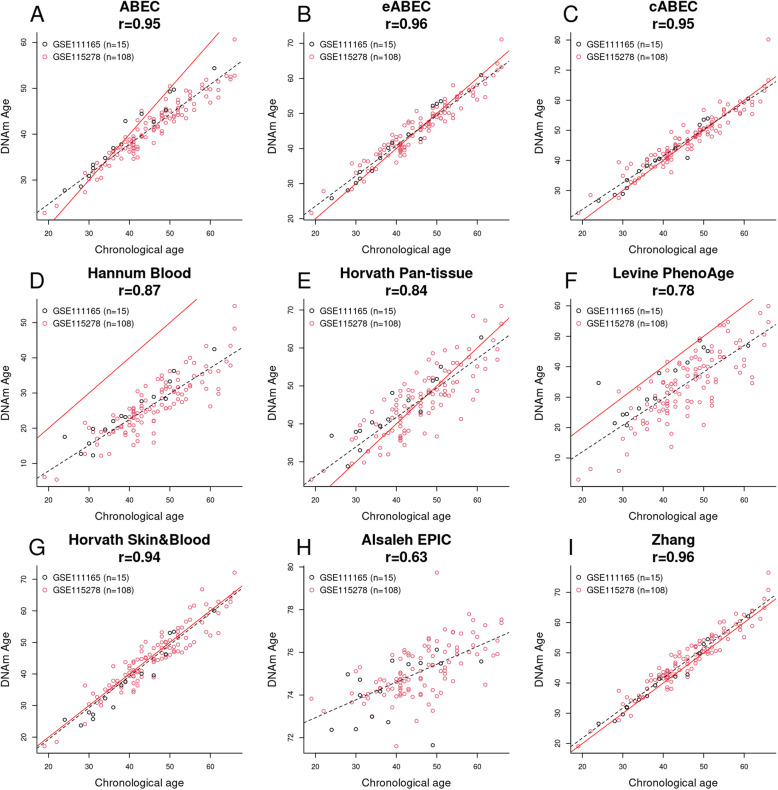
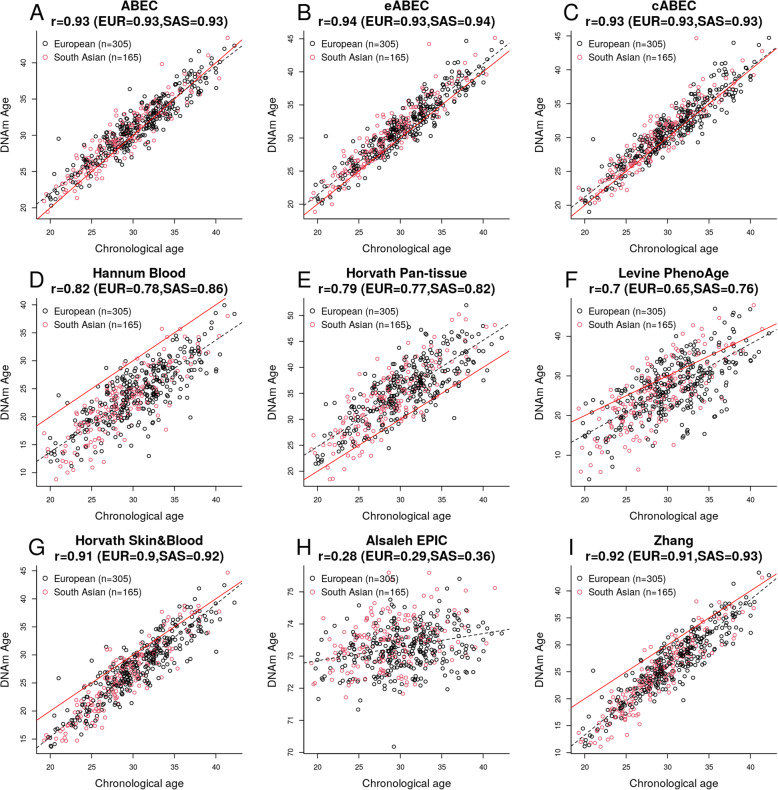
Results: We developed three blood-based epigenetic clocks for human adults using EPIC-based DNA methylation (DNAm) data from the Norwegian Mother, Father and Child Cohort Study (MoBa) and the Gene Expression Omnibus (GEO) public repository: 1) an Adult Blood-based EPIC Clock (ABEC) trained on DNAm data from MoBa (n = 1592, age-span: 19 to 59 years), 2) an extended ABEC (eABEC) trained on DNAm data from MoBa and GEO (n = 2227, age-span: 18 to 88 years), and 3) a common ABEC (cABEC) trained on the same training set as eABEC but restricted to CpGs common to 450 K and EPIC. Our clocks showed high precision (Pearson correlation between chronological and epigenetic age (r) > 0.94) in independent cohorts, including GSE111165 (n = 15), GSE115278 (n = 108), GSE132203 (n = 795), and the Epigenetics in Pregnancy (EPIPREG) study of the STORK Groruddalen Cohort (n = 470). This high precision is unlikely due to the use of EPIC, but rather due to the large sample size of the training set.

Conclusions: Our ABECs predicted adults' chronological age precisely in independent cohorts. As EPIC is now the dominant platform for measuring DNAm, these clocks will be useful in further predictions of chronological age, age-related diseases, and mortality.

Keywords: Chronological age; DNA methylation; Epigenetic age; Illumina MethylationEPIC BeadChip; MoBa.


Conflict of interest statement

The authors declare no conflicts of interest.

Figures

Fig. 1
Fig. 1
Analysis flow. MoBa-START adults were randomly assigned to a training and a test set
Fig. 2
Fig. 2
Chronological age estimation by ABEC. a Scatter plot of chronological age against DNAm age estimated by ABEC in the training set. b Scatter plot of chronological age against DNAm age estimated by ABEC in the test set. c Residual plot in the training set. d Residual plot in the test set. The red line in panels (a) and (b) represents a perfect correlation between chronological age and DNAm age, and the dotted line is the regression of DNAm age on chronological age
Fig. 3
Fig. 3
Chronological age estimation by eABEC. a Scatter plot of chronological age against DNAm age estimated by eABEC in the extensive training set. b Scatter plot of chronological age against DNAm age estimated by eABEC in the test set. c Residual plot in the training set. d Residual plot in the test set. The red line in panels (a) and (b) represents a perfect correlation between chronological age and DNAm age, and the dotted line is the regression of DNAm age on chronological age
Fig. 4
Fig. 4
Comparison of precision and accuracy between a clock based on the CpGs common to 450 K and EPIC and a clock on all the CpGs on EPIC. a Scatter plot of the Pearson correlation (r) in the test set against the sample size of the training set. b Scatter plot of MAD in the test set against the sample size of the training set. In panel (a), we fit the smoothing splines of the Fisher’s Z-transformed r values on the sample size, derived the confidence intervals, and inverse-transformed them. In panel (b), we fit the smoothing splines of MAD values on the sample size without transformation. The black dots refer to the clock based on the CpGs common to 450 K and EPIC, and the red dots refer to the clock based on all the CpGs on EPIC
Fig. 5
Fig. 5
Chronological age estimation by ABEC, eABEC, and the other published epigenetic age estimators. a ABEC, b eABEC, c Hannum Blood-based clock, d Horvath Pan-tissue clock, e Levine PhenoAge clock, f Horvath Skin & blood clock, g Alsaleh Blood-based EPIC clock (the stepwise regression), and h Zhang clock (elastic net regression). The red line in the panels represents a perfect correlation between chronological age and DNAm age, and the dotted line is the regression of DNAm age on chronological age
Fig. 6
Fig. 6
Application of ABEC, eABEC, and other epigenetic clocks to DNAm data in the EPIPREG sub-study of the STORK Groruddalen cohort. The title of each panel displays the overall r as well as the ethnicity-specific r. EUR indicates the r between chronological age and DNAm age in 305 women of European ancestry, whereas SAS refers to the r between chronological age and DNAm age in 165 women of South Asian ancestry

References

    1. Baker GT, 3rd, Sprott RL. Biomarkers of aging. Exp Gerontol. 1988;23(4–5):223–239. doi: 10.1016/0531-5565(88)90025-3. - DOI - PubMed
    1. Warner HR. Current status of efforts to measure and modulate the biological rate of aging. J Gerontol A Biol Sci Med Sci. 2004;59(7):692–696. doi: 10.1093/gerona/59.7.B692. - DOI - PubMed
    1. Horvath S, Oshima J, Martin GM, Lu AT, Quach A, Cohen H, Felton S, Matsuyama M, Lowe D, Kabacik S, et al. Epigenetic clock for skin and blood cells applied to Hutchinson Gilford Progeria syndrome and ex vivo studies. Aging (Albany NY) 2018;10(7):1758–1775. doi: 10.18632/aging.101508. - DOI - PMC - PubMed
    1. Jylhava J, Pedersen NL, Hagg S. Biological age predictors. EBioMedicine. 2017;21:29–36. doi: 10.1016/j.ebiom.2017.03.046. - DOI - PMC - PubMed
    1. Melzer D, Pilling LC, Ferrucci L. The genetics of human ageing. Nat Rev Genet. 2020;21(2):88–101. doi: 10.1038/s41576-019-0183-6. - DOI - PMC - PubMed