. 2020 Oct 27;20(1):1030.
doi: 10.1186/s12885-020-07535-4.

An integrated autophagy-related gene signature predicts prognosis in human endometrial Cancer

Affiliations

An integrated autophagy-related gene signature predicts prognosis in human endometrial Cancer

Jun Zhang et al. BMC Cancer. .

Abstract

Background: Globally, endometrial cancer is the fourth most common malignant tumor in women and the number of women being diagnosed is increasing. Tumor progression is strongly related to the cell survival-promoting functions of autophagy. We explored the relationship between endometrial cancer prognoses and the expression of autophagy genes using human autophagy databases.

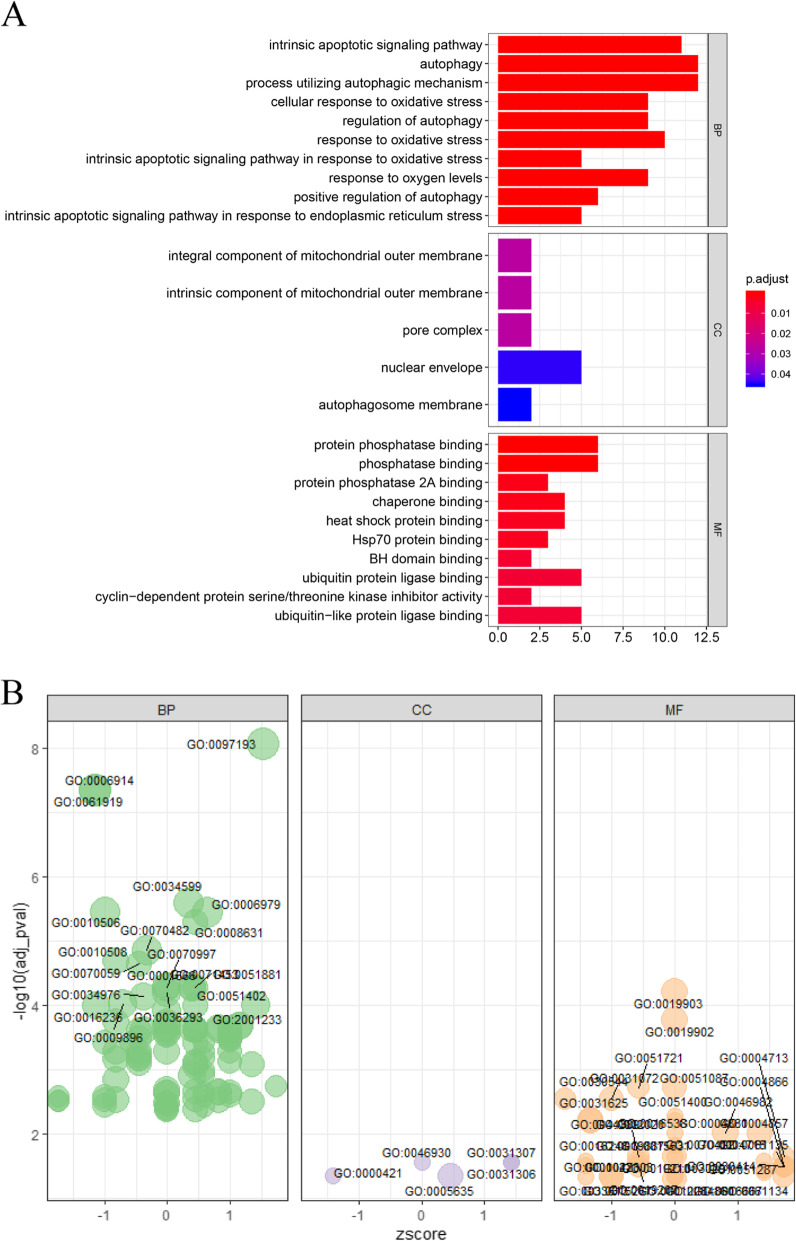
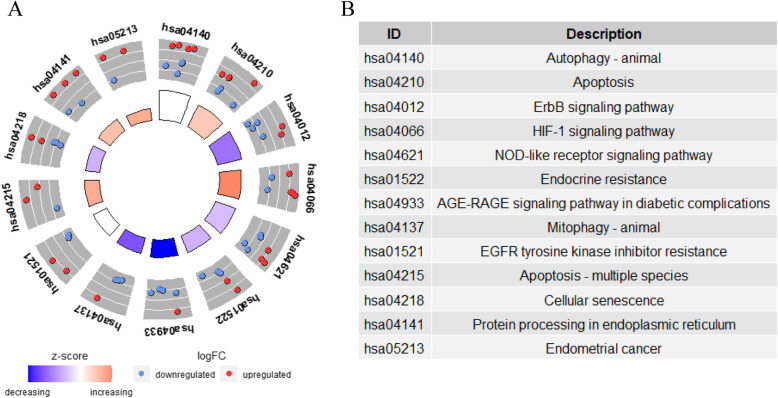
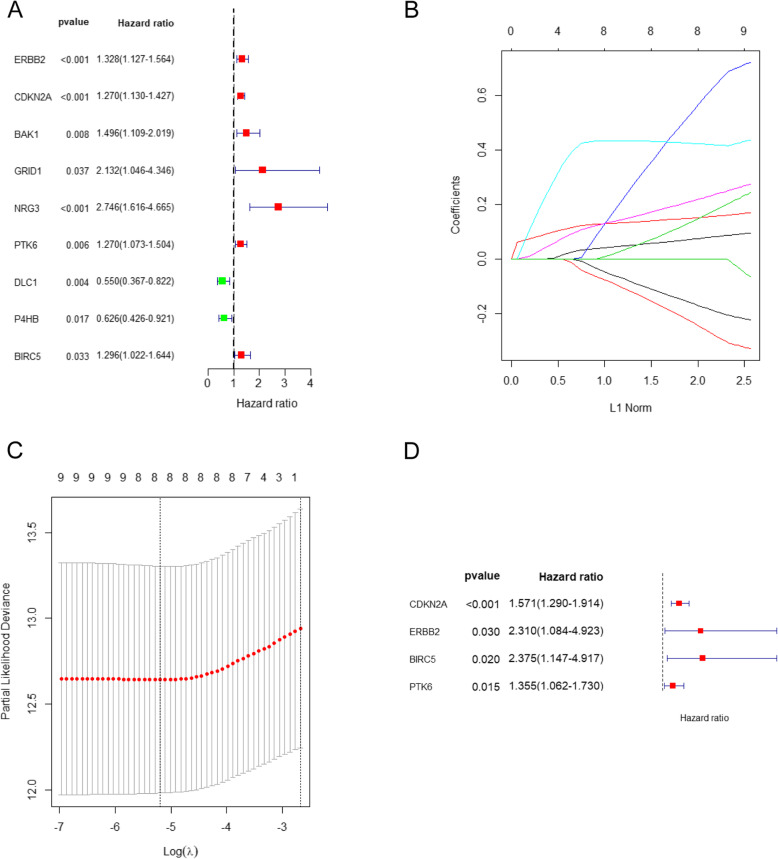
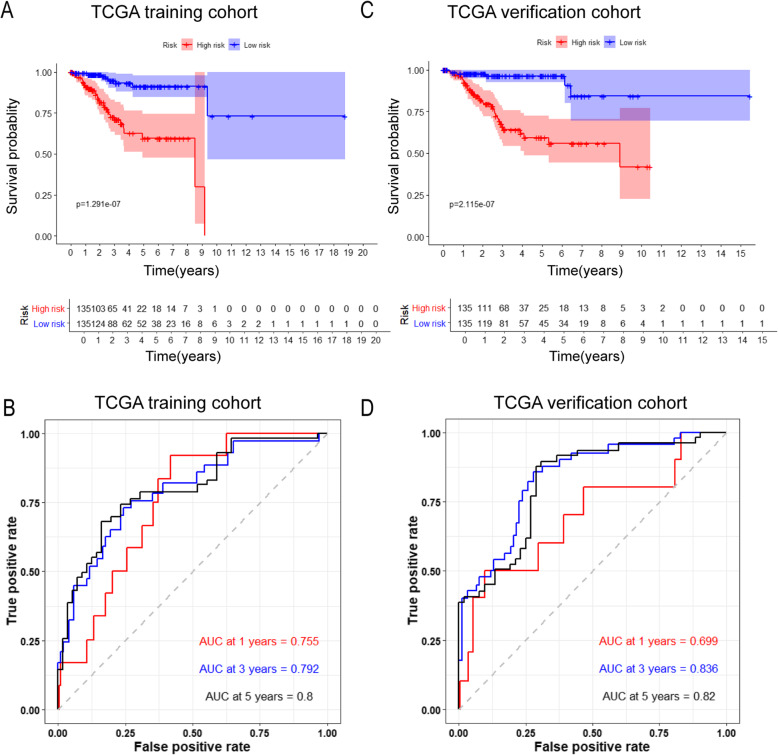
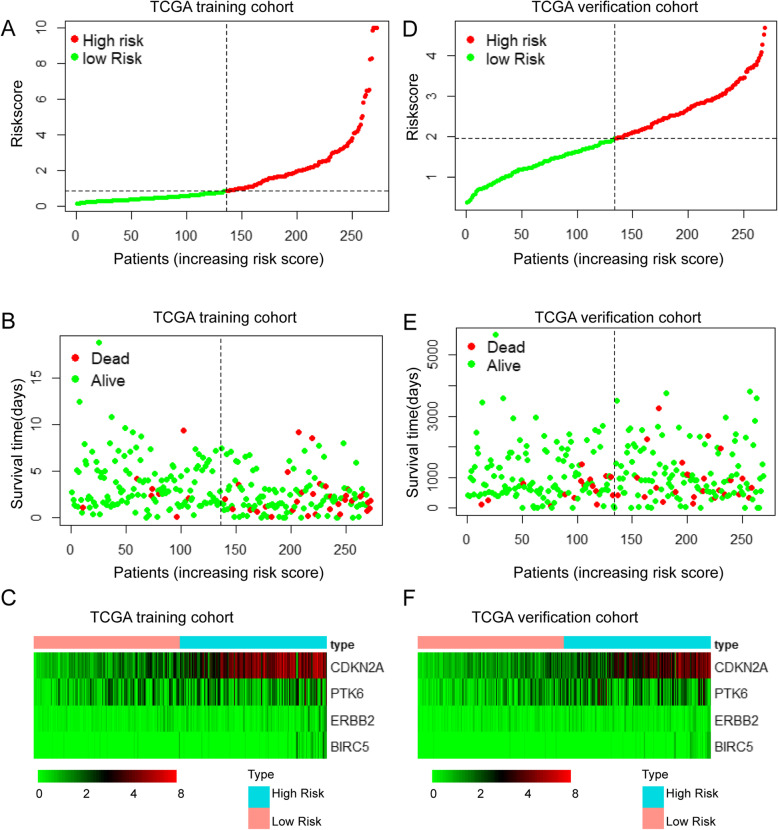
Methods: The Cancer Genome Atlas was used to identify autophagy related genes (ARGs) that were differentially expressed in endometrial cancer tissue compared to healthy endometrial tissue. Gene Ontology and Kyoto Encyclopedia of Genes and Genomes were referenced to identify important biological functions and signaling pathways related to these differentially expressed ARGs. A prognostic model for endometrial cancer was constructed using univariate and multivariate Cox, and Least Absolute Shrinkage and Selection Operator regression analysis. Endometrial cancer patients were divided into high- and low-risk groups according to risk scores. Survival and receiver operating characteristic (ROC) curves were plotted for these patients to assess the accuracy of the prognostic model. Using immunohistochemistry the protein levels of the genes associated with risk were assessed.

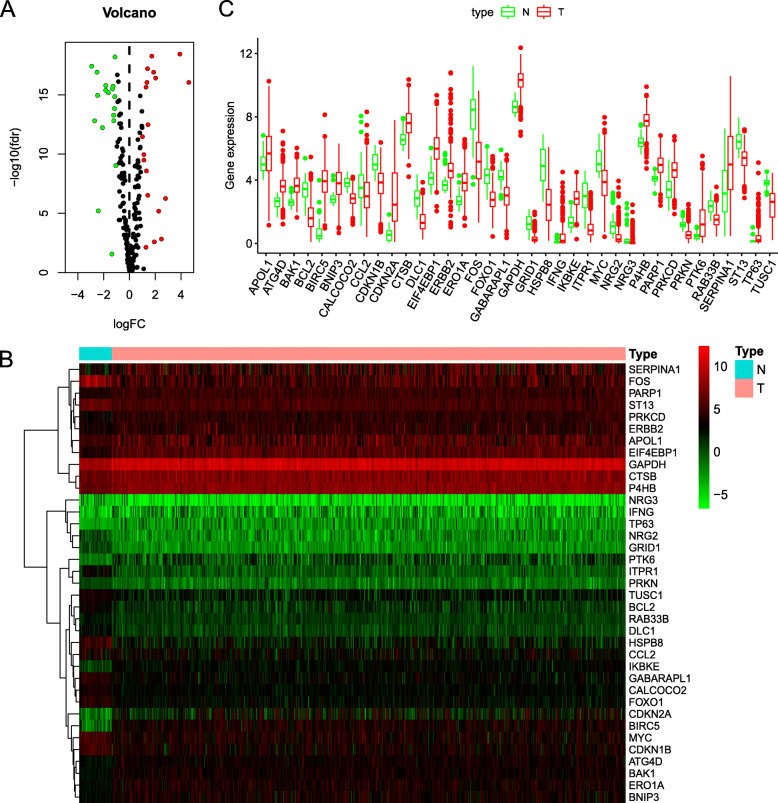
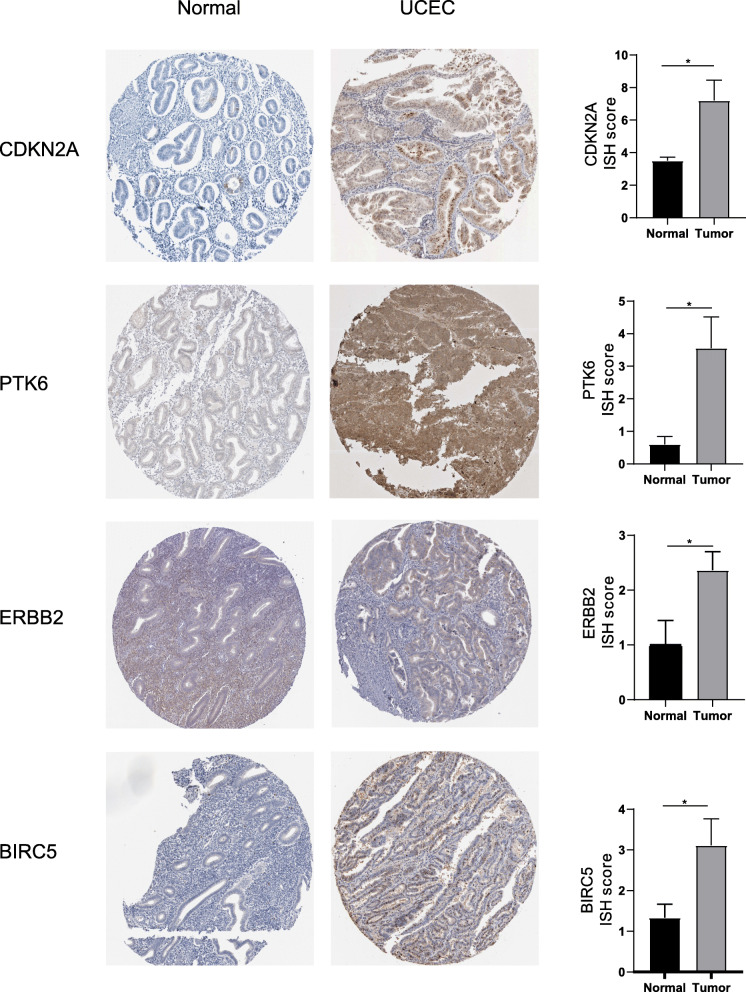
Results: We determined 37 ARGs were differentially expressed between endometrial cancer and healthy tissues. These genes were enriched in the biological processes and signaling pathways related to autophagy. Four ARGs (CDKN2A, PTK6, ERBB2 and BIRC5) were selected to establish a prognostic model of endometrial cancer. Kaplan-Meier survival analysis suggested that high-risk groups have significantly shorter survival times than low-risk groups. The area under the ROC curve indicated that the prognostic model for survival prediction was relatively accurate. Immunohistochemistry suggested that among the four ARGs the protein levels of CDKN2A, PTK6, ERBB2, and BIRC5 were higher in endometrial cancer than healthy endometrial tissue.

Conclusions: Our prognostic model assessing four ARGs (CDKN2A, PTK6, ERBB2, and BIRC5) suggested their potential as independent predictive biomarkers and therapeutic targets for endometrial cancer.

Keywords: Autophagy; Endometrial cancer; Molecular biomarkers; Prognosis; The Cancer genome atlas.


Conflict of interest statement

The authors declare that they have no competing interests.

Figures

Fig. 1
Fig. 1
Differentially expressed ARGs. a The volcano plot for the 222 autophagy-related genes from the TCGA data portal. Red represents high expression, and green represents low expression. b Hierarchical clustering of differentially expressed ARGs expression levels. c The expression patterns of 37 autophagy-related genes in endometrial cancer and normal endometrial tissues. Red columns represent tumor tissue, and green columns represent normal tissue. The height of the column represents its expression in the corresponding sample
Fig. 2
Fig. 2
GO enrichment analysis of differentially expressed ARGs. a Bar plot of significant GO terms, on the left is the name of the GO term, the length of the histogram on the right indicates the number of genes contained, and the color indicates the adjusted P-value. b Bubble plot of enriched GO terms. The Z-score is plotted on the x-axis, and the -log (adjusted p-value) is plotted on the y-axis. The size of the bubble reflects the number of genes enriched in the term. BP means “Biological process”; MF means “Molecular function”; CC means “Cellular component”
Fig. 3
Fig. 3
KEGG enrichment analysis of differentially expressed ARGs. a Circle plot of KEGG enrichment analysis, each independent trapezoidal area represents a KEGG pathway, where red dots represent genes that are up-regulated, and blue represent downregulated genes. b The table lists the name of each KEGG term
Fig. 4
Fig. 4
Survival-related ARGs and the prognostic model. a Forest plots visualizing the HRs of 9 prognostic ARGs identified by univariate Cox analysis of TCGA UCEC, protective associations are shown in green, and risk factors are shown in red; b LASSO coefficient profiles of the 9 prognostic ARGs, each curve represents a coefficient; as λ changes, the coefficient enters the prognostic model with a non-zero value. c Cross-validation to select the optimal tuning parameter (λ), the first black dotted line indicates the optimal number of parameters of the multivariate risk prognosis model. d Forest plots visualizing the HRs of 4 prognostic ARGs identified by multivariate Cox analysis of training cohort
Fig. 5
Fig. 5
Validation of the prognostic model. a Kaplan-Meier plotter of the high-risk and low-risk UCEC patients in the training group; b Time-dependent ROC curves for predicting one-year, three-year, and five-year survival in the training cohort; c Kaplan-Meier plotter of the high-risk and low-risk UCEC patients in the testing group; d Time-dependent ROC curves for predicting one-year, three-year, and five-year survival in the testing cohort
Fig. 6
Fig. 6
Risk curve and heatmap of risk genes in the training and verification sets. a, d Risk score distribution of UCEC patients with different risks in the training set and verification set. b, e Scatterplots of UCEC patients with different survival status in the training set and verification set. c, f) The heatmap of risk genes in UCEC between high-risk and low-risk patients in the training and verification sets
Fig. 7
Fig. 7
Validation of risk genes at the protein level. Immunohistochemical staining of the four risk ARGs in normal endometrium and endometrial cancer tissues (left) and a histogram showing the staining scores for normal endometrium and endometrial cancer tissues (right). *P < 0.05. NS: not significant

References

    1. Parzych KR, Klionsky DJ. An overview of autophagy: morphology, mechanism, and regulation. Antioxid Redox Signal. 2014;20(3):460–473. doi: 10.1089/ars.2013.5371. - DOI - PMC - PubMed
    1. Mizushima N, Komatsu M. Autophagy: renovation of cells and tissues. Cell. 2011;147(4):728–741. doi: 10.1016/j.cell.2011.10.026. - DOI - PubMed
    1. Ravanan P, Srikumar IF, Talwar P. Autophagy: the spotlight for cellular stress responses. Life Sci. 2017;188:53–67. doi: 10.1016/j.lfs.2017.08.029. - DOI - PubMed
    1. Mowers EE, Sharifi MN, Macleod KF. Functions of autophagy in the tumor microenvironment and cancer metastasis. FEBS J. 2018;285(10):1751–1766. doi: 10.1111/febs.14388. - DOI - PMC - PubMed
    1. Rockel JS, Kapoor M. Autophagy: controlling cell fate in rheumatic diseases. Nat Rev Rheumatol. 2016;12(9):517–531. doi: 10.1038/nrrheum.2016.92. - DOI - PubMed

MeSH terms