

High excess mortality in areas with young and socially vulnerable populations during the COVID-19 outbreak in Stockholm Region, Sweden
- PMID: 33109636
- PMCID: PMC7592025
- DOI: 10.1136/bmjgh-2020-003595
High excess mortality in areas with young and socially vulnerable populations during the COVID-19 outbreak in Stockholm Region, Sweden
Abstract
Introduction: We aimed to describe the distribution of excess mortality (EM) during the first weeks of the COVID-19 outbreak in the Stockholm Region, Sweden, according to age, sex and sociodemographic context.
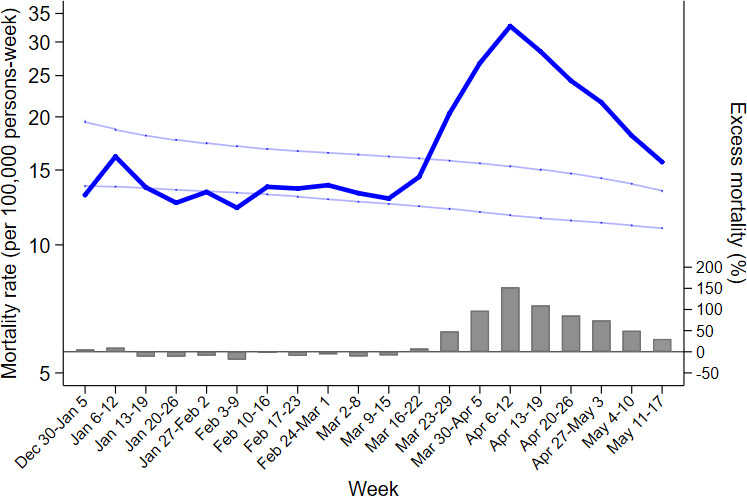
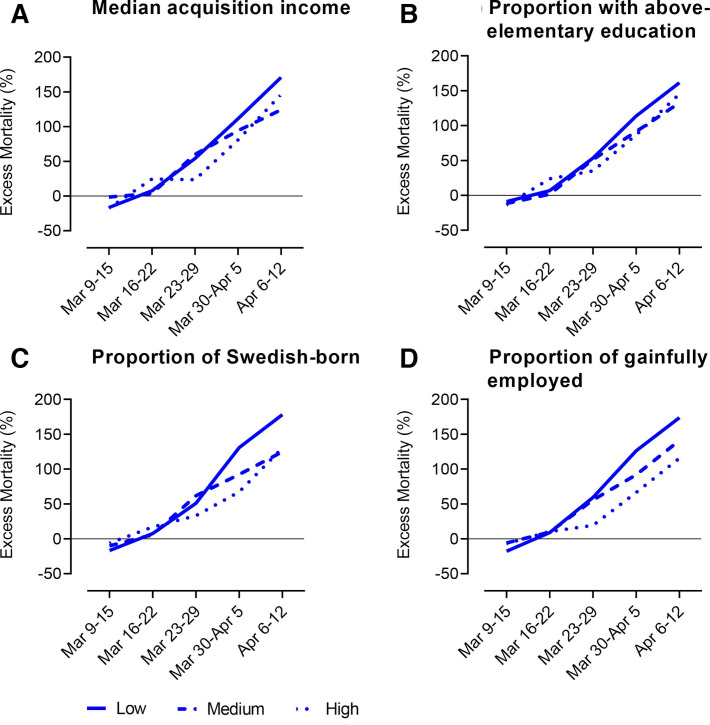
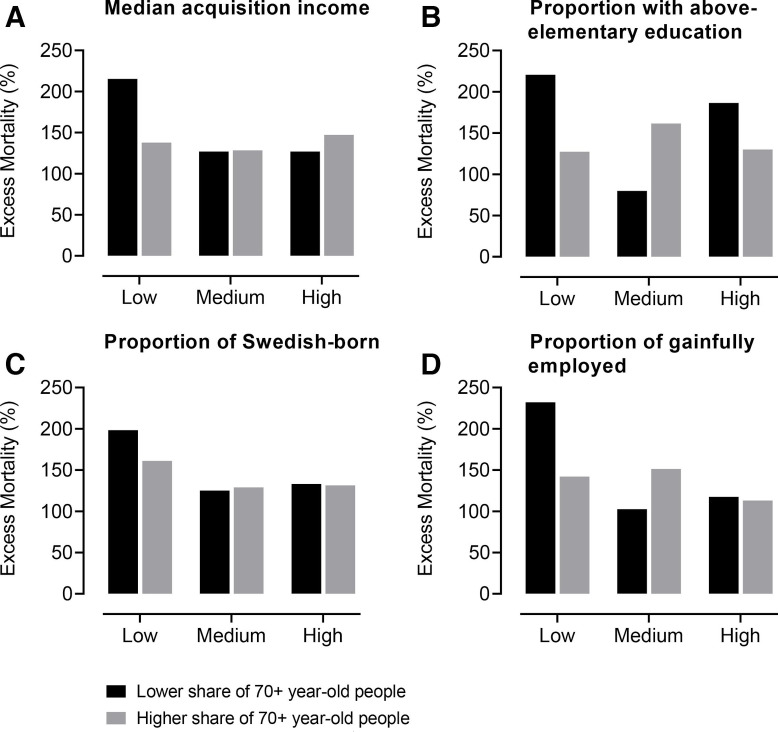
Methods: Weekly all-cause mortality data were obtained from Statistics Sweden for the period 1 January 2015 to 17 May 2020. EM during the first 20 weeks of 2020 was estimated by comparing observed mortality rates with expected mortality rates during the five previous years (N=2 379 792). EM variation by socioeconomic status (tertiles of income, education, Swedish-born, gainful employment) and age distribution (share of 70+-year-old persons) was explored based on Demographic Statistics Area (DeSO) data.
Results: EM was first detected during the week of 23-29 March 2020. During the peak week of the epidemic (6-12 April 2020), an EM of 150% was observed (152% in 80+-year-old women; 183% in 80+-year-old men). During the same week, the highest EM was observed for DeSOs with lowest income (171%), lowest education (162%), lowest share of Swedish-born (178%) and lowest share of gainfully employed residents (174%). EM was further increased in areas with higher versus lower proportion of younger people (magnitude of increase: 1.2-1.7 times depending on socioeconomic measure).
Conclusion: Living in areas characterised by lower socioeconomic status and younger populations was linked to excess mortality during the COVID-19 pandemic in the Stockholm Region. These conditions might have facilitated viral spread. Our findings highlight the well-documented vulnerability linked to increasing age and sociodemographic context for COVID-19-related death.
Keywords: Descriptive study; epidemiology; public health.
© Author(s) (or their employer(s)) 2020. Re-use permitted under CC BY-NC. No commercial re-use. See rights and permissions. Published by BMJ.
Conflict of interest statement
Competing interests: None declared.
Figures
References
-
- Swedish National Board of Health and Welfare Statistics on cancer incidence 2017, 2018. Available: https://www.socialstyrelsen.se/globalassets/sharepoint-dokument/artikelk... [Accessed 30 Jun 2020].
-
- Public Health Agency of Sweden COVID-19 statistics in Sweden. Available: https://www.folkhalsomyndigheten.se/smittskydd-beredskap/utbrott/aktuell... [Accessed 30 Jun 2020].
-
- Centers for Disease Control and Prevention – National Center for Health Statistics Excess deaths associated with COVID-19, 2020. Available: https://www.cdc.gov/nchs/nvss/vsrr/covid19/excess_deaths.htm [Accessed 30 Jun 2020].
MeSH terms
LinkOut - more resources
Full Text Sources
Miscellaneous