Observational Study
. 2020 Oct 26;10(10):e040441.
doi: 10.1136/bmjopen-2020-040441.

Hospitalised COVID-19 patients of the Mount Sinai Health System: a retrospective observational study using the electronic medical records

Affiliations
Observational Study

Hospitalised COVID-19 patients of the Mount Sinai Health System: a retrospective observational study using the electronic medical records

Zichen Wang et al. BMJ Open. .

Abstract

Objective: To assess association of clinical features on COVID-19 patient outcomes.

Design: Retrospective observational study using electronic medical record data.

Setting: Five member hospitals from the Mount Sinai Health System in New York City (NYC).

Participants: 28 336 patients tested for SARS-CoV-2 from 24 February 2020 to 15 April 2020, including 6158 laboratory-confirmed COVID-19 cases.

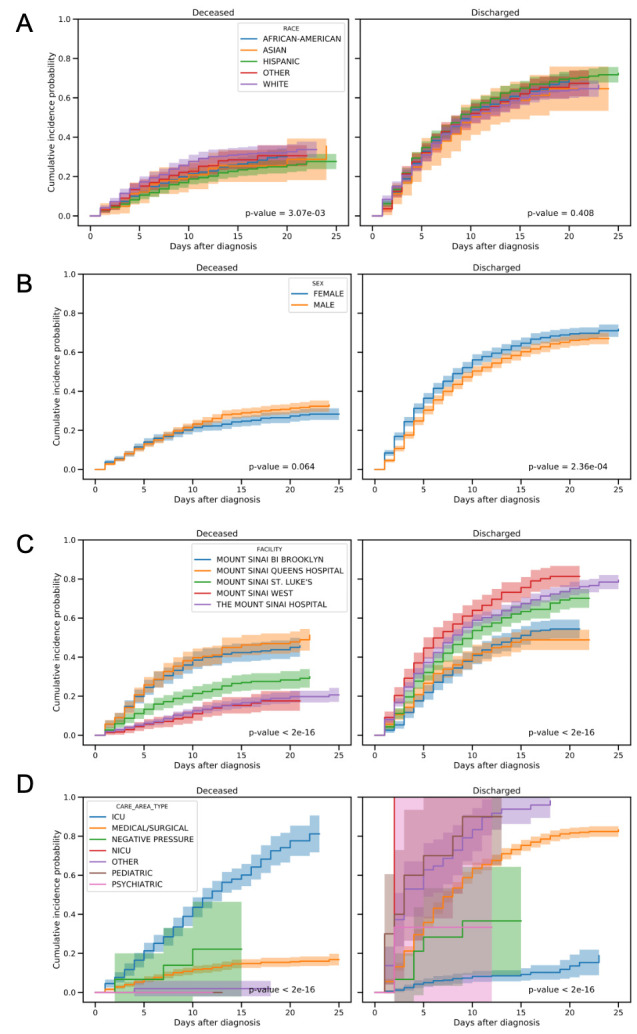
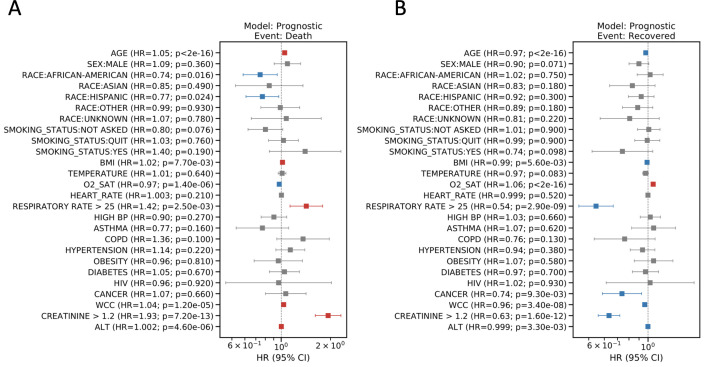
Main outcomes and measures: Positive test rates and in-hospital mortality were assessed for different racial groups. Among positive cases admitted to the hospital (N=3273), we estimated HR for both discharge and death across various explanatory variables, including patient demographics, hospital site and unit, smoking status, vital signs, lab results and comorbidities.

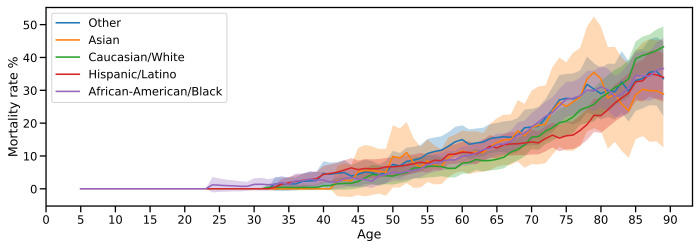
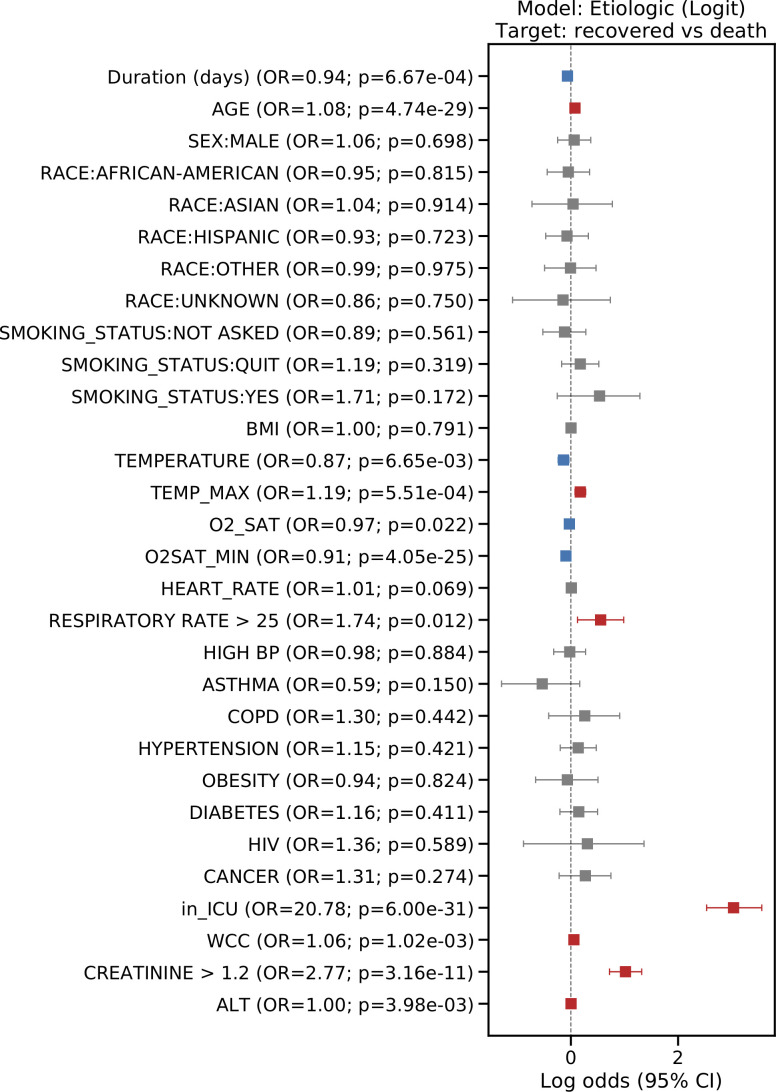
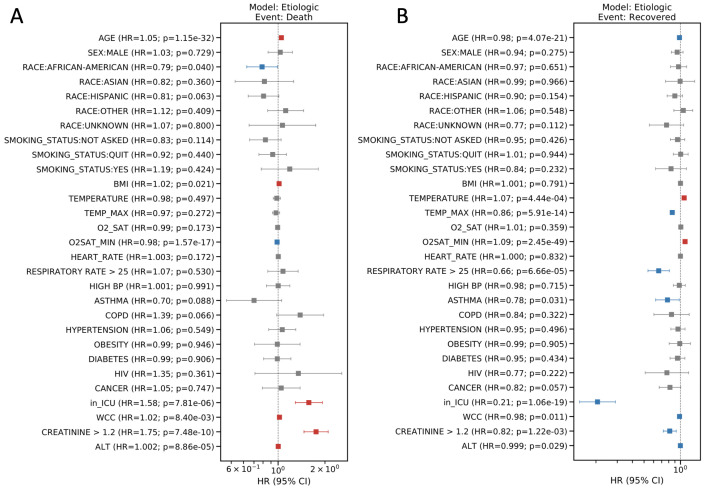
Results: Hispanics (29%) and African Americans (25%) had disproportionately high positive case rates relative to their representation in the overall NYC population (p<0.05); however, no differences in mortality rates were observed in hospitalised patients based on race. Outcomes differed significantly between hospitals (Gray's T=248.9; p<0.05), reflecting differences in average baseline age and underlying comorbidities. Significant risk factors for mortality included age (HR 1.05, 95% CI 1.04 to 1.06; p=1.15e-32), oxygen saturation (HR 0.985, 95% CI 0.982 to 0.988; p=1.57e-17), care in intensive care unit areas (HR 1.58, 95% CI 1.29 to 1.92; p=7.81e-6) and elevated creatinine (HR 1.75, 95% CI 1.47 to 2.10; p=7.48e-10), white cell count (HR 1.02, 95% CI 1.01 to 1.04; p=8.4e-3) and body mass index (BMI) (HR 1.02, 95% CI 1.00 to 1.03; p=1.09e-2). Deceased patients were more likely to have elevated markers of inflammation.

Conclusions: While race was associated with higher risk of infection, we did not find racial disparities in inpatient mortality suggesting that outcomes in a single tertiary care health system are comparable across races. In addition, we identified key clinical features associated with reduced mortality and discharge. These findings could help to identify which COVID-19 patients are at greatest risk of a severe infection response and predict survival.

Keywords: COVID-19; epidemiology; health informatics; infectious diseases.


Conflict of interest statement

Competing interests: WKO is a paid consultant to Astellas, Astra Zeneca, Bayer, Janssen, Sanofi, Sema4, and TeneoBio.

Figures

Figure 1
Figure 1
In-hospital mortality rates of COVID-19 patients breakdown by self-reported races and age groups. In-hospital mortality rate is defined by the number of deceased patients during hospitalisation divided by the total number of COVID-19 patients and PUIs in our cohort. The mortality rates of different age groups are plotted across different racial groups indicated in the legend. The 95% CIs for the mortality rates across race groups are estimated using bootstrap by sampling the patients in that a rolling 10-year age window 500 times. There is non-significant differences in age-adjusted in-hospital mortality rates across all racial groups (p=0.068). PUIs, patient under investigation.
Figure 2
Figure 2
Coefficients from logistic regression models analysing covariates associated with final outcomes (recovered vs deceased) for COVID-19 patients. The estimated coefficients from the logistic regression model, also known as log odds, are plotted for the covariates. An intercept term was included in the model but excluded from the plot, which has a coefficient of −2.07 (p=0.72). Error bars indicate 95% CI. BMI, body mass index; BP, blood pressure; COPD, chronic obstructive pulmonary disease; ICU, intensive care unit; WCC, white cell count.
Figure 3
Figure 3
Cumulative incidence functions of two events, deceased and discharged, with univariate competing risks modelling. The left panels show the cumulative probability of in-hospital death for COVID-19 patients whereas the right panels show the cumulative probability of discharged after inpatient stay. The cohort was grouped by different factors including self-reported races, sex, inpatient stays at different Mount Sinai facilities and care area types, shown in rows a through D. The p values from Gray’s test which comparing the subdistribution for deceased and discharge events across groups are shown. A significant p<0.05 indicates significant differences among groups in the cumulative incidence functions for the corresponding events. ICU, intensive care unit.
Figure 4
Figure 4
HR plots showing the results from the aetiological model. The HR from the cause-specific hazard model with competing risks (death (A) and recovered (B)) are plotted for individual covariates in logarithmic scale. The estimated HR and p values are indicated in the tick labels for those covariates. Covariates with significant elevated HR (HR >1 and p<0.05) or decreased HR (HR <1 and p<0.05) are highlighted in red and blue, respectively. Error bars indicate 95% CI. BMI, body mass index; BP, blood pressure; COPD, chronic obstructive pulmonary disease; ICU, intensive care unit; WCC, white cell count.
Figure 5
Figure 5
HR plots showing the results from the prognostic model. The HR from the subdistribution hazard model with competing risks (death (A) and recovered (B)) are plotted for individual covariates in logarithmic scale. The estimated HR and p values are indicated in the tick labels for those covariates. Covariates with significant elevated HR (HR >1 and p<0.05) or decreased HR (HR <1 and p<0.05) are highlighted in red and blue, respectively. Error bars indicate 95% CIs. BMI, body mass index; BP, blood pressure; COPD, chronic obstructive pulmonary disease; ICU, intensive care unit; WCC, white cell count.

References

    1. Dong E, Du H, Gardner L. An interactive web-based dashboard to track COVID-19 in real time. Lancet Infect Dis 2020;20:533–4. 10.1016/S1473-3099(20)30120-1 - DOI - PMC - PubMed
    1. Gudbjartsson DF, Helgason A, Jonsson H, et al. . Spread of SARS-CoV-2 in the Icelandic population. N Engl J Med 2020;382:2302–15. 10.1056/NEJMoa2006100 - DOI - PMC - PubMed
    1. Tang W, Cao Z, Han M, et al. . Hydroxychloroquine in patients with COVID-19: an open-label, randomized, controlled trial. medRxiv 2020.
    1. Health NDo Age adjusted rate of fatal lab confirmed COVID-19 cases per 100,000 by race/ethnicity group, 2020. Available: https://www1.nyc.gov/assets/doh/downloads/pdf/imm/covid-19-deaths-race-e...[Accessed 27 Jul 2020].
    1. Petrilli CM, Jones SA, Yang J, et al. . Factors associated with hospitalization and critical illness among 4103 patients with COVID-19 disease in New York City. medRxiv 2020.

Publication types

MeSH terms

LinkOut - more resources