. 2020 Nov 10;117(45):28463-28474.
doi: 10.1073/pnas.2013250117. Epub 2020 Oct 27.

Time cells in the human hippocampus and entorhinal cortex support episodic memory

Affiliations

Time cells in the human hippocampus and entorhinal cortex support episodic memory

Gray Umbach et al. Proc Natl Acad Sci U S A. .

Abstract

The organization of temporal information is critical for the encoding and retrieval of episodic memories. In the rodent hippocampus and entorhinal cortex, evidence accumulated over the last decade suggests that populations of "time cells" in the hippocampus encode temporal information. We identify time cells in humans using intracranial microelectrode recordings obtained from 27 human epilepsy patients who performed an episodic memory task. We show that time cell activity predicts the temporal organization of retrieved memory items. We also uncover evidence of ramping cell activity in humans, which represents a complementary type of temporal information. These findings establish a cellular mechanism for the representation of temporal information in the human brain needed to form episodic memories.

Keywords: human electrophysiology; medial temporal lobe; theta precession; time cells.


Conflict of interest statement

The authors declare no competing interest.

Figures

Fig. 1.
Fig. 1.
Task and performance. (A) Free recall task. (B) Noise-subtracted and band-passed (300- to 1,000-Hz) signal from four different channels used for single-unit isolation. (C) Noise-subtracted and low-passed (<300-Hz) signal. (D) Mean waveforms of time cells extracted from the channels displayed in B. (E) Recall performance by encoding list serial position for all recording sessions with 15-word lists (n = 18). (F) The same as D but for all recording sessions with 12-word lists (n = 6). Shaded regions represent ±1 SD. (G) Conditional response probability (CRP) vs. serial position lag demonstrating the increased likelihood of consecutively recalling items encoded at temporally adjacent serial positions.
Fig. 2.
Fig. 2.
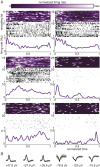
Time cells activate at specific moments during memory encoding. (A) Six examples of encoding time cells. Spike heat map (Top), spike raster (Middle), and PSTH (Bottom) plotted against normalized encoding list time. (B) Mean spike waveforms and peak voltages of cells whose data are display in A. From left to right, waveforms in B correspond to cells in A from Top Left to Bottom Right. The x axis represents normalized time, with zero marking the beginning of the encoding list and one the end. Encoding lists lasted from 30 to 40 s and were nearly equivalent across lists for each subject.
Fig. 3.
Fig. 3.
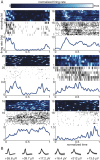
Time cells activate at specific moments during memory retrieval. (A) Six examples of retrieval time cells. Spike heat map (Top), spike raster (Middle), and PSTH (Bottom) plotted against normalized retrieval period time. (B) Mean spike waveforms and peak voltages of cells whose data are display in A. From left to right, waveforms in B correspond to cells in A from Top Left to Bottom Right. The x axis represents normalized time, with zero marking the beginning of the retrieval period and one the end. Retrieval periods lasted either 30 or 45 s but were consistent for each subject.
Fig. 4.
Fig. 4.
Overlapping but distinct encoding and retrieval time cell ensembles. (A) Encoding time cell firing rate heat map with rows organized by the time of the peak in the PSTH. (B) Retrieval time cell firing rate heat map with rows organized by the time of the peak in the PSTH. (C) Count of hippocampal encoding and retrieval time cells with a time field covering each time bin. (D) Count of entorhinal encoding and retrieval time cells with a time field covering each time bin. (E) Overlap between encoding and retrieval time cell populations. (F) Correlation between the peak firing rate time bin during the encoding period and the peak firing rate time bin during the retrieval period for time cells active during both memory behavior epochs. n.s., not significant.
Fig. 5.
Fig. 5.
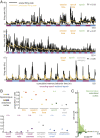
The entorhinal cortex is enriched in cells that track time at multiple timescales simultaneously. (A) Three examples of ramping cells. The actual and model-predicted firing rates for each cell are superimposed. Data are from encoding (purple bars under axes) and retrieval periods (blue bars under axes). The model R2 and added predictors are displayed to the top right of each cell's firing rate curve. (B) Comparison of the fraction of hippocampal and entorhinal cells’ firing rate predicted by each variable. (C) Histogram of the model R2 values for hippocampal (light green) and entorhinal (dark green) populations. n.s., not significant. *P < 0.05; **P < 0.01.
Fig. 6.
Fig. 6.
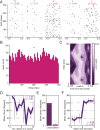
Time cells demonstrate theta-phase precession during memory encoding. (A) Example phase–time plots for five example encoding time cells in their preferred time field. The circular–linear correlation coefficient value is shown above (29). (B) Phase histogram of spikes falling within the central 25% of the time fields of all encoding time cells demonstrating precession. (C) Heat map of spike counts obtained by superimposing the central 25% (centered on the time of peak time cell activity) of the phase–time plots from all encoding time cells demonstrating significant precession. (D) Correlation between encoding time cell firing rate and spike phase (22). Error bars represent the 95% CI. (E) Circular mean phase at onset of spike acceleration (dark purple) compared with circular mean phase at offset of spike deceleration (Materials and Methods). (F) Correlation between spike rate derivative (acceleration) and spike phase. Error bars represent the 95% CI. *P < 0.05; **P < 0.01.
Fig. 7.
Fig. 7.
Time cell stability promotes temporal clustering and influences which serial positions are recalled. (A and B) Illustration of calculating ρ and TCF. (A) Single-cell example of the correlation between time cell firing pattern similarity (list similarity [LS]) and temporal clustering (TCF). (B) Scatterplot demonstrating a positive list-level association between LS and TCF for the example neuron from A. ρ equals the average LS. (C) Comparison of mean session-wide temporal clustering between cells with high and low ρ. Bars represent mean values, and error bars represent the SEM. (D) Comparison of mean session-wide in-field performance between cells with high and low ρ. Bars represent mean values, and error bars represent the SEM. (E) Comparison of mean session-wide performance between cells with high and low ρ. Bars represent mean values, and error bars represent the SEM. n.s., not significant. *P < 0.05.

Similar articles

Cited by

References

    1. Pastalkova E., Itskov V., Amarasingham A., Buzsáki G., Internally generated cell assembly sequences in the rat hippocampus. Science 321, 1322–1327 (2008). - PMC - PubMed
    1. MacDonald C. J., Lepage K. Q., Eden U. T., Eichenbaum H., Hippocampal “time cells” bridge the gap in memory for discontiguous events. Neuron 71, 737–749 (2011). - PMC - PubMed
    1. Kraus B. J., Robinson R. J. II, White J. A., Eichenbaum H., Hasselmo M. E., Hippocampal “time cells”: Time versus path integration. Neuron 78, 1090–1101 (2013). - PMC - PubMed
    1. MacDonald C. J., Carrow S., Place R., Eichenbaum H., Distinct hippocampal time cell sequences represent odor memories in immobilized rats. J. Neurosci. 33, 14607–14616 (2013). - PMC - PubMed
    1. Kraus B. J., et al. , During running in place, grid cells integrate elapsed time and distance run. Neuron 88, 578–589 (2015). - PMC - PubMed

Publication types

LinkOut - more resources