. 2020 Nov 10;117(45):28422-28432.
doi: 10.1073/pnas.2011884117. Epub 2020 Oct 27.

Evolution of regulatory signatures in primate cortical neurons at cell-type resolution

Affiliations

Evolution of regulatory signatures in primate cortical neurons at cell-type resolution

Alexey Kozlenkov et al. Proc Natl Acad Sci U S A. .

Abstract

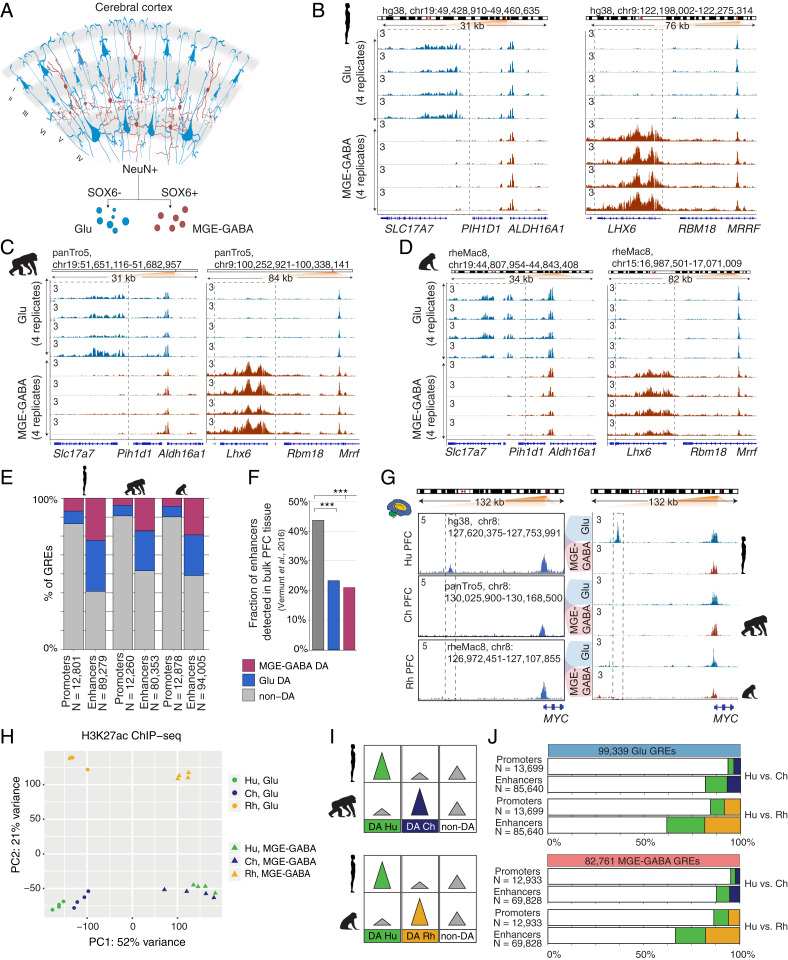
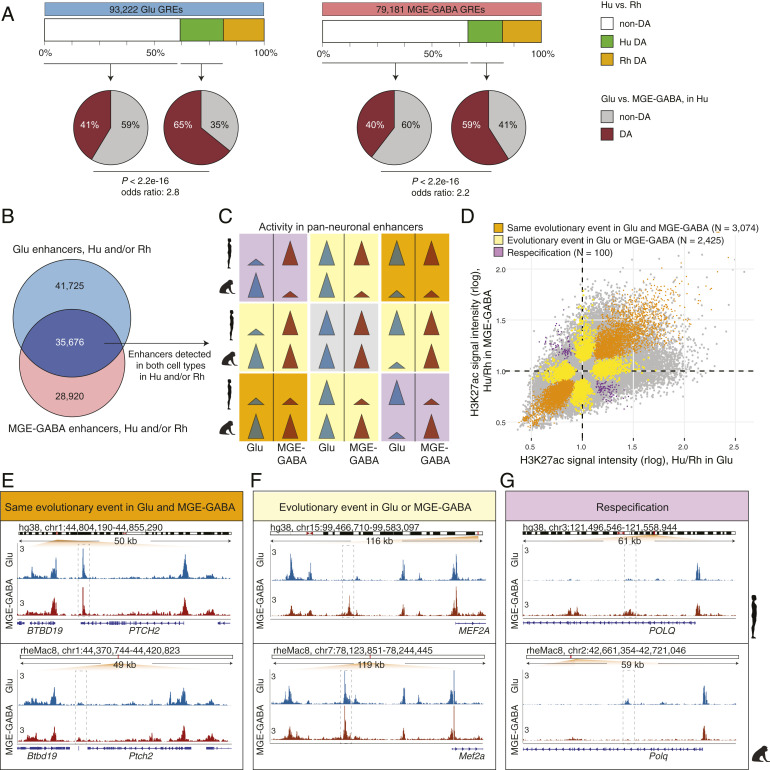
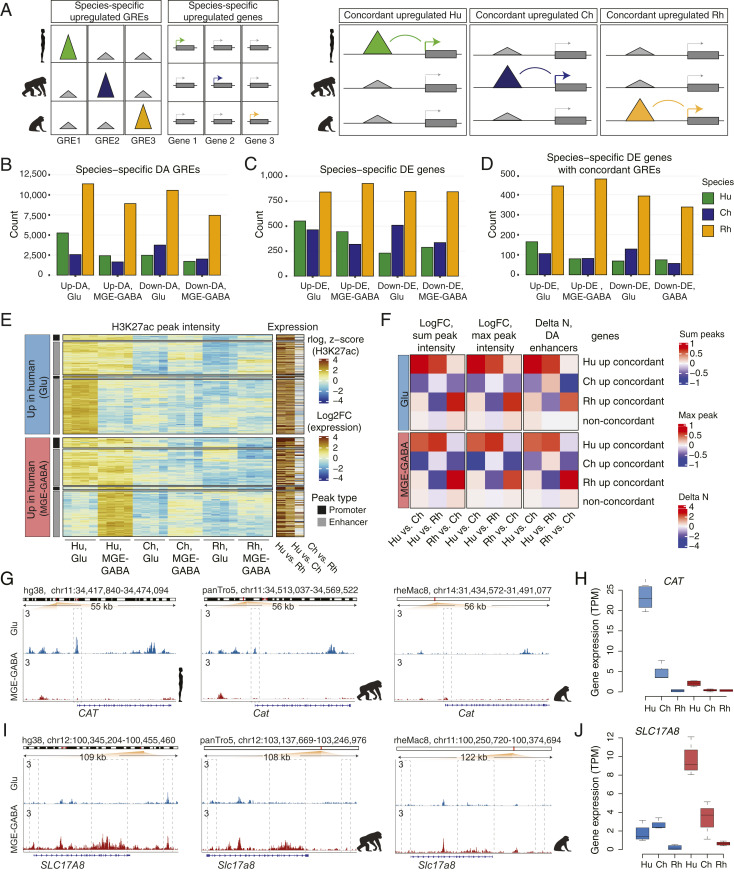
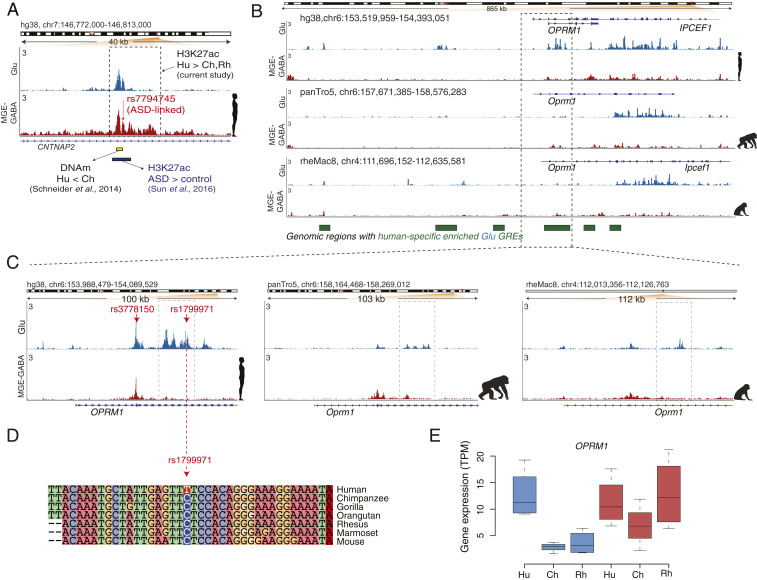
The human cerebral cortex contains many cell types that likely underwent independent functional changes during evolution. However, cell-type-specific regulatory landscapes in the cortex remain largely unexplored. Here we report epigenomic and transcriptomic analyses of the two main cortical neuronal subtypes, glutamatergic projection neurons and GABAergic interneurons, in human, chimpanzee, and rhesus macaque. Using genome-wide profiling of the H3K27ac histone modification, we identify neuron-subtype-specific regulatory elements that previously went undetected in bulk brain tissue samples. Human-specific regulatory changes are uncovered in multiple genes, including those associated with language, autism spectrum disorder, and drug addiction. We observe preferential evolutionary divergence in neuron subtype-specific regulatory elements and show that a substantial fraction of pan-neuronal regulatory elements undergoes subtype-specific evolutionary changes. This study sheds light on the interplay between regulatory evolution and cell-type-dependent gene-expression programs, and provides a resource for further exploration of human brain evolution and function.

Keywords: GABAergic neurons; H3K27ac histone modification; glutamatergic neurons; primate evolution; regulatory elements.


Conflict of interest statement

The authors declare no competing interest.

Figures

Fig. 1.
Fig. 1.
Regulatory changes in Glu and MGE-GABA neurons during primate evolution. (A) Schematic of isolation of Glu and MGE-GABA nuclei. (B–D) H3K27ac ChIP-seq profiles for Hu (B), Ch (C), and Rh (D) at the loci of Glu (SLC17A7, Left) and MGE-GABA (LHX6, Right) markers. Read per million (RPM)-normalized reads (axis limit 3 RPM). (E) Fractions of promoters or enhancers that are Glu DA, MGE-GABA DA or non-DA in Glu vs. MGE-GABA. (F) Fractions of Glu DA, MGE-GABA DA, and non-DA Hu enhancers that overlap GREs in bulk prefrontal cortex (PFC) tissue (12). ***P < 0.0005 (Fisher’s exact test). (G) The regulatory landscapes near the MYC locus in bulk PFC (12) (Left) and in Glu and MGE-GABA neurons (Right). (H) PCA of ChIP-seq data for Glu and MGE-GABA neurons from Hu, Ch, and Rh. (I) Schematic of pairwise interspecies comparisons between the ChIP-seq datasets. (J) Fractions of Glu DA, MGE-GABA DA, and non-DA GREs in pairwise species comparisons; Glu (Upper) and MGE-GABA (Lower) neurons.
Fig. 2.
Fig. 2.
Evolutionary changes in neuron subtype-specific and pan-neuronal regulatory elements. (A) Cell type specificity of Hu > Rh DA (green boxes) or non-DA (white boxes) GREs. GREs detected in Glu (Left) or MGE-GABA (Right) neurons in Hu and/or Rh. Pie charts indicate fractions of DA (brown) or non-DA (gray) GREs between neuronal subtypes in Hu. In both neuronal subtypes, Hu > Rh DA GREs were more often neuron-subtype-specific than non-DA GREs (P < 2.2e-16; Fisher’s exact test). (B) Venn diagram of the overlap between Glu and MGE-GABA enhancers in Hu and/or Rh. The overlapping enhancers (dark blue) are positionally shared in Glu and MGE-GABA neurons (pan-neuronal). (C) Schematic of possible evolutionary changes in pan-neuronal enhancers in Hu and/or Rh. Gray, no evolutionary change in any neuronal subtype; orange, same direction of an evolutionary change in both subtypes; yellow, an evolutionary change in only one subtype; purple, different direction of an evolutionary change between subtypes (respecification). (D) Simultaneous cross-species and cross-cell–type analysis of H3K27ac signal intensities for pan-neuronal enhancers in Hu and/or Rh (Methods and SI Appendix, Fig. S2C). Shown are DA GREs confirmed by the analysis to undergo the type of an evolutionary change described in C. (EG) Examples of enhancers (dashed boxes) with the same direction of evolutionary change in Glu and MGE-GABA (E, the PTCH2 locus), with an evolutionary change in only one neuronal subtype, MGE-GABA (F, near MEF2A), and with evolutionary changes in opposite directions in Glu and MGE-GABA neurons (respecification) (G, the POLQ locus).
Fig. 3.
Fig. 3.
Concordant evolutionary changes in GREs and gene expression. (A) Schematic of the analysis of association between species-specific up-regulated GREs and genes. (Left) identification of species-specific DA GREs and DE genes. (Right) identification of concordant pairs of species-specific up-regulated DA GREs and DE genes. (B) Numbers of species-specific up-regulated or down-regulated DA GREs detected in Glu or MGE-GABA neurons. (C) Numbers of species-specific up-regulated or down-regulated DE genes. (D) Numbers of species-specific DE genes with concordant species-specific DA GREs. (E) Heatmap of H3K27ac signal intensities and interspecies changes in gene expression for concordant pairs of Hu-specific up-DA GREs and up-DE genes. Shown are concordant GRE-gene pairs in Glu (Upper) and MGE-GABA (Lower). K-means clustering of the H3K27ac signal in individual Hu, Ch, and Rh samples resulted in two major clusters for each neuronal subtype, corresponding to neuron-subtype-specific or nonspecific GREs. Concordant promoter- and enhancer-gene pairs are shown separately for each cluster. Heatmap colors indicate normalized H3K27ac signal intensities (rlog) for each replicate sample and log2 FC of normalized RNA-seq reads (transcripts per million, TPM). (F) Mean interspecies changes of quantitative features of gene regulatory domains. The features are detailed on the top of the panel. Shown are data for species-specific up-regulated concordant genes and for non-concordant genes. (G and H) Evolutionary changes in regulation (G) and expression (H) for the CAT gene. (I and J) Same as in G and H for the SLC17A8 gene.
Fig. 4.
Fig. 4.
Human-specific up-regulated GREs harbor genes implicated in language, ASD, and opioid addiction. (A) Evolutionary regulatory (H3K27ac and DNA methylation) and ASD-associated changes at an enhancer within the CNTNAP2 locus in humans (also see SI Appendix, Fig. S4B). The enhancer (shown in a dashed box) is located within the second intron of CNTNAP2 and shows human-specific up-regulation of the H3K27ac signal in MGE-GABA neurons. Shown are: ASD-associated SNP rs7794745 (red arrow) (59), the region with the largest decrease in DNA methylation (DNAm) in Hu vs. Ch (green bar) (53), and the position of an H3K27ac peak (brown bar) that is up-regulated in ASD vs. control subjects (55). (B) The OPRM1 locus shows a high density of Glu human-specific up-DA GREs (the regions marked as green boxes depict areas with one or several Hu up-DA GREs). The leftmost region exemplifies an evolutionary respecification change from a Rh-enriched enhancer in MGE-GABA to a Hu-enriched enhancer in Glu. (C) H3K27ac profiles within the OPRM1 locus in three species and two neuronal subtypes. Evolutionary regulatory changes were found within the 5′ region, including human up-regulated promoter and enhancer GREs. The opioid abuse-associated SNPs rs3778150 and rs1799971 (red arrows) overlap with a human-specific up-DA promoter and human-specific up-DA enhancer, respectively. (D) Genomic alignment of the 40-bp region centered on the rs1799971 SNP in humans. The human-specific nucleotide substitution at the SNP position (C → T) is highlighted. Notice a high level of sequence conservation in the immediate vicinity of the SNP. The C nucleotide in humans represents the minor allele, which has been associated with opioid abuse (65). (E) Evolutionary changes in gene expression of OPRM1 in Glu neurons. Gene-expression changes were concordant with the regulatory changes, suggesting human-specific and Glu-specific up-regulation of OPRM1.

References

    1. Bonelli R. M., Cummings J. L., Frontal-subcortical circuitry and behavior. Dialogues Clin. Neurosci. 9, 141–151 (2007). - PMC - PubMed
    1. Sousa A. M. M., Meyer K. A., Santpere G., Gulden F. O., Sestan N., Evolution of the human nervous system function, structure, and development. Cell 170, 226–247 (2017). - PMC - PubMed
    1. Ma T. et al., Subcortical origins of human and monkey neocortical interneurons. Nat. Neurosci. 16, 1588–1597 (2013). - PubMed
    1. Hendry S. H., Schwark H. D., Jones E. G., Yan J., Numbers and proportions of GABA-immunoreactive neurons in different areas of monkey cerebral cortex. J. Neurosci. 7, 1503–1519 (1987). - PMC - PubMed
    1. Torres-Gomez S. et al., Changes in the proportion of inhibitory interneuron types from sensory to executive areas of the primate neocortex: Implications for the origins of working memory representations. Cereb. Cortex 30, 4544–4562 (2020). - PMC - PubMed

Publication types