. 2020 Nov 10;117(45):28183-28190.
doi: 10.1073/pnas.2011515117. Epub 2020 Oct 27.

Floristic evidence for alternative biome states in tropical Africa

Affiliations

Floristic evidence for alternative biome states in tropical Africa

J C Aleman et al. Proc Natl Acad Sci U S A. .

Abstract

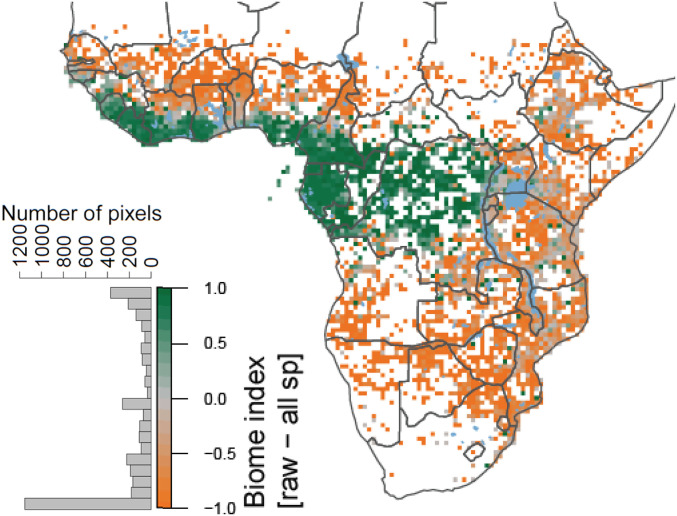
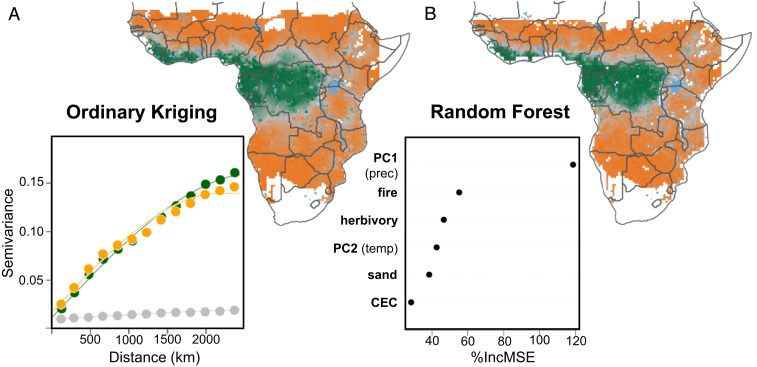
The idea that tropical forest and savanna are alternative states is crucial to how we manage these biomes and predict their future under global change. Large-scale empirical evidence for alternative stable states is limited, however, and comes mostly from the multimodal distribution of structural aspects of vegetation. These approaches have been criticized, as structure alone cannot separate out wetter savannas from drier forests for example, and there are also technical challenges to mapping vegetation structure in unbiased ways. Here, we develop an alternative approach to delimit the climatic envelope of the two biomes in Africa using tree species lists gathered for a large number of forest and savanna sites distributed across the continent. Our analyses confirm extensive climatic overlap of forest and savanna, supporting the alternative stable states hypothesis for Africa, and this result is corroborated by paleoecological evidence. Further, we find the two biomes to have highly divergent tree species compositions and to represent alternative compositional states. This allowed us to classify tree species as forest vs. savanna specialists, with some generalist species that span both biomes. In conjunction with georeferenced herbarium records, we mapped the forest and savanna distributions across Africa and quantified their environmental limits, which are primarily related to precipitation and seasonality, with a secondary contribution of fire. These results are important for the ongoing efforts to restore African ecosystems, which depend on accurate biome maps to set appropriate targets for the restored states but also provide empirical evidence for broad-scale bistability.

Keywords: alternative stable states; fire; precipitation and seasonality; tree species composition; tropical biomes.


Conflict of interest statement

The authors declare no competing interest.

Figures

Fig. 1.
Fig. 1.
Climatic envelope of the forest and savanna biomes in Africa. To determine the climatic envelopes of the two tropical biomes, the dominant climatic gradients were first identified with a PCA of gridded climatic variables. (A) Each point corresponds to the center of a 0.5° pixel, with pixels containing floristic surveys in forest (green) and savanna (orange) sites indicated. Red and blue arrows indicate the influence of temperature and precipitation variables, respectively. (B) Distribution of forest (green) and savanna (orange) sites along an axis of MAP (in millimeters). (C) Frequency distribution of forest (green) and savanna (orange) sites along a complex precipitation and seasonality gradient (PC1; A), with the climatic area where savanna and forest both occur plotted in light orange (where savanna is more common) and light green (where forest is more common). The dashed line corresponds to an equal probability of savanna and forest. (D) Map of forest and bistable forest along with bistable savanna and savanna, with the locations of floristic surveys in forest (green) and savanna (orange) sites. White pixels are outside the geographic extent and/or the environmental range covered by the floristic surveys. The latter was defined by a convex hull on the site scores on PC1 and PC2 (dashed line in A). Major water bodies and rivers are shown in blue. The paleoecological data available around the Gulf of Guinea retrieved from published records of lacustrine fossil pollen (n = 24), lacustrine phytoliths (n = 1), phytoliths (n = 4), and δ13C of soil organic matter (n = 14) from soil profiles are shown in Inset. The paleosites provided information on stable (black) and transitional (gray) sites during the Holocene (Dataset S2 has the code correspondence of paleosites).
Fig. 2.
Fig. 2.
Distribution of forest specialist, generalist, and savanna specialist tree species. To test for specialization toward the forest and savanna biomes by individual tree species, we applied the IndVal procedure (50) to the presence matrix of the 1,707 species in the 753 sites (455 forest and 298 savanna sites) and obtained a classification of species into forest specialists (n = 825 species) and savanna specialists (n = 523), with nonsignificant indicators resulting in species being interpreted as generalists (n = 359). For each 0.5° pixel containing herbarium records for at least 5 of our 1,707 species, we computed and mapped the percentage of (A) forest specialists, (B) generalists, and (C) savanna specialists. White pixels thus correspond to a paucity of georeferenced herbarium records for our classified tree species. Major water bodies are shown in blue. The frequency distribution of the number of sites in which (A) forest specialists, (B) generalists, and (C) savanna specialists occurred in the original floristic surveys is given in Inset of each panel, illustrating the higher frequency of extremely infrequent species in the group of generalist species, in comparison with the specialists.
Fig. 3.
Fig. 3.
Spatial distribution of the biome index across Africa. The distributions of forest specialists, generalists, and savanna specialists derived from georeferenced herbarium records were used to devise a biome index based on tree species composition and computed at 0.5° resolution. The biome index tracks the biome specialization of each pixel, with values toward −1 representing the dominance of savanna specialists and values toward +1 representing the dominance of forest specialists. White pixels correspond to a lack of georeferenced herbarium records for our species. Major water bodies are shown in blue. The frequency distribution of the biome index is given in Inset.
Fig. 4.
Fig. 4.
Spatial and environmental predictions of the biome index. We predicted the distribution of the biome index across the climatic space covered by the floristic surveys using (A) spatial information only vs. (B) a random forest approach based on environmental determinants. For the spatial predictions, we interpolated the distribution of the percentage of forest specialists, generalists, and savanna specialists using ordinary kriging and recomputed the biome index. The empirical semivariogram (points) and the spherical semivariogram model (lines) used for kriging and shown in A, Inset indicate that the spatial structure of generalist species is weaker and more homogeneous than that of forest and savanna specialists. For the environmental predictions of the biome index, we used climate (described by PC1 and PC2) (Fig. 1A), fire, herbivory (total biomass of both livestock and wild herbivores), and soil factors (described by the percentage of sand and cation exchange capacity, CEC, in the first 0 to 5 cm). The relative importance of each environmental determinant is shown in B, Inset. The importance (percentage increase in mean squared error, MSE) tests how the accuracy of the results is affected if the input variable is randomly permuted. White pixels in A correspond to areas outside the geographical extent and the environmental range covered by the floristic surveys. White pixels in B additionally contain pixels for which herbivory data were not available (coastal edge and edge of inland water bodies). Major water bodies are shown in blue.

References

    1. Ratnam J., et al. , When is a ‘forest’ a savanna, and why does it matter? Glob. Ecol. Biogeogr. 20, 653–660 (2011).
    1. Lehmann C. E., Archibald S. A., Hoffmann W. A., Bond W. J., Deciphering the distribution of the savanna biome. New Phytol. 191, 197–209 (2011). - PubMed
    1. Staver A. C., Archibald S., Levin S. A., The global extent and determinants of savanna and forest as alternative biome states. Science 334, 230–232 (2011). - PubMed
    1. Silva de Miranda P. L., et al. , Using tree species inventories to map biomes and assess their climatic overlaps in lowland tropical South America. Glob. Ecol. Biogeogr. 27, 899–912 (2018).
    1. Hirota M., Holmgren M., Van Nes E. H., Scheffer M., Global resilience of tropical forest and savanna to critical transitions. Science 334, 232–235 (2011). - PubMed

Publication types