. 2020 Oct 27;11(1):5411.
doi: 10.1038/s41467-020-19238-2.

Disease burden and clinical severity of the first pandemic wave of COVID-19 in Wuhan, China

Affiliations

Disease burden and clinical severity of the first pandemic wave of COVID-19 in Wuhan, China

Juan Yang et al. Nat Commun. .

Abstract

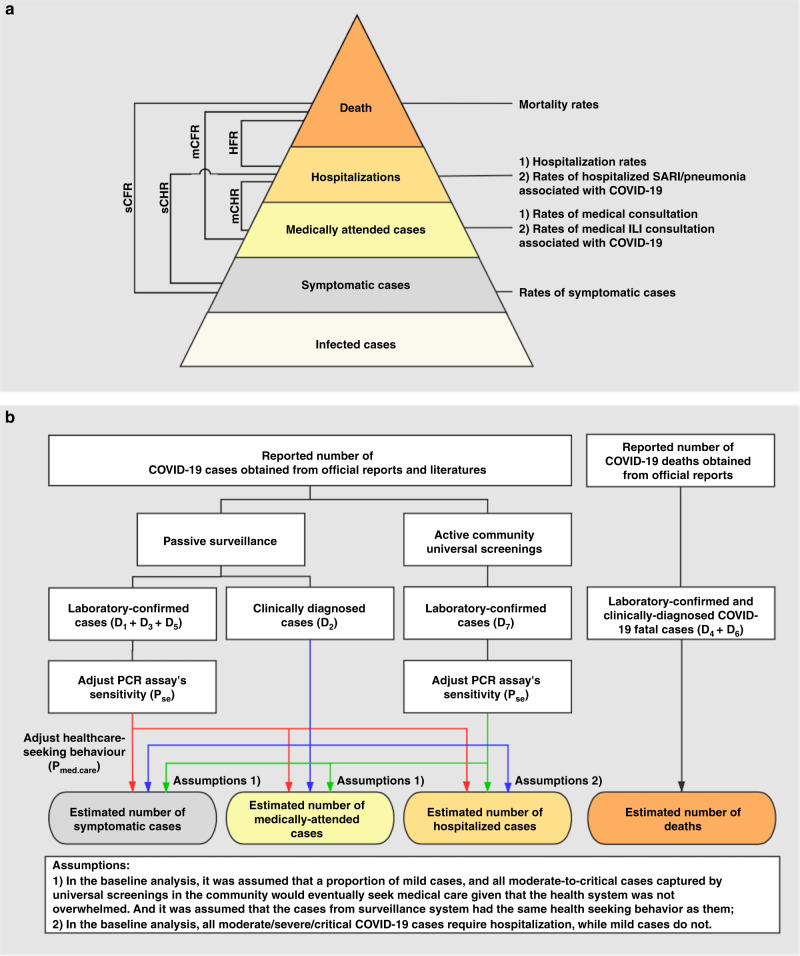
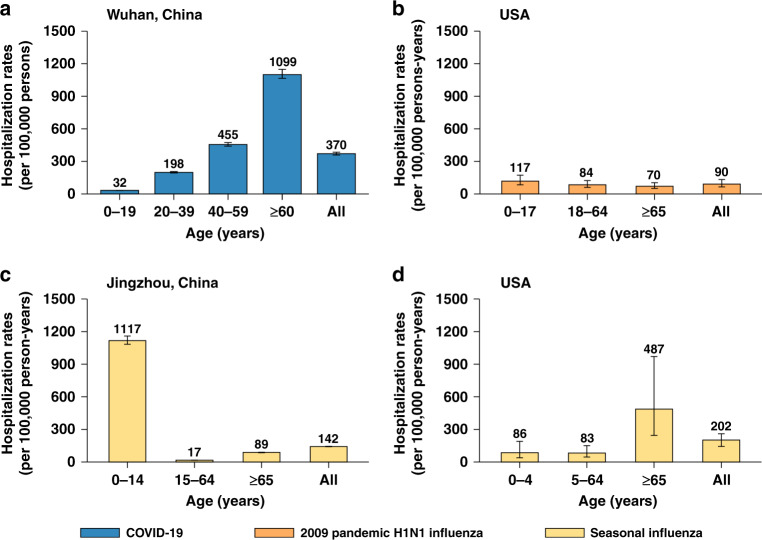
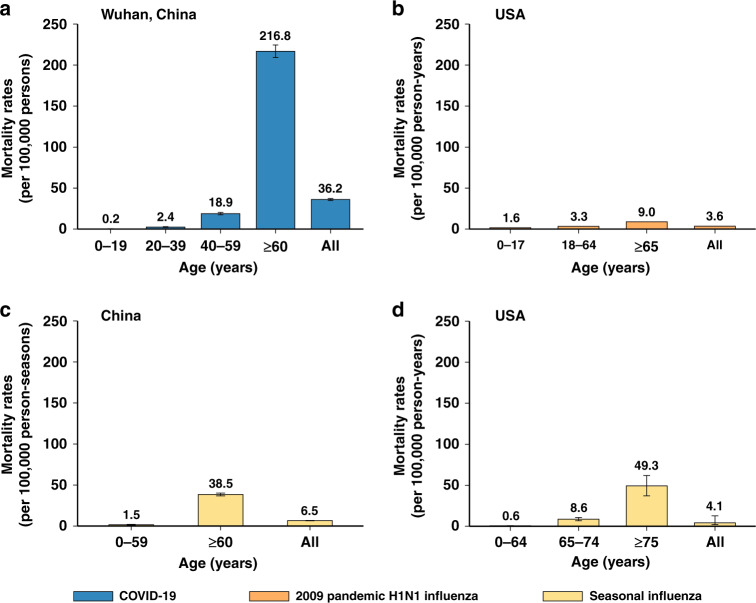
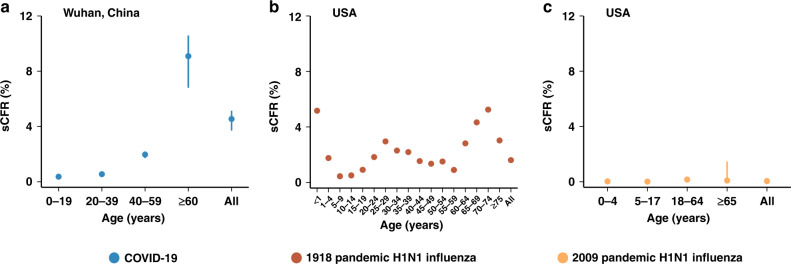
The novel coronavirus disease 2019 (COVID-19) was first reported in Wuhan, China, where the initial wave of intense community transmissions was cut short by interventions. Using multiple data sources, here we estimate the disease burden and clinical severity by age of COVID-19 in Wuhan from December 1, 2019 to March 31, 2020. Our estimates account for the sensitivity of the laboratory assays, prospective community screenings, and healthcare seeking behaviors. Rates of symptomatic cases, medical consultations, hospitalizations and deaths were estimated at 796 (95% CI: 703-977), 489 (472-509), 370 (358-384), and 36.2 (35.0-37.3) per 100,000 persons, respectively. The COVID-19 outbreak in Wuhan had a higher burden than the 2009 influenza pandemic or seasonal influenza in terms of hospitalization and mortality rates, and clinical severity was similar to that of the 1918 influenza pandemic. Our comparison puts the COVID-19 pandemic into context and could be helpful to guide intervention strategies and preparedness for the potential resurgence of COVID-19.


Conflict of interest statement

M.A. has received research funding from Seqirus and H.Y. has received research funding from Sanofi Pasteur, GlaxoSmithKline, Yichang HEC Changjiang Pharmaceutical Company, and Shanghai Roche Pharmaceutical Company. None of those research funding is related to COVID-19. All other authors report no competing interests.

Figures

Fig. 1
Fig. 1. Severity levels of COVID-19 and schematic diagram of the baseline analyses.
a Severity levels of infections with SARS-CoV-2 and parameters of interest. Each level is assumed to be a subset of the level below. sCFR symptomatic case-fatality risk, sCHR symptomatic case-hospitalization risk, mCFR medically attended case-fatality risk, mCHR medically attended case-hospitalization risk, HFR hospitalization-fatality risk. b Schematic diagram of the baseline analyses. Data source of COVID-19 cases in Wuhan: D1) 32,583 laboratory-confirmed COVID-19 cases as of March 8, D2) 17,365 clinically-diagnosed COVID-19 cases during February 9–19, D3)daily number of laboratory-confirmed cases on March 9–April 24, D4) total number of COVID-19 deaths as of April 24 obtained from the Hubei Health Commission, D5) 325 laboratory-confirmed cases and D6) 1290 deaths were added as of April 16 through a comprehensive and systematic verification by Wuhan Authorities, and D7) 16,781 laboratory-confirmed cases identified through universal screening,. Pse: RT-PCR sensitivity. Pmed.care: proportion of seeking medical assistance among patients suffering from acute respiratory infections. (Red, blue, and green arrows separately denote the data flow from laboratory-confirmed cases of passive surveillance, clinically-diagnosed cases, and laboratory-confirmed cases of active screenings).
Fig. 2
Fig. 2. Rates of symptomatic cases and of medical consultation rates by age group (mean, 95% CI).
a Rates of medical consultation associated with COVID-19 in Wuhan, China. The error bars presented 95% CI as estimated using Monte Carlo sampling (10,000 samples from Binomial distributions). b Rates of medical consultation associated with 2009 pandemic H1N1 influenza, China. c Rates of medical consultation associated with 2009 pandemic H1N1 influenza, USA. d Seasonal influenza-associated excess ILI outpatient consultations rates, China. e Rates of medical consultation associated with seasonal influenza, USA.
Fig. 3
Fig. 3. Hospitalization rates.
a Rates of hospitalization associated with COVID-19 in Wuhan, China (mean, 95% CI). The error bars presented 95% CI as estimated using Monte Carlo sampling (10,000 samples from Binomial distributions). b Rates of hospitalization associated with 2009 pandemic H1N1 influenza, USA (median, range) c Rates of hospitalization associated with seasonal influenza related SARI in Jingzhou, Hubei province, China (median, range). d Rates of hospitalization associated with seasonal influenza, USA (mean, 95% CI),.
Fig. 4
Fig. 4. Mortality rates.
a Rates of mortality associated with COVID-19 in Wuhan, China (mean, 95% CI). The error bars presented 95% CI as estimated using Monte Carlo sampling (10,000 samples from Binomial distributions). b Rates of mortality associated with 2009 pandemic H1N1 influenza, USA (75% percentile). c Excess mortality rates associated with seasonal influenza, China (mean, 95% CI). d Excess mortality rates associated with seasonal influenza, USA (median, 95% credibility interval).
Fig. 5
Fig. 5. Symptomatic case-fatality risk (sCFR).
a sCFR associated with COVID-19 in Wuhan, China (mean, 95% CI). The error bars presented 95% CI as estimated using Monte Carlo sampling (10,000 samples from Binomial distributions). b sCFR associated with 1918 pandemic H1N1 influenza in August–December 1918, USA (mean). c sCFR associated with 2009 pandemic H1N1 influenza, USA (median, 95% CI).

Update of

Similar articles

Cited by

References

    1. Johns Hopkins University. Coronavirus (COVID-19) Information and Updates. https://www.coronavirustraining.org/live-map. Accessed 26 Jul 2020.
    1. Centers for Disease Control and Prevention. Past Pandemics. https://www.cdc.gov/flu/pandemic-resources/basics/past-pandemics.html. Accessed 4 May 2020.
    1. Health Commission of Hubei Province. Daily report on epidemic situation of COVID-19 in Hubei province. (in Chinese). http://wjw.hubei.gov.cn/bmdt/ztzl/fkxxgzbdgrfyyq/xxfb/index.shtml. Accessed Jul 22 2020.
    1. Pan A, et al. Association of public health interventions with the epidemiology of the COVID-19 Outbreak in Wuhan, China. JAMA. 2020;323:1915–1923. doi: 10.1001/jama.2020.6130. - DOI - PMC - PubMed
    1. Zhang J, et al. Evolving epidemiology and transmission dynamics of novel coronavirus disease 2019 outside Hubei Province in China: a descriptive and modeling study. Lancet Infect. Dis. 2020;20:793–802. doi: 10.1016/S1473-3099(20)30230-9. - DOI - PMC - PubMed

Publication types