. 2020 Oct 27;11(1):5424.
doi: 10.1038/s41467-020-19193-y.

Neutrophil-induced ferroptosis promotes tumor necrosis in glioblastoma progression

Affiliations

Neutrophil-induced ferroptosis promotes tumor necrosis in glioblastoma progression

Patricia P Yee et al. Nat Commun. .

Abstract

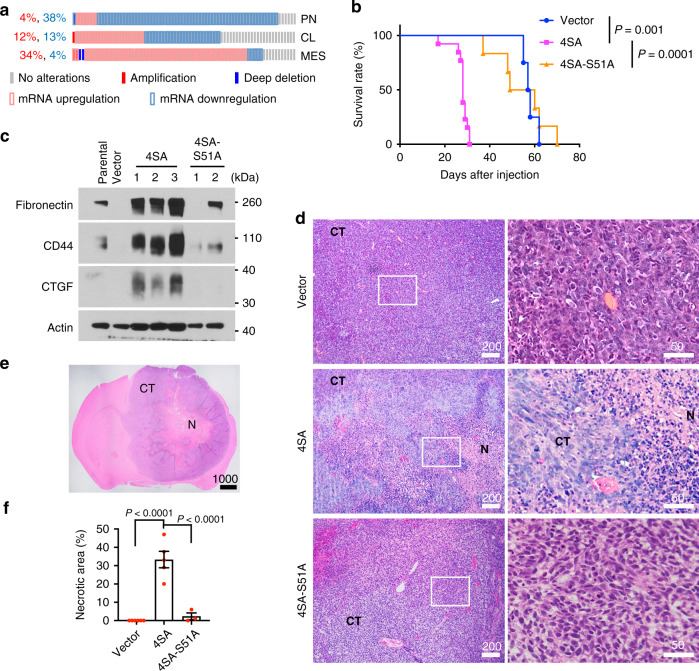
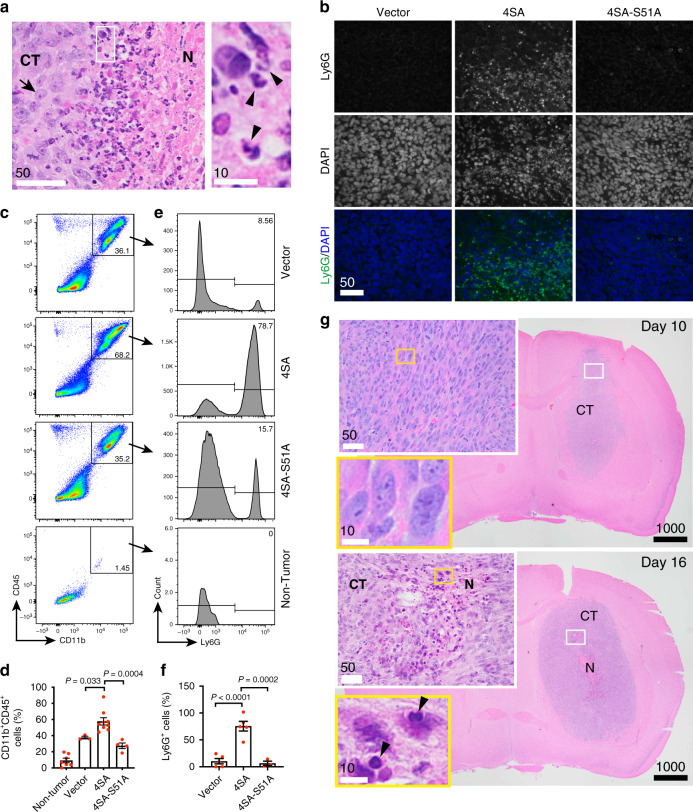
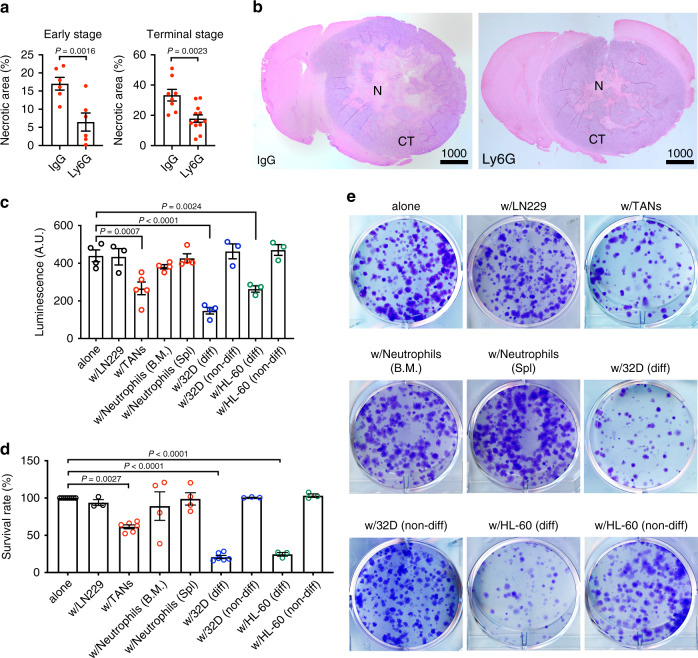
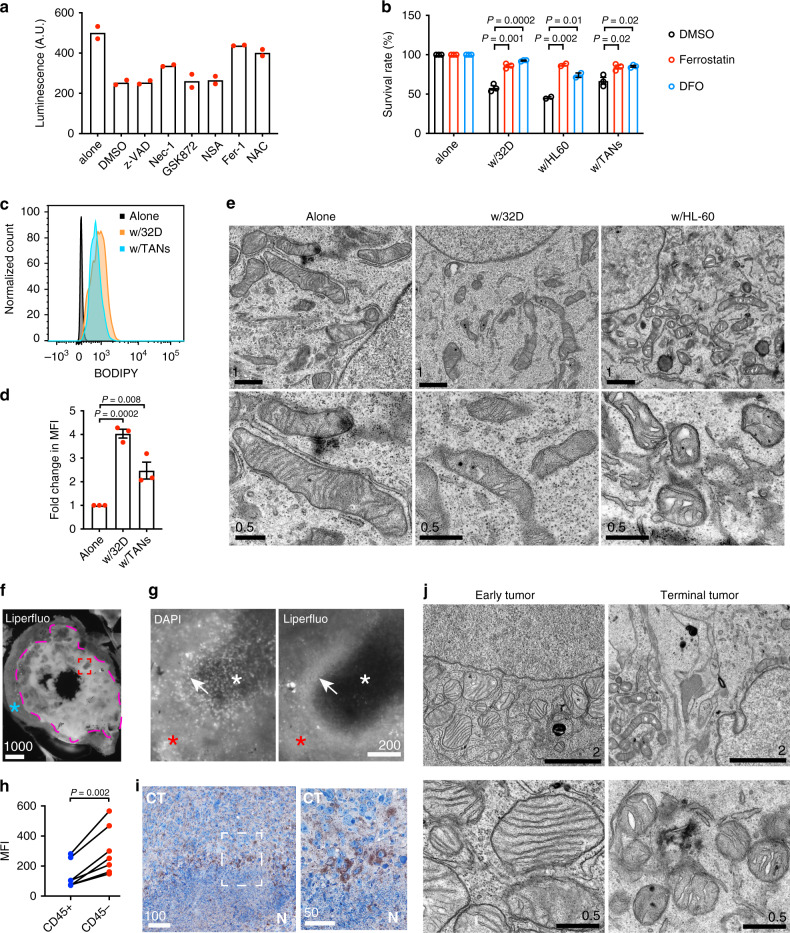
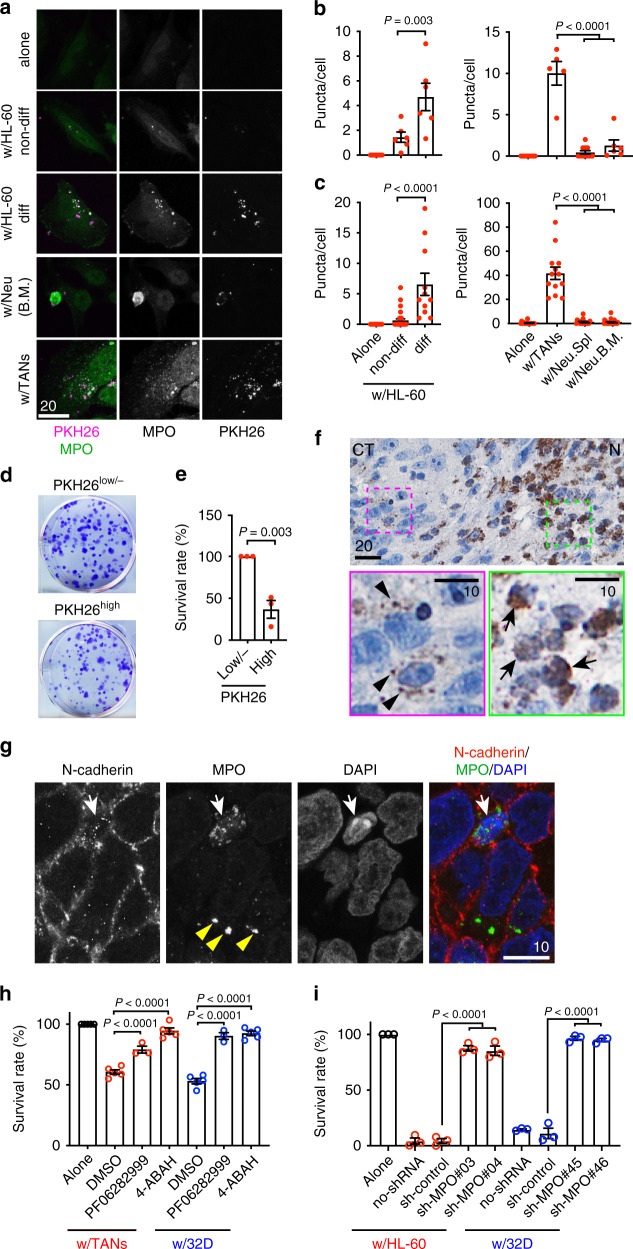
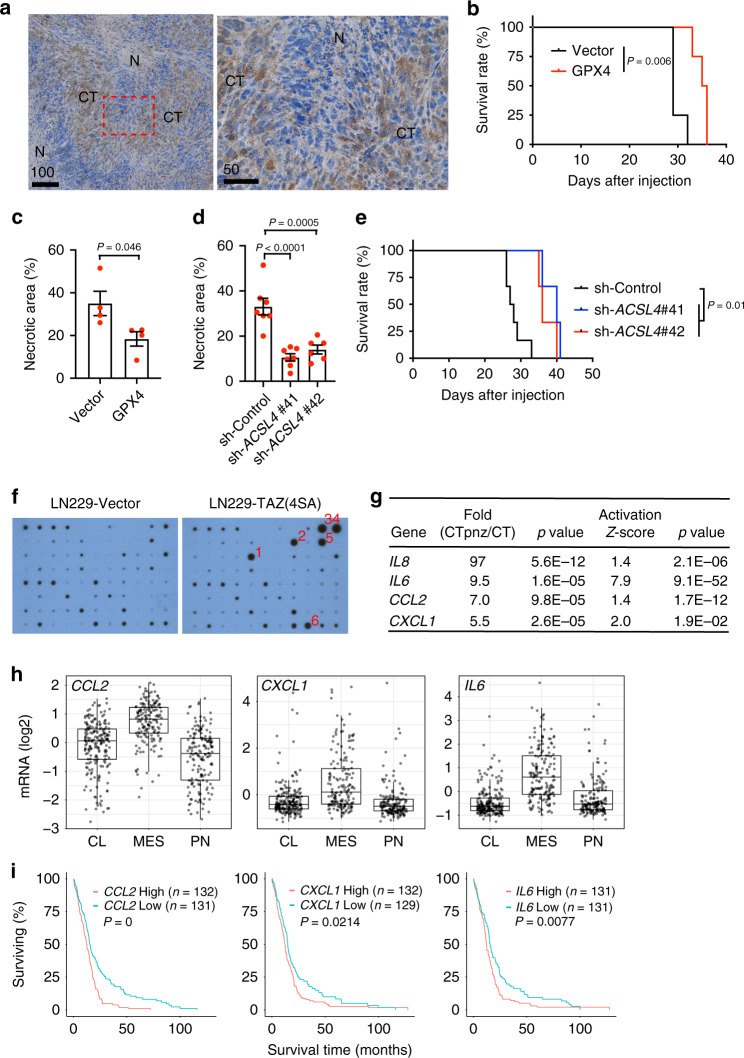
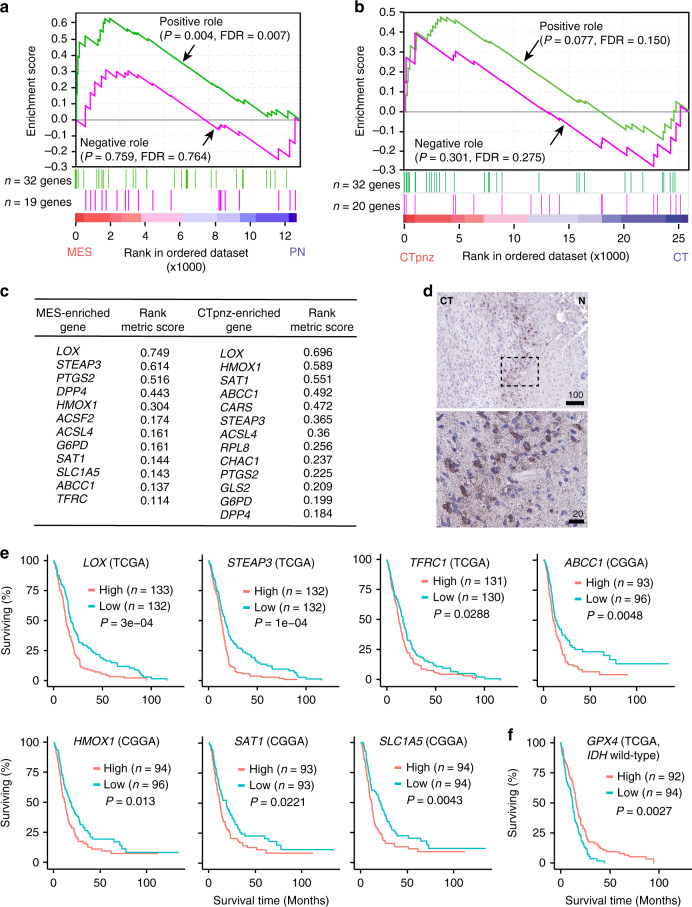
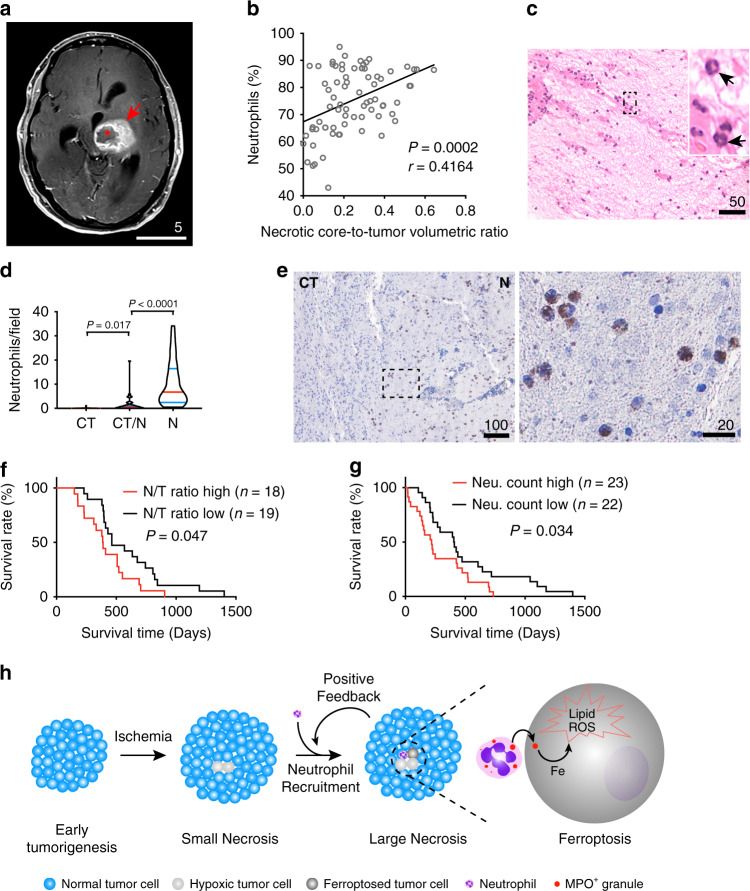
Tumor necrosis commonly exists and predicts poor prognoses in many cancers. Although it is thought to result from chronic ischemia, the underlying nature and mechanisms driving the involved cell death remain obscure. Here, we show that necrosis in glioblastoma (GBM) involves neutrophil-triggered ferroptosis. In a hyperactivated transcriptional coactivator with PDZ-binding motif-driven GBM mouse model, neutrophils coincide with necrosis temporally and spatially. Neutrophil depletion dampens necrosis. Neutrophils isolated from mouse brain tumors kill cocultured tumor cells. Mechanistically, neutrophils induce iron-dependent accumulation of lipid peroxides within tumor cells by transferring myeloperoxidase-containing granules into tumor cells. Inhibition or depletion of myeloperoxidase suppresses neutrophil-induced tumor cell cytotoxicity. Intratumoral glutathione peroxidase 4 overexpression or acyl-CoA synthetase long chain family member 4 depletion diminishes necrosis and aggressiveness of tumors. Furthermore, analyses of human GBMs support that neutrophils and ferroptosis are associated with necrosis and predict poor survival. Thus, our study identifies ferroptosis as the underlying nature of necrosis in GBMs and reveals a pro-tumorigenic role of ferroptosis. Together, we propose that certain tumor damage(s) occurring during early tumor progression (i.e. ischemia) recruits neutrophils to the site of tissue damage and thereby results in a positive feedback loop, amplifying GBM necrosis development to its fullest extent.


Conflict of interest statement

The authors declare no competing interests.

Figures

Fig. 1
Fig. 1. Hyperactivating TAZ promotes GBM MES transition and tumor necrosis.
a The TCGA GBM dataset (Provisional, n = 540 tumors) was grouped into proneural (PN; n = 166 tumors), classical (CL; n = 204 tumors) and mesenchymal (MES; n = 170 tumors) subtypes as defined previously. TAZ expression in each subtype was examined through cBioPortal using U133 microarray only. The z-score threshold was ± 1. b Kaplan–Meier survival curves of mice implanted with LN229 cells stably transduced with empty vector control (n = 4 mice), TAZ4SA (n = 13 mice), or TAZ4SA-S51A (n = 6 mice). Two-sided log-rank test. c Immunoblot of MES markers, including Fibronectin 1, CD44, and connective tissue growth factor (CTGF) in whole-tumor lysates obtained from mice implanted with LN229parental (n = 1 tumor), LN229vector (n = 1 tumor), LN229TAZ(4SA) (n = 3 tumors), or LN229TAZ(4SA-S51A) (n = 2 tumors). d Representative H&E-stained formaldehyde-fixed paraffin-embedded sections obtained from mice implanted with LN229vector (n = 6 tumors), LN229TAZ(4SA) (n = 5 tumors), or LN229TAZ(4SA-S51A) (n = 3 tumors) reaching endpoints at low (left) and high (right) magnifications. Indicated numbers of animals (n) from each condition were examined independently with consistent observations. e Representative H&E-stained formaldehyde-fixed paraffin-embedded section of a typical LN229TAZ(4SA) tumor-bearing brain with clear central tumor necrosis (denoted by N) and cellular tumor (denoted by CT). n = 5 tumors. The number of animals examined independently in each condition is listed above; observations were consistent within each group. f Necrosis-to-tumor area ratios comparison among mice implanted with LN229vector (n = 6 tumors), LN229TAZ(4SA) (n = 5 tumors), or LN229TAZ(4SA-S51A) (n = 3 tumors) using 3–4 step H&E-stained sections (each 50 μm apart) obtained from the same tumor; the average of these ratios was used to represent each tumor. Numerical data are presented as mean ± s.e.m. Each data point represents an animal. Ordinary one-way ANOVA. All scale bars are in μm. Source data are provided as a Source Data file.
Fig. 2
Fig. 2. GBM necrosis is extensively infiltrated with neutrophils.
a Representative high-magnification H&E-stained section obtained from a LN229TAZ(4SA) tumor-bearing mouse (n = 3 tumors) showing areas bordering cellular tumor (CT) and necrosis (N). The outlined area is enlarged and shown on the right. Three animals from each condition were examined independently with consistent observations. b Representative immunofluorescent staining of mouse-specific neutrophil marker, Ly6G, and DAPI staining on paraffin-embedded sections of mice implanted with LN229vector, LN229TAZ(4SA), or LN229TAZ(4SA-S51A) (n = 3 tumors for each) upon reaching endpoints. Three animals from each condition were examined independently with consistent observations. c Representative flow cytometry analysis of murine myeloid cell markers CD11b and CD45 on cells isolated from tumor tissues of mice implanted with LN229vector, LN229TAZ(4SA), or LN229TAZ(4SA-S51A) upon reaching endpoints. Cells isolated from a non-tumor-bearing mouse served as a baseline. d Percentage of CD11b+CD45+ cells from flow cytometry analyses shown in c; LN229vector (n = 3 tumors), LN229TAZ(4SA) (n = 9 tumors), LN229TAZ(4SA-S51A) (n = 4 tumors), and non-tumor-bearing mice (n = 7 mice). Ordinary one-way ANOVA. e Further immunophenotyping of CD11b+CD45+ cells shown in c via Ly6G flow cytometry, with representative results shown here. f Percentage of Ly6G+ cells (a.k.a. neutrophils) shown in e; LN229vector (n = 5 tumors), LN229TAZ(4SA) (n = 5 tumors), and LN229TAZ(4SA-S51A) (n = 3 tumors). Ordinary one-way ANOVA. g Representative low- and high-magnification H&E-stained formaldehyde-fixed paraffin-embedded brain sections of mice implanted with LN229TAZ(4SA) collected 10 days after tumor implantation (top; n = 3 tumors) and 16 days after tumor implantation (bottom; n = 3 tumors). N denotes central tumor necrosis and CT denotes cellular tumor. Three animals from each condition were examined independently with consistent observations. Outlined areas are enlarged and shown in the color-coded panels. ag n indicates total number of animals. Numerical data are presented as mean ± s.e.m. Each data point represents an animal. All scale bars are in μm. Source data are provided as a Source Data file.
Fig. 3
Fig. 3. Neutrophils facilitate GBM necrosis in vivo and induce tumor cell death in vitro.
a Necrosis-to-tumor area ratios at either early tumor progression (i.e., days 20, 22, and 24 after tumor implantation) or upon reaching endpoints of LN229TAZ(4SA) mice treated with either Ly6G or IgG isotype control (n = 2 for each of the three early-stage time points; n = 12 for terminal stage of Ly6G-treated group; n = 8 for terminal stage of IgG-treated group). Two-tailed paired t-test for early-stage and two-tailed unpaired t-test for terminal stage. b Representative H&E brain sections at endpoints as quantified in a; N denotes necrosis and CT denotes cellular tumor. c Tumor cell viability evaluated via luminescence of LN229TAZ(4SA) cells cultured alone (n = 4) or with parental LN229 (n = 3), with TANs from LN229TAZ(4SA) tumor-bearing mouse brains (n = 5), with tumor-naive neutrophils from bone marrow (B.M.) or spleen (Spl.) of non-tumor-bearing mice (n = 4), or with undifferentiated (non-diff) or differentiated (diff) 32Dcl3 (n = 4 for diff, n = 3 for non-diff) or HL-60 (n = 3 for diff, n = 3 for non-diff) cells. Raw luminescence levels (in arbitrary units, A.U.) are shown. Ordinary one-way ANOVA. d Tumor cell viability evaluated via colony-formation assays of LN229TAZ(4SA) cells cultured alone (n = 9) or with parental LN229 (n = 3), with TANs from LN229TAZ(4SA) tumor-bearing mouse brains (n = 6), with tumor-naive neutrophils from bone marrow (B.M.) or spleen (Spl.) of non-tumor-bearing mice (n = 4), or with undifferentiated or differentiated 32Dcl3 (n = 6 for diff, n = 3 for non-diff) or HL-60 (n = 3 for diff, n = 3 for non-diff) cells. Percent survival is normalized to LN229TAZ(4SA) tumor cells cultured alone. Ordinary one-way ANOVA. e Representative whole-well images of colony-formation assay conditions as quantified in d. ad n indicates number of animals or biologically independent samples (with each sample from an independent experiment). Numerical data are presented as mean ± s.e.m. All scale bars are in μm. Source data are provided as a Source Data file.
Fig. 4
Fig. 4. Neutrophil-mediated tumor cell killing is achieved via ferroptosis.
a Viability (luminescence; A.U, arbitrary units) of LN229TAZ(4SA) cells cultured alone or with differentiated 32Dcl3 cells treated with various cell death inhibitors (n = 2). b Viability (luminescence) of LN229TAZ(4SA) cells cultured alone, with differentiated 32Dcl3, with differentiated HL-60 cells, or with TANs treated with 2 µM ferrostatin-1, 0.1 (w/32D) or 0.2 (w/HL-60 or TANs) mM deferoxamine (DFO), or DMSO. Percent survival is normalized to LN229TAZ(4SA) tumor cells cultured alone and treated with the same compound (n = 3). Unpaired two-tailed t-test. c Representative flow cytometry analysis of BODIPY in LN229TAZ(4SA) cells cultured alone, with TANs, or with differentiated 32Dcl3 cells (n = 3). d Fold change in median fluorescence intensity (MFI) of flow cytometry analysis in c (n = 3). Ordinary one-way ANOVA. e Low- and high-magnification transmission electron microscopy (TEM) images of LN229TAZ(4SA) tumor cells cultured alone, with differentiated 32Dcl3, or with differentiated HL-60 cells. Five image fields were examined for each condition from two independent experiments with consistent observations. f Representative image of in situ Liperfluo dye-loaded brain slice from a LN229TAZ(4SA) tumor-bearing mouse. g Representative high-magnification images of the rectangular area outlined in red in f showing Liperfluo and DAPI signals. h Fold change in MFI of flow cytometry analysis in Supplementary Fig. 4j. CD45 tumor and CD45+ immune cells were isolated from LN229TAZ(4SA) tumor-bearing mice (n = 7). Each pair represents cells isolated from the same animal. Paired two-tailed t-test. i Chromogenic immunodetection of PTGS2 in a LN229TAZ(4SA) tumor section. The outlined area is enlarged and shown on the right. j Representative low- and high-magnification TEM images from LN229TAZ(4SA) tumor-bearing mice brain sections at early tumor progression (left; 16 days after implantation) and upon reaching endpoints (right; 30 days after implantation). For f, g, i, and j, three animals were examined independently with similar observations. aj n indicates number of animals or biologically independent samples (with each sample from an independent experiment). Numerical data are presented as mean ± s.e.m. All scale bars are in μm. Source data are provided as a Source Data file.
Fig. 5
Fig. 5. Intercellular transfer of neutrophilic myeloperoxidase (MPO) is responsible for neutrophil-mediated tumor cell cytotoxicity.
a MPO immunofluorescent staining of LN229TAZ(4SA) cells cultured alone or with indicated PKH26-labeled neutrophils. Non-diff undifferentiated, diff differentiated, Neu neutrophils, B.M. bone marrow. b, c PKH26 (b) and MPO (c) puncta per cell in a. Each data point represents an average of 10–15 cells in one image field. In b, nalone = 10, nnon-diff = 6, ndiff = 6, nw/TANs = 5, nNeu.Spl = 11, and nNeu.B.M. = 6. In c, nalone = 16, nnon-diff = 30, ndiff = 11, nw/TANs = 13, nNeu.Spl = 27, and nNeu.B.M. = 18. n indicates number of image fields from three independent experiments or animals. Ordinary one-way ANOVA. d Images of colony-formation assays of ZsGreen-expressing LN229TAZ(4SA) cells with many (PKHhigh) or few (PKHlow/-) PKH26 puncta when cocultured with PKH26-labeled differentiated 32Dcl3 cells. e Percent survival of conditions in d normalized to PKHlow/- LN229TAZ(4SA) cells. n = 3. Unpaired two-tailed t-test. f Chromogenic immunodetection of MPO in an endpoint LN229TAZ(4SA) tumor section. The outlined areas are shown on the bottom. g Immunofluorescent staining on an endpoint LN229TAZ(4SA) tumor section. For f and g, three animals were examined independently with similar observations. h Viability (luminescence) of LN229TAZ(4SA) cells cultured alone (n = 5) or with indicated neutrophils, treated with either of two MPO inhibitors, 4-ABAH (2 µM; nTANs = 5 and n32Dcl3 = 5) or PF06282999 (2 µM; nTANs = 3 and n32Dcl3 = 3), or with DMSO (nTANs = 5 and n32Dcl3 = 5). Percent survival normalized to LN229TAZ(4SA) cells cultured alone and treated with the same compound. Ordinary one-way ANOVA. i Viability (evaluated by Sytox-Blue) of LN229TAZ(4SA) cells cultured alone or with indicated neutrophils non-transduced (no-shRNA) or transduced with scrambled shRNA (sh-control) or shRNAs targeting MPO. n = 3. For e, h, and i, n indicates number of independent experiments. Each data point represents an animal or average of replicates from an independent experiment. Ordinary one-way ANOVA. ai Numerical data presented as mean ± s.e.m. Scale bars in μm. Source data provided as a Source Data file.
Fig. 6
Fig. 6. GPX4 expression and ACSL4 depletion inhibit tumor necrosis and progression.
a Chromogenic immunodetection of GPX4 in an endpoint LN229TAZ(4SA) tumor section. N necrotic region, CT cellular tumor region. The outlined area is shown on the right. Three animals were examined independently with similar observations. b Kaplan–Meier survival curve of mice implanted with LN229TAZ(4SA) cells transduced with vector or rGPX4. n = 4 mice for each group. Two-sided log-rank test. c Necrosis-to-tumor area ratios of tumors as indicated in b upon reaching same tumor size as measured by bioluminescence imaging. n = 4. Unpaired two-tailed t-test. d Necrosis-to-tumor area ratios of tumors developed from LN229TAZ(4SA) cells transduced with scrambled shRNA (sh-Control; n = 7) or shRNAs targeting ACSL4 (sh #41 n = 7; sh #42 n = 6). Ordinary one-way ANOVA. In c and d, n indicates number of tumors. Each data point represents an animal. Data presented as mean ±  s.e.m. e Kaplan–Meier survival curve of mice implanted with tumors indicated in d. nsh-Control = 6, nsh-ACSL4 #41 = 3, and nsh-ACSL4 #42 = 3. Two-sided log-rank test. n indicates number of mice. f Cytokine arrays of indicated tumor lysates. (1) CCL2, (2) IL6, (3) CXCL1, (4) CXCL family (CXCL1, CXCL2, and CXCL3), (5) IL8, and (6) TIMP2. g Differential expression (analyzed through https://glioblastoma.alleninstitute.org) and predicted activation (analyzed through IPA; right-tailed Fisher’s exact test) of indicated genes. h Expression of indicated genes in GBM subtypes. Data presented as box-and-whisker plots with boxes marking first quartile, median, and third quartile and with whiskers extending 1.5 times the inter-quartile range. Each point represents a tumor (nCL = 199; nMES = 166; nPN = 163). CCL2: PMES-PN = 1.7e-32; PMES-CL = 2.7e-18. CXCL1: PMES-PN = 4.9e-15; PMES-CL = 8.5e-14. IL6: PMES-PN = 1.4e-22; PMES-CL = 4.4e-33. Pairwise t-tests with Bonferroni correction. i Survival of GBM patients showing higher (top 25%) or lower (bottom 25%) expression of indicated genes. Log-rank test. n indicates number of human subjects. In h and i, analysis of TCGA dataset through GlioVis. Scale bars in μm. Source data provided as a Source Data file.
Fig. 7
Fig. 7. Ferroptosis is associated with mesenchymal transition and shorter survivals in human GBMs.
a Gene set enrichment analyses (GSEA) of ferroptosis-related genes as listed in Supplementary Fig. 7a using the TCGA GBM dataset; proneural (PN; n = 166 tumors) and mesenchymal (MES; n = 170 tumors). Nominal P-values and the false-discovery rate (FDR) are indicated. b GSEA of ferroptosis-related genes in GBM gene expression dataset obtained from Ivy GBM Atlas comparing cellular tumor peri-necrotic zone (denoted by CTpnz) and cellular tumor zone (denoted by CT). Nominal P-values and the false-discovery rate (FDR) are indicated. (n = 26 tumor samples for CTpnz; n = 111 tumor samples for CT). c Comparison of most enriched ferroptosis genes in the MES-GBM subtype and the CTpnz in GBM shows a marked overlap. d Representative image of chromogenic immunodetection of PTGS2 (a.k.a. COX2) in a formaldehyde-fixed paraffin-embedded, human GBM brain section. The outlined areas are enlarged and shown on the bottom. Specimens from three different patients were examined independently with similar observations. e Survival analyses of GBM patients showing higher (top 25%) or lower (bottom 25%) expression of indicated genes. (TCGA or CGGA dataset was analyzed through GlioVis.) Log-rank P-value of each graph is shown. n indicates total number human subjects. f Survival analyses of GBM patients showing higher (top 25%) or lower (bottom 25%) expression of GPX4. (The IDH1 wild-type cohort TCGA dataset was analyzed through GlioVis.) Log-rank P-value is shown. n indicates total number human subjects. All scale bars are in μm.
Fig. 8
Fig. 8. Tumor-associated neutrophils, both peripherally and intra-tumorally, are closely associated with tumor necrosis in human GBMs and shorter survivals.
a Example of a pre-operative T1-weighted fat-saturated post-contrast MRI obtained from a GBM patient included in the study cohort as in b; necrotic core (asterisk); tumor (arrow). b Correlation analyses of pre-operative T1-weighted MRI-identified necrosis-to-tumor volumetric ratios and peripheral neutrophil count reported in blood differentials in a GBM patient cohort (n = 75 human subjects), Pearson’s correlation coefficient test. c Representative H&E-stained formaldehyde-fixed paraffin-embedded human GBM section containing the necrotic zone. A total of 45 patients were examined with similar observations. d Comparison of absolute numbers of neutrophils/high-power field among cellular tumor (CT), necrosis (N), and CT-N interface zones (CT/N) in human GBM sections obtained from a deceased patient cohort (n = 45 patients); Brown-Forsythe and Welch one-way ANOVA tests. e Chromogenic immunodetection of human granulocyte marker, CD66b, in a formaldehyde-fixed paraffin-embedded, human GBM brain section obtained from the study cohort used for quantification in d. The outlined areas are enlarged and shown on the right. Specimens from three different patients were examined independently with similar observations. f Kaplan–Meier survival curve of the patient cohort shown in b; all deceased patients (n = 37 patients) from this cohort were included for survival analysis. Patients were separated into two groups by median radiographically identified necrosis-to-tumor (N/T) volumetric ratios; two-sided log-rank test. g Kaplan–Meier survival curve of the patient cohort as shown in d; all patients from the cohort shown in d were included in this survival analysis (n = 45 patients). Patients were separated into two groups by median absolute neutrophil count/high-power field in necrotic region obtained from their diagnostic H&E-stained sections. Two-sided log-rank test. h Current proposed model of how TANs contribute to augmenting GBM necrosis development to its fullest extent via neutrophil-mediated ferroptotic tumor cell death. All scale bars are in μm, except in Fig. 8a, whose scale bar is in cm. Source data are provided as a Source Data file.

References

    1. Fisher ER, Anderson S, Redmond C, Fisher B. Pathologic findings from the National Surgical Adjuvant Breast Project protocol B-06. 10-year pathologic and clinical prognostic discriminants. Cancer. 1993;71:2507–2514. doi: 10.1002/1097-0142(19930415)71:8<2507::AID-CNCR2820710813>3.0.CO;2-0. - DOI - PubMed
    1. Swinson DE, et al. Tumour necrosis is an independent prognostic marker in non-small cell lung cancer: correlation with biological variables. Lung Cancer. 2002;37:235–240. doi: 10.1016/S0169-5002(02)00172-1. - DOI - PubMed
    1. Edwards JG, et al. Tumor necrosis correlates with angiogenesis and is a predictor of poor prognosis in malignant mesothelioma. Chest. 2003;124:1916–1923. doi: 10.1378/chest.124.5.1916. - DOI - PubMed
    1. Cheville JC, Lohse CM, Zincke H, Weaver AL, Blute ML. Comparisons of outcome and prognostic features among histologic subtypes of renal cell carcinoma. Am. J. Surg. Pathol. 2003;27:612–624. doi: 10.1097/00000478-200305000-00005. - DOI - PubMed
    1. Muro-Cacho CA, Cantor AB, Morgan M. Prognostic factors in malignant gastrointestinal stromal tumors. Ann. Clin. Lab. Sci. 2000;30:239–247. - PubMed

Publication types

Substances