. 2020 Oct 27;11(1):5177.
doi: 10.1038/s41467-020-18934-3.

Global warming due to loss of large ice masses and Arctic summer sea ice

Affiliations

Global warming due to loss of large ice masses and Arctic summer sea ice

Nico Wunderling et al. Nat Commun. .

Abstract

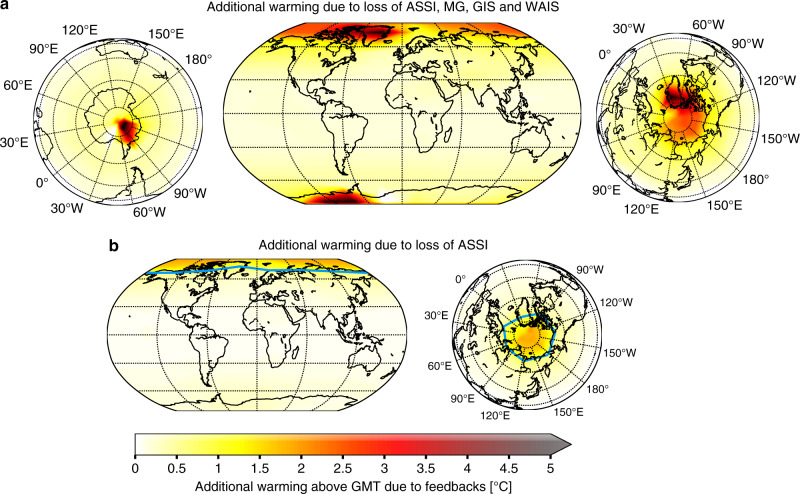
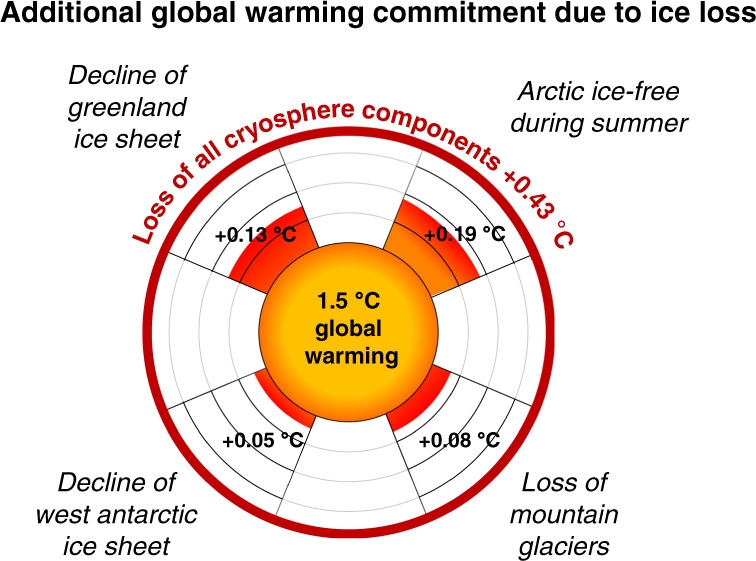
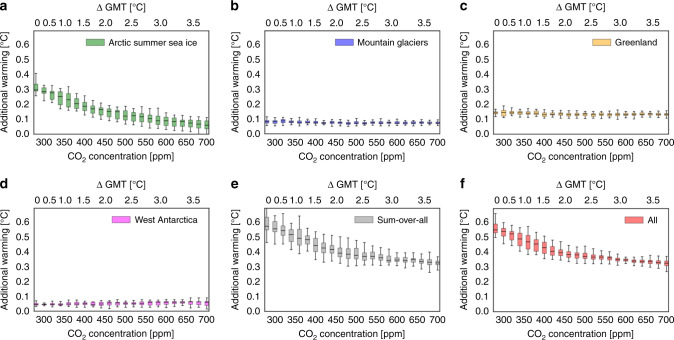
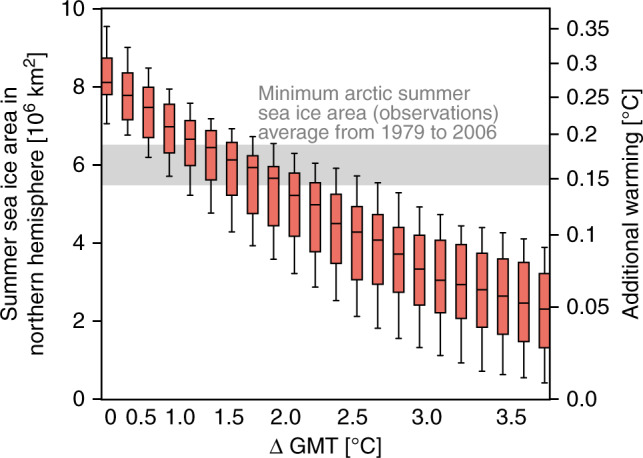
Several large-scale cryosphere elements such as the Arctic summer sea ice, the mountain glaciers, the Greenland and West Antarctic Ice Sheet have changed substantially during the last century due to anthropogenic global warming. However, the impacts of their possible future disintegration on global mean temperature (GMT) and climate feedbacks have not yet been comprehensively evaluated. Here, we quantify this response using an Earth system model of intermediate complexity. Overall, we find a median additional global warming of 0.43 °C (interquartile range: 0.39-0.46 °C) at a CO2 concentration of 400 ppm. Most of this response (55%) is caused by albedo changes, but lapse rate together with water vapour (30%) and cloud feedbacks (15%) also contribute significantly. While a decay of the ice sheets would occur on centennial to millennial time scales, the Arctic might become ice-free during summer within the 21st century. Our findings imply an additional increase of the GMT on intermediate to long time scales.


Conflict of interest statement

The authors declare no competing interests.

Figures

Fig. 1
Fig. 1. Regional warming due to feedbacks.
a Regional warming for the whole Earth if Arctic summer sea ice (ASSI) in June, July and August, mountain glaciers (MG), Greenland Ice Sheet (GIS) and West Antarctic Ice Sheet (WAIS) vanish at a global mean temperature of 1.5 °C above pre-industrial. b Same as in (a) with an additional zoom-in of the Arctic region if only the Arctic summer sea ice vanishes, which might happen until the end of the century. The light blue line indicates the region of removed Arctic summer sea ice extent, where its concentration in CLIMBER-2 is 15% or higher. In all panels, the average additional warming on top of 1.5 °C is shown in absolute degree.
Fig. 2
Fig. 2. GMT increase through disappearance of cryosphere elements.
The additional warming for the cryosphere components is shown for a scenario consistent with global warming levels of 1.5 °C. Radially outward, the temperature anomaly is displayed which arises from the disappearance of the cryosphere elements. The thick dark red line indicates the maximum effect of additional warming in case all cryosphere elements lose stability. All values are the medians of the ensemble.
Fig. 3
Fig. 3. Linearity of additional warming due to disintegration of cryosphere elements.
Additional warming plotted against CO2 concentration. Disintegration of of cryosphere components separately for (a) the Arctic summer sea ice, (b) the mountain glaciers, (c) the Greenland Ice Sheet, (d) the West Antarctic Ice Sheet, (e) the sum of all additional warmings from the separately disintegrated cryosphere elements and (f) the disintegration of all four elements at the same time. The grey bars match the red bars within their errors which means, according to CLIMBER-2, that the warming effect of singular disintegrated cryosphere elements can linearly be added up to the effect of all four elements disintegrated at the same time. Here we show median, interquartile range and full ensemble spread for each CO2 concentration. The upper horizontal axis shows the temperature increase above pre-industrial, where a least-square fit converting CO2 concentration to temperature with python’s function scipy.optimize.curve_fit was used. The respective fitted temperatures arise from full ensemble simulations at prescribed CO2 concentrations, but without removed cryosphere elements.
Fig. 4
Fig. 4. Additional warming due to meltdown of Arctic summer sea ice.
Box whiskers plot of global mean temperature (ΔGMT) versus Arctic summer sea ice area with error boxes (error bars) representing the interquartile range (full spread) of the ensemble at the according GMT over the CLIMBER-2 ensemble runs. The additional warming when the Arctic summer sea ice disappears is represented by a second y-axis computed via a least-square fit from the corresponding summer sea ice area. The relationship between summer sea ice area and additional warming is slightly nonlinear. This means that a doubling of the ice area does not quite translate into a doubling of the additional warming. The x-axis shows ΔGMT above pre-industrial computed via a GMT-CO2 concentration least-square fit. The shaded area shows the mean Arctic sea ice area as observed by NERSC (Nansen Environmental & Remote Sensing Center) from 1979 to 2006, where the uncertainty indicates one standard deviation: 6.0 ± 0.5 × 106 km2.

References

    1. Stroeve JC, et al. The arctic’s rapidly shrinking sea ice cover: a research synthesis. Clim. Change. 2012;110:1005–1027. doi: 10.1007/s10584-011-0101-1. - DOI
    1. Gardner AS, et al. A reconciled estimate of glacier contributions to sea level rise: 2003 to 2009. Science. 2013;340:852–857. doi: 10.1126/science.1234532. - DOI - PubMed
    1. Zwally HJ, et al. Greenland ice sheet mass balance: distribution of increased mass loss with climate warming; 2003–07 versus 1992–2002. J. Glaciol. 2011;57:88–102. doi: 10.3189/002214311795306682. - DOI
    1. Khan SA, et al. Sustained mass loss of the northeast greenland ice sheet triggered by regional warming. Nat. Clim. Change. 2014;4:292–299. doi: 10.1038/nclimate2161. - DOI
    1. Shepherd A, et al. Mass balance of the antarctic ice sheet from 1992 to 2017. Nature. 2018;558:219–222. doi: 10.1038/s41586-018-0171-6. - DOI - PubMed

Publication types