. 2020 Oct 27;10(1):18319.
doi: 10.1038/s41598-020-75332-x.

SARS-Cov-2 trajectory predictions and scenario simulations from a global perspective: a modelling study

Affiliations

SARS-Cov-2 trajectory predictions and scenario simulations from a global perspective: a modelling study

Tianan Yang et al. Sci Rep. .

Abstract

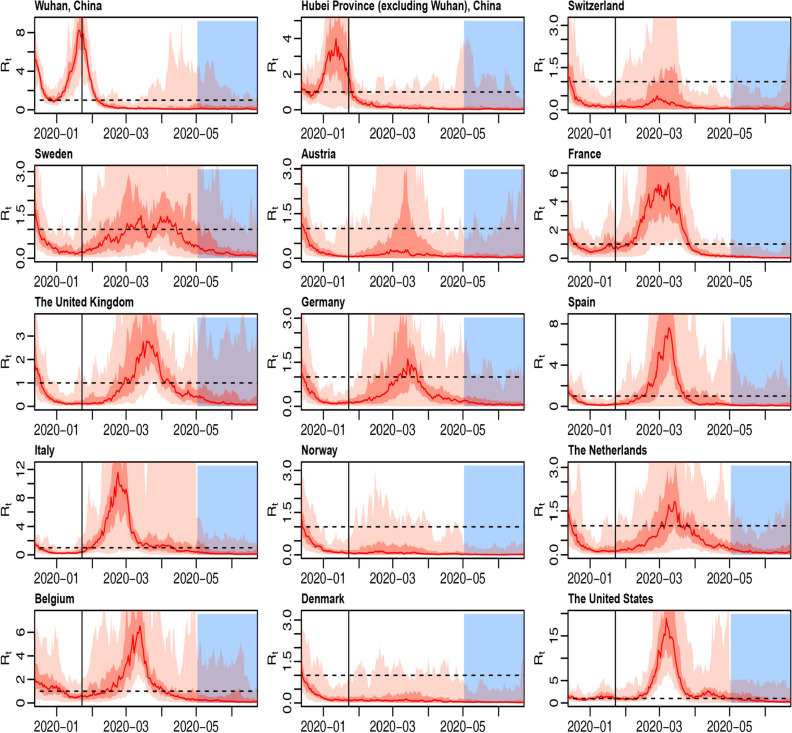
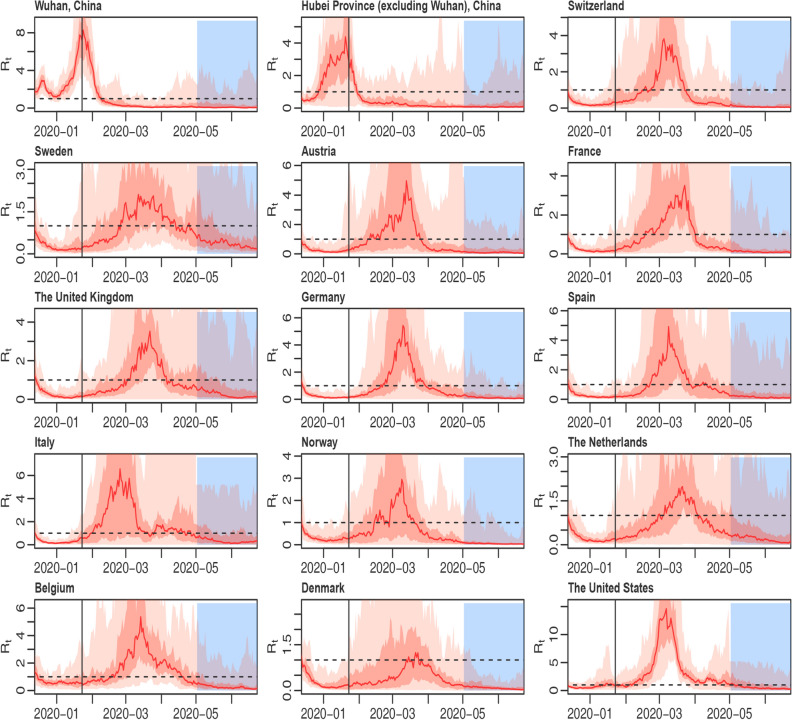
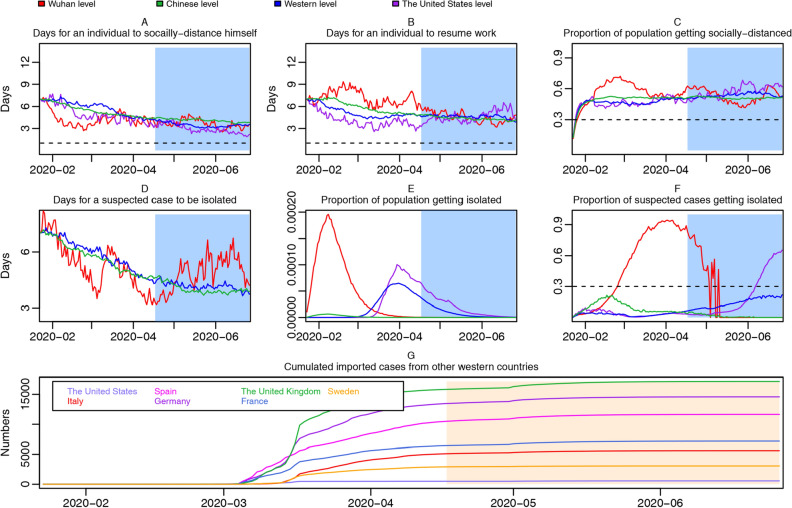
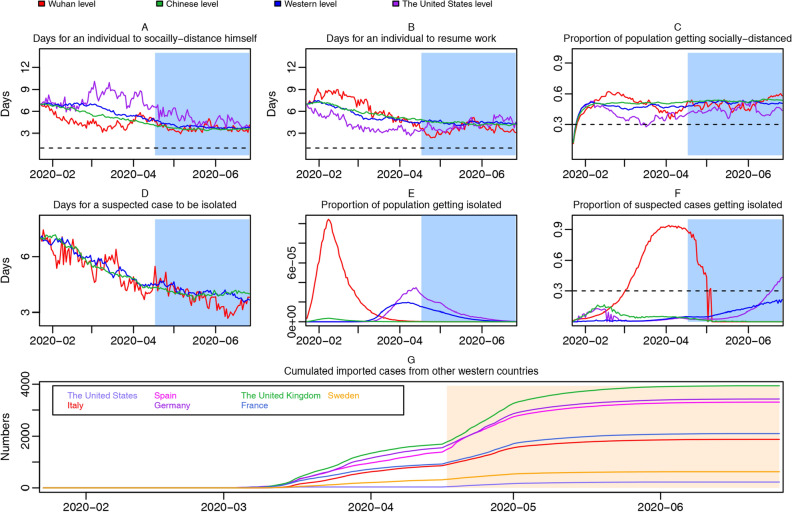
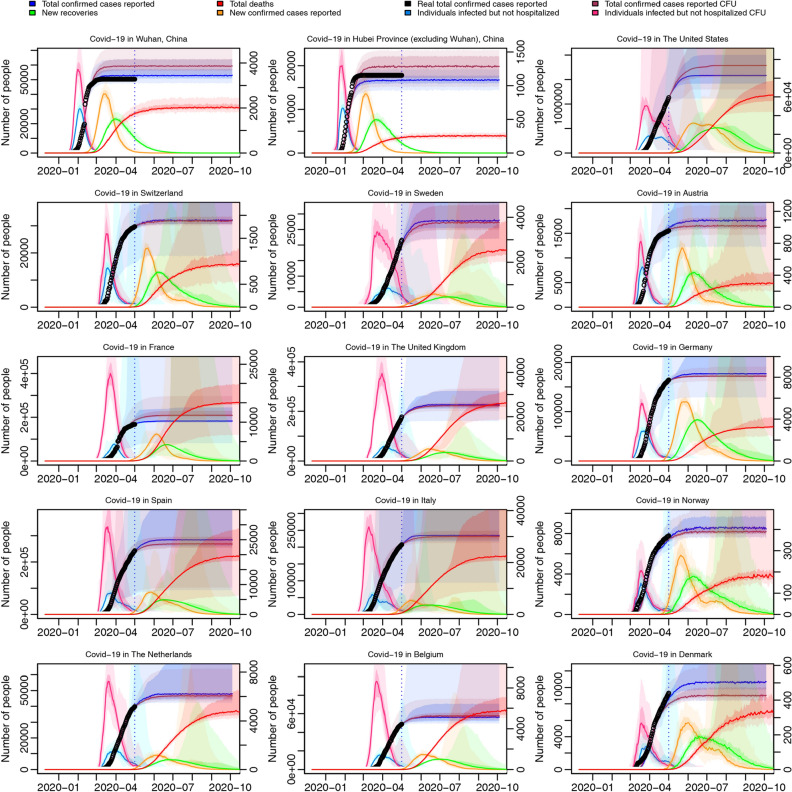
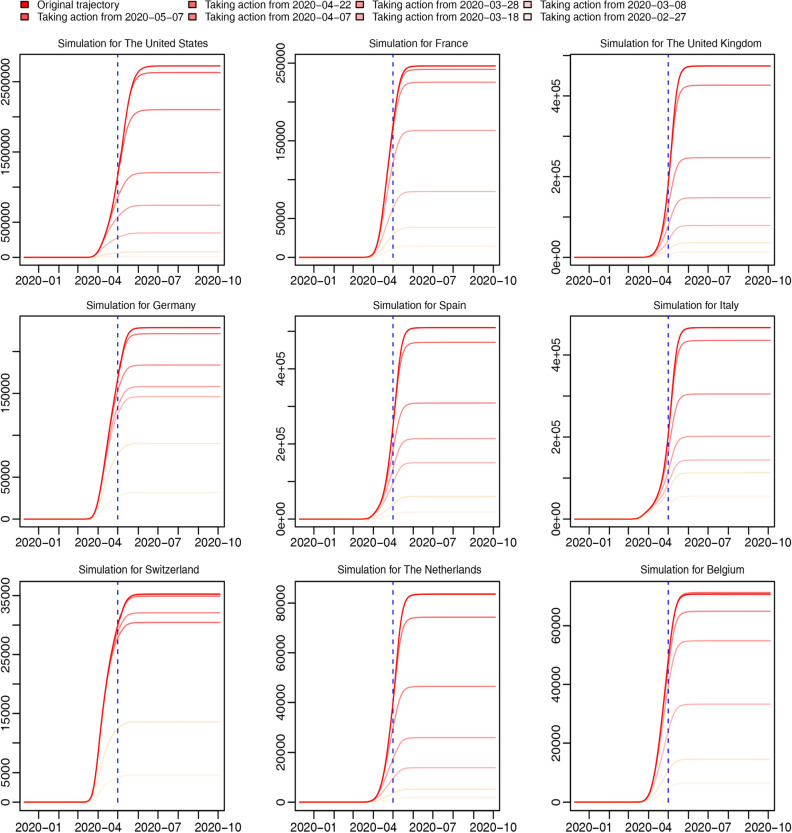
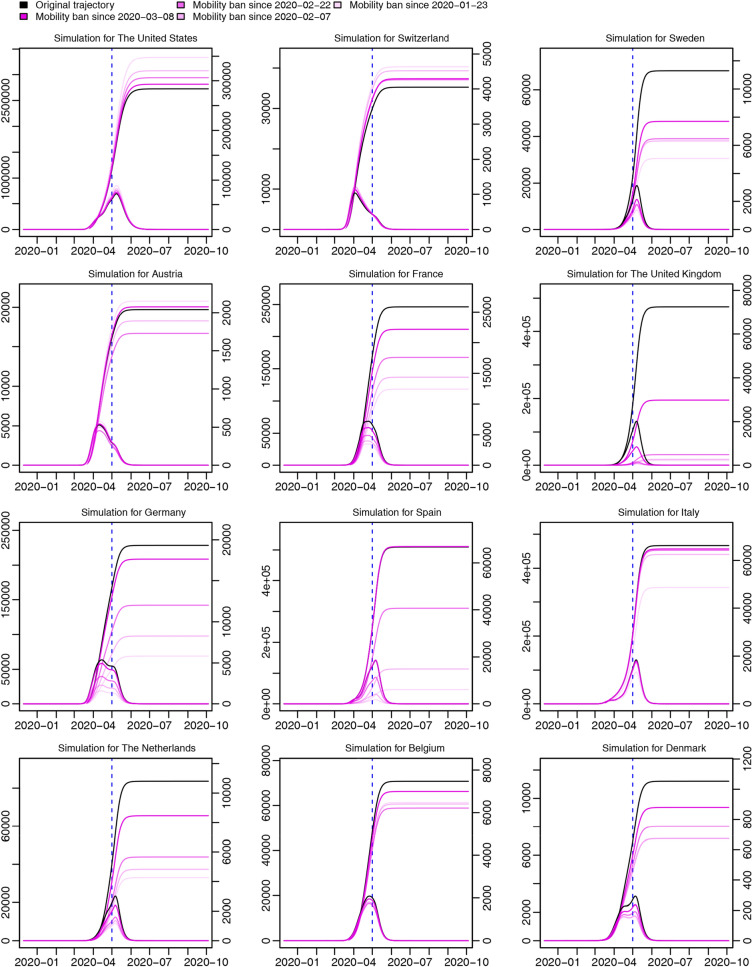
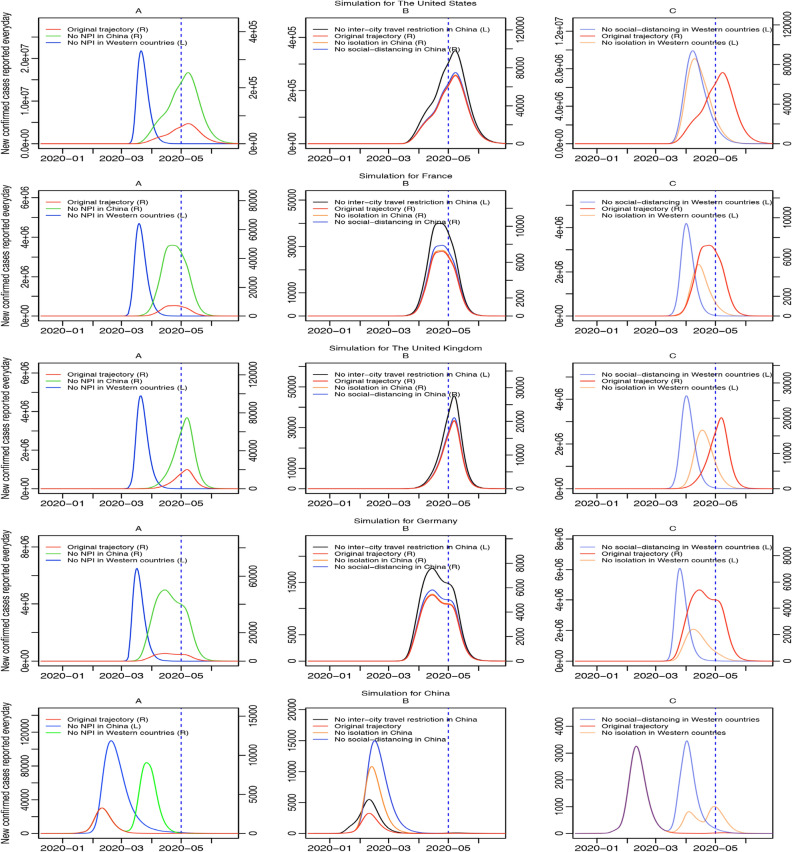
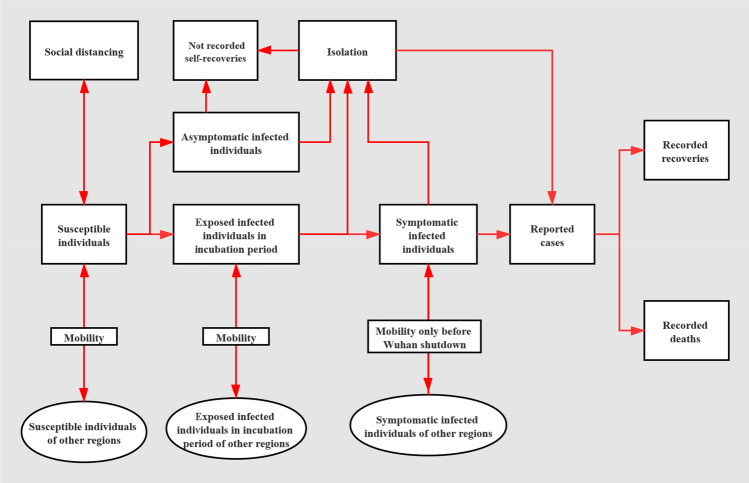
The coronavirus SARS-CoV-2 emerging from Wuhan, China has developed into a global epidemic. Here, we combine both human mobility and non-pharmaceutical interventions (social-distancing and suspected-cases isolation) into SEIR transmission model to understand how coronavirus transmits in a global environment. Dynamic trends of region-specific time-variant reproduction number, social-distancing rate, work-resumption rate, and suspected-cases isolation rate have been estimated and plotted for each region by fitting stochastic transmission processes to the real total confirmed cases reported of each region. We find after shutdown in Wuhan, the reproduction number in Wuhan greatly declined from 6·982 (95% CI 2·558-14·668) on January 23rd, 2020 to 1.130 (95% CI 0.289-3.279) on February 7th, 2020, and there was a higher intervention level in terms of social-distancing and suspected-cases isolation in Wuhan than the Chinese average and Western average, for the period from the shutdown in Wuhan to mid-March. Future epidemic trajectories of Western countries up to October 10th, 2020, have been predicted with 95% confidence intervals. Through the scenario simulation, we discover the benefits of earlier international travel ban and rigorous intervention strategies, and the significance of non-pharmaceutical interventions. From a global perspective, it is vital for each country to control the risks of imported cases, and execute rigorous non-pharmaceutical interventions before successful vaccination development.


Conflict of interest statement

The authors declare no competing interests.

Figures

Figure 1
Figure 1
Region-specific time-variant reproduction numbers for fifteen regions, not controlling for under-reporting. The horizontal black imaginary line represents R0 at 1, the vertical black line represents January 23rd, 2020, the date of the shutdown in Wuhan, and the blue area on the right side of the picture represents the predicted period from May 1st to June, 26th, 2020.
Figure 2
Figure 2
Region-specific time-variant reproduction numbers for fifteen regions, controlling for under-reporting. The horizontal black imaginary line represents R0 at 1, the vertical black line represents January 23rd, 2020, the date of the shutdown in Wuhan, and the blue area on the right side of the picture represents the predicted period from May 1st to June, 26th, 2020.
Figure 3
Figure 3
Trend plots of region-specific time-variant social-distancing rate, suspected-cases isolation rate, work-resumption rate and accumulated imported cases from abroad, not controlling for under-reporting. Social-distancing rate trajectories for Wuhan, the Chinese average, the United States, and the Western average, with the horizontal dotted line representing 1 day (A); work resumption rate trajectories for Wuhan, the Chinese average, the United States, and the Western average, with the horizontal dotted line representing 1 day (B); proportion of socially-distanced people in susceptible population for Wuhan, the Chinese average, the United States, and the Western average, with the horizontal dotted line representing 30% (C); isolation rate trajectories for Wuhan, the Chinese average, and the Western average (D); proportion of population getting isolated in Wuhan, the Chinese average, the United States, and the Western average (E); proportion of suspected cases getting isolated in Wuhan, the Chinese average, the United States, and the Western average, with the horizontal dotted line representing 30% (F); accumulated imported cases from other Western countries (G). Under-reporting is not controlled for.
Figure 4
Figure 4
Trend plots of region-specific time-variant social-distancing rate, suspected-cases isolation rate, work-resumption rate and accumulated imported cases from abroad, controlling for under-reporting. Social-distancing rate trajectories for Wuhan, the Chinese average, the United States, and the Western average, with the horizontal dotted line representing 1 day (A); work resumption rate trajectories for Wuhan, the Chinese average, the United States, and the Western average, with the horizontal dotted line representing 1 day (B); proportion of socially-distanced people in susceptible population for Wuhan, the Chinese average, the United States, and the Western average, with the horizontal dotted line representing 30% (C); isolation rate trajectories for Wuhan, the Chinese average, and the Western average (D); proportion of population getting isolated in Wuhan, the Chinese average, the United States, and the Western average (E); proportion of suspected cases getting isolated in Wuhan, the Chinese average, the United States, and the Western average, with the horizontal dotted line representing 30% (F); accumulated imported cases from other Western countries (G). Under-reporting is controlled for.
Figure 5
Figure 5
Epidemic trajectories of Wuhan, Hubei Province excluding Wuhan, and thirteen Western countries. Total number of confirmed cases reported, controlling for under-reporting (purple curve, left axis) and not controlling for under-reporting (blue curve, left axis); total number of individuals infected but not hospitalized, controlling for under-reporting (pink curve, left axis) and not controlling for under-reporting (sky-blue curve, left axis); new confirmed cases (orange curve, right axis), total deaths (red curve, right axis), and new recoveries (green curve, right axis) every day not controlling for under-reporting; All trajectories are predicted from May 2nd, 2020 to October 4th, 2020, for Wuhan, Hubei Province (excluding Wuhan), and thirteen Western countries, based on total-confirmation real data, all with 50% and 95% CI. Black point refers to historical real total number of confirmed cases reported per day. CFU means “controlling for under-reporting”.
Figure 6
Figure 6
Simulations of the first scenario. Curves of different colors represent trajectories of total confirmed cases reported for nine randomly selected Western countries in different occasions where NPI of western countries were executed in the same way as Wuhan from different time points. The deeper the color is, the later Wuhan-level interventions were executed. Different time-points to take action are exhibited in the legend.
Figure 7
Figure 7
Simulations of the second scenario. Curves of different colors represent trajectories of total confirmed cases reported every day (left axis) and new confirmed cases reported every day (right axis) for twelve randomly selected Western countries in different occasions where complete international travel ban were executed from different time points. The deeper the color is, the later travel bans were executed. Different time-points to take complete international travel ban are exhibited in the legend.
Figure 8
Figure 8
Simulations of the third scenario. Curves of different colors represent trajectories of daily new confirmed cases reported for four selected Western countries and China in different occasions where less or none NPI were executed from January 23rd, 2020. Subplot A draws scenarios that none NPI were executed in either China or Western countries; subplot B draws scenarios that one kind of NPI was not executed in China; and subplot C draws scenarios that one kind of NPI was not executed in Western countries. In the legend, (L) means being drawn on the left axis and (R) means being drawn on the right axis. The blue dotted line represents May 1st, 2020, the final day of fitting.
Figure 9
Figure 9
Model structure. The natural infective process is stratified into four stages: susceptible individuals, exposed infected individuals in the incubation period, symptomatic infected individuals, and removed individuals (who either recovered or died). 7.5% asymptomatic cases are assumed. By human mobility, susceptible individuals and exposed infected cases in incubation period could move freely across regions, and symptomatic infected cases could move across regions only before Wuhan shutdown. Susceptible individuals could expand their social distancing to the extent that they would not be infected, at a time-variant social-distancing rate, and similarly, individuals who have social-distanced themselves could resume work at a time-variant work-resumption rate and become susceptible individuals again. Asymptomatic cases, exposed infected individuals in the incubation period, as well as symptomatic infected individuals could be isolated at a time-variant isolation rate. By adjusting human mobility matrix, the international or inter-city travel ban can be realized.

References

    1. Chen L, Cai JC, Lin QY, Xiang B, Ren T. Imported COVID-19 cases pose new challenges for China. J. Infect. 2020;80:e43–e44. doi: 10.1016/j.jinf.2020.03.048. - DOI - PMC - PubMed
    1. Wu JT, Leung K, Leung GM. Nowcasting and forecasting the potential domestic and international spread of the 2019-nCoV outbreak originating in Wuhan, China: a modelling study. Lancet. 2020;395:689–697. doi: 10.1016/S0140-6736(20)30260-9. - DOI - PMC - PubMed
    1. Tang B, et al. The effectiveness of quarantine and isolation determine the trend of the COVID-19 epidemics in the final phase of the current outbreak in China. Int. J. Infect. Dis. 2020;95:288–293. doi: 10.1016/j.ijid.2020.03.018. - DOI - PMC - PubMed
    1. Lai S, et al. Effect of non-pharmaceutical interventions to contain COVID-19 in China. Nature. 2020;585:410–413. doi: 10.1038/s41586-020-2293-x. - DOI - PMC - PubMed
    1. Yang, Y. G. The orderly resumption of work and production in China is encouraging. China Radio International Online Network.https://news.cri.cn/20200420/a6096eb4-fde9-b286-f082-805b6adc6af0.html (2020).

Publication types

MeSH terms