. 2020 Oct 27;10(1):18333.
doi: 10.1038/s41598-020-75322-z.

Fruit volatilome profiling through GC × GC-ToF-MS and gene expression analyses reveal differences amongst peach cultivars in their response to cold storage

Affiliations

Fruit volatilome profiling through GC × GC-ToF-MS and gene expression analyses reveal differences amongst peach cultivars in their response to cold storage

Antonella Muto et al. Sci Rep. .

Abstract

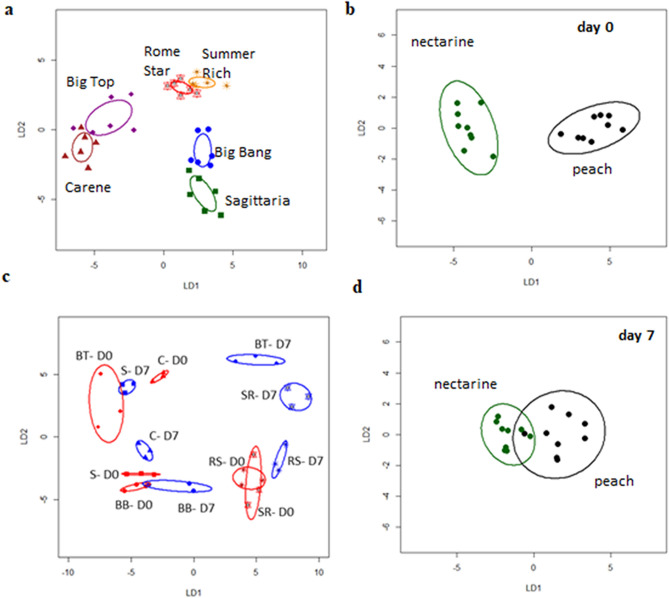
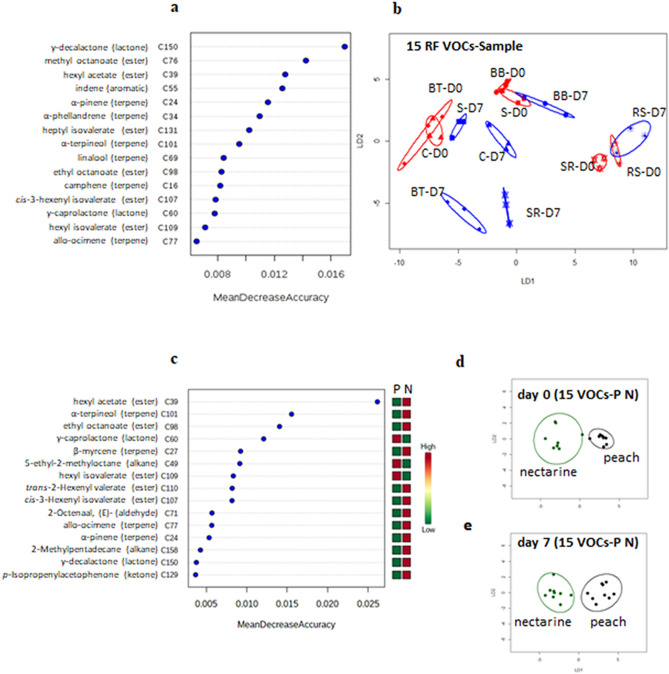
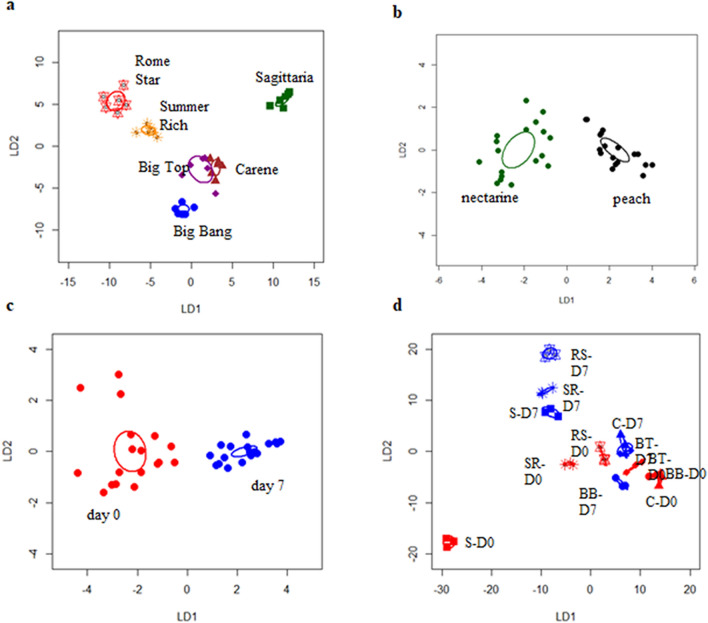
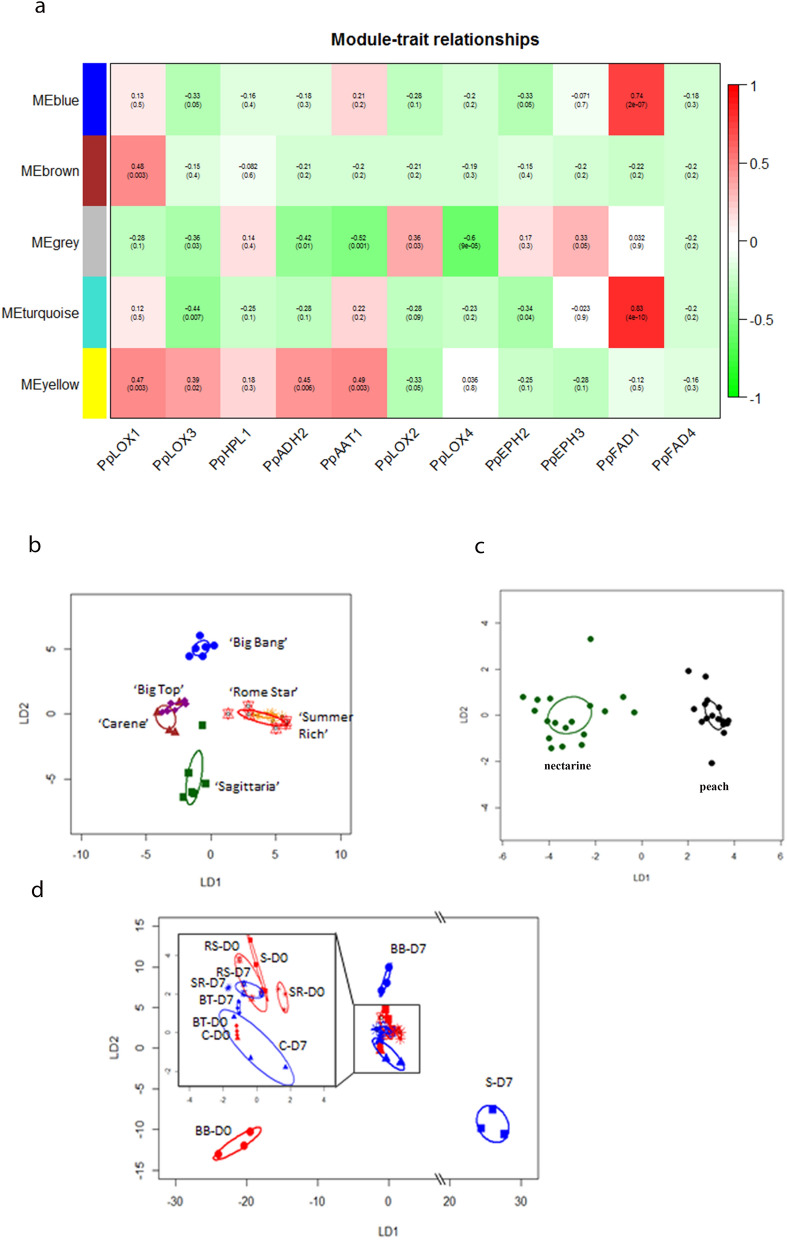
Peaches have a short shelf life and require chilling during storage and transport. Peach aroma is important for consumer preference and determined by underlying metabolic pathways and gene expression. Differences in aroma (profiles of volatile organic compounds, VOCs) have been widely reported across cultivars and in response to cold storage. However, few studies used intact peaches, or used equilibrium sampling methods subject to saturation. We analysed VOC profiles using TD-GC × GC-ToF-MS and expression of 12 key VOC pathway genes of intact fruit from six cultivars (three peaches, three nectarines) before and after storage at 1 °C for 7 days including 36 h shelf life storage at 20 °C. Two dimensional GC (GC × GC) significantly enhances discrimination of thermal desorption gas chromatography time-of-flight mass spectrometry (TD-GC-ToF-MS) and detected a total of 115 VOCs. A subset of 15 VOCs from analysis with Random Forest discriminated between cultivars. Another 16 VOCs correlated strongly with expression profiles of eleven key genes in the lipoxygenase pathway, and both expression profiles and VOCs discriminated amongst cultivars, peach versus nectarines and between treatments. The cultivar-specific response to cold storage underlines the need to understand more fully the genetic basis for VOC changes across cultivars.


Conflict of interest statement

The authors declare no competing interests.

Figures

Figure 1
Figure 1
Linear discriminant (LD) plots from Canonical Analysis of Principal coordinates (CAP) based on all VOCs analysed using TD-GC-TOF-MS from six peach cultivars: ‘Sagittaria’ (S), ‘Big Bang’ (B), ‘Big Top’ (BT), ‘Carene’ (C), ‘Rome star’ (RS) and ‘Summer Rich’ (SR), by: (a) cultivar, (b) and (d) considering nectarine versus peach cultivars before (b) and after (d) storage; (c) cultivar analysed as a single category before (D0, in red) and after (D7, in blue) storage; storage was for 7 days at 1 ℃ followed by a 36 h recovery at 20 ℃. Each ellipse represents the 95% confidence interval. The plots use LD1 (a) with a percentage of correct classification = 91.7% (P < 0.0001; n = 6;  ± SE; (b) 100% (P = 0.01; n = 9; ± SD); (c) 91.7% (P < 0.0001; n = 3; ± SD); (d) 88.9% (P = 0.03; n = 9 ; ± SD).
Figure 2
Figure 2
Mean decrease accuracy (a, c) and CAP analysis (b, d) for the 15 most significant VOCs identified by Random Forest (RF) analysis within Metaboanalyst contributing to discrimination between (a, b) VOC profile across all cultivars and timepoints (c, d, e) nectarine (BB, C, BT) versus peach (S, SR, RS) cultivars. For the CAP analysis each ellipse represents the 95% confidence interval of SD. The plots use LD1 and LD2 with a percentage of correct classification (b) 75% (P = 1; n = 3; ± SD); (d) 94% (P = 0.02; n = 9; ± SD); (e) 89% (P = 0.01; n = 9; ± SD). In the heat map peach association is denoted by “P” and nectarine by “N”.
Figure 3
Figure 3
Linear discriminant plots from Canonical Analysis of Principal coordinates (CAP) based on all gene expression from six peach cultivars: ‘Sagittaria’, ‘Big Bang’, ‘Big Top’,‘Carene’, ‘Rome star’ and ‘Summer Rich’, by (a) cultivar, (b) peaches versus nectarines, (c) time of storage, (d) the six peach cultivars analysed as individual category before (D0, in red) and after a 7 day (D7, in blue) cold. (mean ± SE). Each ellipse represents the 95% confidence interval of SE. The plots use LD1 with a percentage of correct classification (ad) = 100% (P < 0.01; and n = 6; n = 18; n = 18; n = 3 respectively).
Figure 4
Figure 4
Real-time PCR analysis of selected differentially expressed genes related to VOC compounds, among six peach/nectarine cultivars analysed at two time points day 0 (before) and day 7 (after) cold storage (a) PpFAD1: Fatty acid desaturase 1 (FAD); (b) PpFAD4: Fatty acid desaturase 4 (FAD); (c) PpLOX1: lipoxygenase 1 (LOX); (d) PpLOX2: lipoxygenase 2 (LOX) (e) PpLOX3: lipoxygenase 3 (LOX); (f) PpLOX4: lipoxygenase 4 (LOX); (g) PpHPL1: hydroperoxide lyase (HPL), (h) PpADH2: alcohol dehydrogenase 2 (ADH) (i) PpAAT1: alcohol acyl transferase (AAT); (j) PpEPH2: Epoxide hydrolase enzymes (EPH); (k) PpEPH3 Epoxide hydrolase enzymes (EPH); (l) PpTPS1: terpene synthase 1 (TPS); PpTEF2 was used as an internal control to normalize small differences in template amounts according to Tong et al.. Letters indicate significant differences among cultivars considering all time points. Statistical analyses were performed using ANOVA and Tukey’s ranked test (P < 0.05). Data are the mean ± SE; n = 3.
Figure 5
Figure 5
Multi-trait analysis of expression genes from LOX pathway and 63 associated LOX pathway VOCs in the six peach cultivars before and after cold storage (a) Heat map of WCNA modules with scores and significance (P values in brackets) based on a Pearson analysis; (bd) linear discriminant plots from Canonical Analysis of Principal coordinates (CAP) based on 16 VOCs selected from WCNA analysis of LOX gene expression versus LOX related VOCs from six peach cultivars: ‘Sagittaria’, ‘Big Bang’, ‘Big Top’, ‘Carene’ ‘Rome star’ and ‘Summer Rich’, by (b) cultivar, (c) peach versus nectarine, (d) the six peach cultivars analysed before (D0, in red) and after (D7, in blue) a 7 day storage period at 1 ℃ followed by a 36 h shelf life storage at 20 ℃. (mean + SE). Each ellipse represents the 95% confidence interval of SE. The plots use LD1 (b) with a percentage of correct classification = 83% (P = 0.01; n = 6); (c) 97% (P = 0.01; n = 18); (d) 72% (P = 0.9; n = 3).

References

    1. Wen I-C, Sherman WB, Koch KE. Heritable pleiotropic effects of the nectarine mutant from peach. J. Am. Soc. Hortic. Sci. 1995;120:721–725. doi: 10.21273/JASHS.120.5.721. - DOI
    1. Wen I-C, Koch KE, Sherman WB. Comparing fruit and tree characteristics of two peaches and their nectarine mutants. J. Am. Soc. Hortic. Sci. 1995;120:101–106. doi: 10.21273/JASHS.120.1.101. - DOI
    1. Ayala-Zavala JF, Wang SY, Wang CY, González-Aguilar GA. Effect of storage temperatures on antioxidant capacity and aroma compounds in strawberry fruit. LWT-Food Sci. Technol. 2004;37:687–695. doi: 10.1016/j.lwt.2004.03.002. - DOI
    1. Xi W, Zheng Q, Lu J, Quan J. Comparative analysis of three types of peaches: identification of the key individual characteristic flavor compounds by integrating consumers’ acceptability with flavor quality. Hortic. Plant J. 2017;3:1–12. doi: 10.1016/j.hpj.2017.01.012. - DOI
    1. Pelayo C, Ebeler SE, Kader AA. Postharvest life and flavor quality of three strawberry cultivars kept at 5°C in air or air+20 kPa CO2. Postharvest Biol. Tec. 2003;27:171–183. doi: 10.1016/S0925-5214(02)00059-5. - DOI

Publication types

Substances