. 2020 Oct 27;10(1):18390.
doi: 10.1038/s41598-020-74717-2.

Validation and feasibility of liver T1 mapping using free breathing MOLLI sequence in children and young adults

Affiliations

Validation and feasibility of liver T1 mapping using free breathing MOLLI sequence in children and young adults

Yeon Jin Cho et al. Sci Rep. .

Abstract

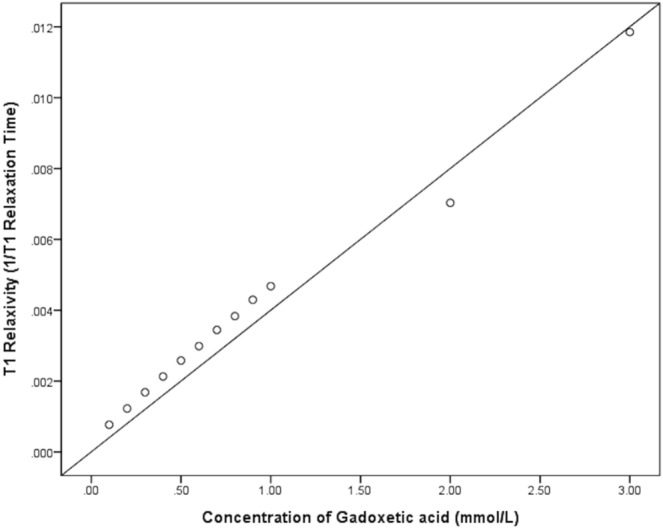
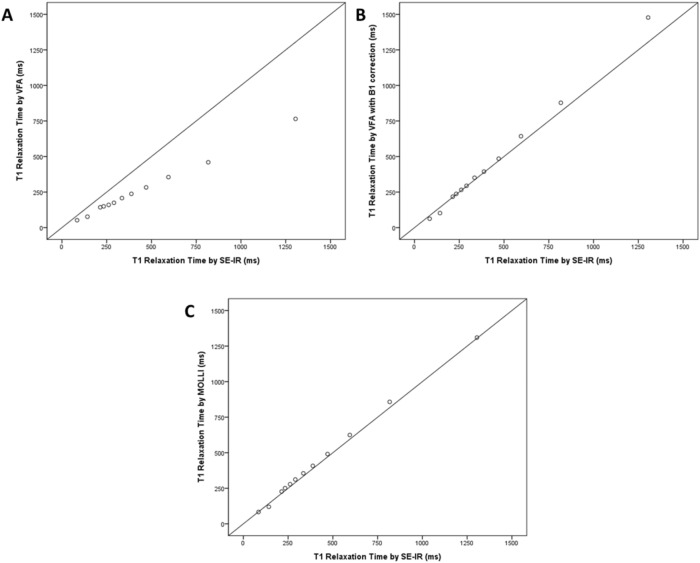
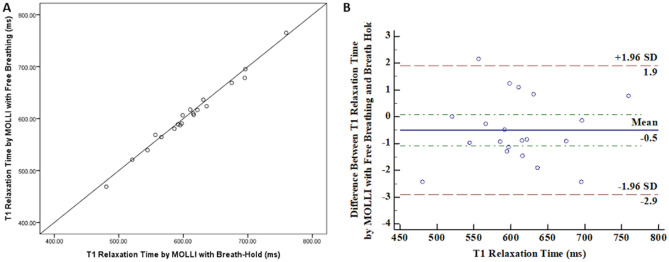
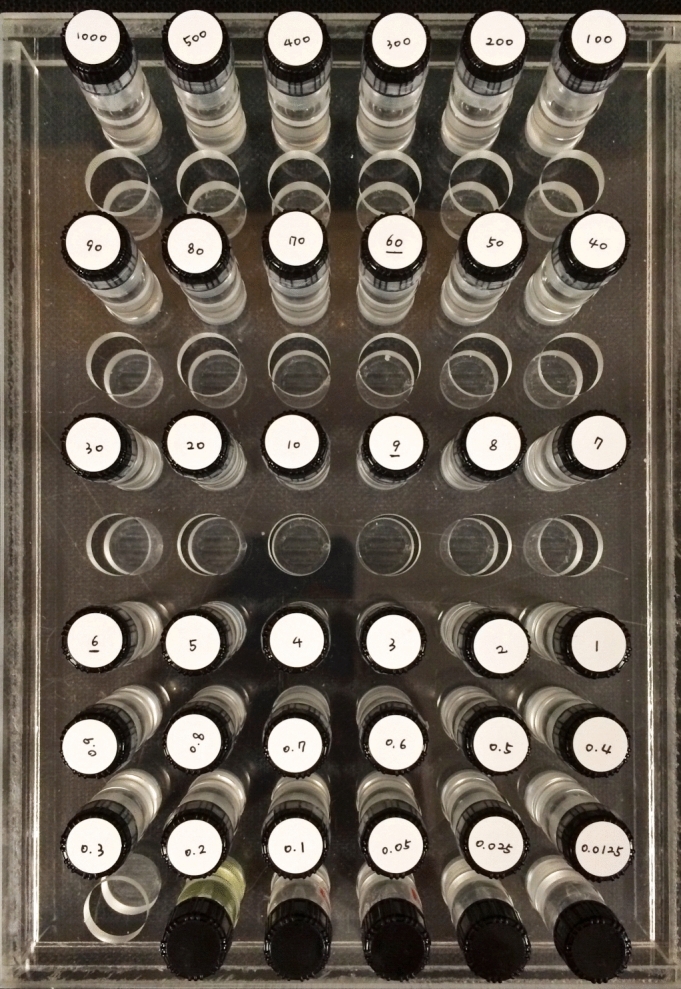
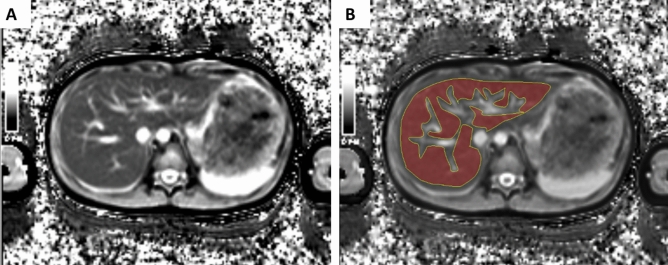
We investigated the feasibility of free-breathing modified Look-Locker inversion recovery (MOLLI) sequence for measuring hepatic T1 values in children and young adults. To investigate the accuracy and the reproducibility of the T1 maps, a phantom study was performed with 12 different gadoterate meglumine concentrations and the T1 relaxation times of phantoms measured with the MOLLI sequence were compared against those measured with three different sequences: spin-echo inversion recovery, variable flip angle (VFA), and VFA with B1 correction. To evaluate the feasibility of free-breathing MOLLI sequence, hepatic T1 relaxation times obtained by free-breathing and breath-hold technique in twenty patients were compared. The phantom study revealed the excellent accuracy and reproducibility of MOLLI. In twenty patients, the mean value of hepatic T1 values obtained by free-breathing (606.7 ± 64.5 ms) and breath-hold (609.8 ± 64.0 ms) techniques showed no significant difference (p > 0.05). The Bland-Altman plot between the free-breathing and breath-hold revealed that the mean difference of T1 values was - 3.0 ms (- 0.5%). Therefore, T1 relaxation times obtained by MOLLI were comparable to the values obtained using the standard inversion recovery method. The hepatic T1 relaxation times measured by MOLLI technique with free-breathing were comparable to those obtained with breath-hold in children and young adults.


Conflict of interest statement

The authors declare no competing interests.

Figures

Figure 1
Figure 1
Correlation plot between 12 different concentrations of gadoterate meglumine and the T1 relaxation time. The Pearson correlation coefficient was 0.993 (p < 0.001).
Figure 2
Figure 2
Correlation plot between T1 relaxation time measured in phantoms with VFA, VFA with B1 correction, and MOLLI versus standard SE-IR. (A) Correlation plot between T1 relaxation time measured with VFA and SE-IR (Pearson correlation coefficient = 0.999, ICC = 0.845). (B) Correlation plot between T1 relaxation time measured with VFA with B1 correction and SE-IR (Pearson correlation coefficient = 0.999, ICC = 0.994). (C) Correlation plot between T1 relaxation time measured with MOLLI and SE-IR (Pearson correlation coefficient = 0.999, ICC = 0.999).
Figure 3
Figure 3
Bland–Altman Curve between VFA and SE-IR, VFA with B1 correction and SE-IR, and MOLLI and SE-IR. (A) Bland–Altman Curve between VFA and SE-IR (mean difference = − 39.5%, 95% LOA = − 46.1–− 33.0%). (B) Bland–Altman Curve between VFA with B1 correction and SE-IR (mean difference = − 0.8%, 95% LOA = − 25.8–24.2%). (C) Bland–Altman Curve between MOLLI and SE-IR (mean difference = 3.0%, 95% LOA = − 1.2–7.2%).
Figure 4
Figure 4
Comparison between free breathing and breath-hold methods in MOLLI sequences. (A) The correlation between T1 relaxation time obtained by MOLLI sequence with free breathing and breath-hold methods (Pearson correlation coefficient = 0.993, p < 0.001). (B) Bland–Altman Curve between free breathing and breath-hold methods in MOLLI sequences (mean difference = − 0.5%, 95% LOA = − 2.9–1.9%).
Figure 5
Figure 5
Phantom objects. Phantom tubes containing multiple vials of various Gadoterate meglumine concentrations.
Figure 6
Figure 6
Modified Look-Locker Inversion Recovery (MOLLI) pulse sequence with 3(4)3(4)5(0) scheme. Three sets of look-locker experiments were performed with increasing inversion times. Three, three, and five images were acquired after the first, second, and third inversion pulses, respectively with four RR intervals between each inversion pulse for T1 recovery.
Figure 7
Figure 7
Example of a hepatic T1 map obtained by MOLLI sequence and the measurement of T1 relaxation time. (A) T1 map obtained by MOLLI sequence in a 13-year-old boy. (B) An example of the measurement of T1 relaxation time by the manual drawing of ROI with the exclusion of hepatic vasculature.

References

    1. DellaCorte C, et al. Pediatric liver diseases: current challenges and future perspectives. Expert Rev. Gastroenterol. Hepatol. 2016;10:255–265. doi: 10.1586/17474124.2016.1129274. - DOI - PubMed
    1. Binkovitz LA, et al. Pediatric MR elastography of hepatic fibrosis: principles, technique and early clinical experience. Pediatr. Radiol. 2012;42:402–409. doi: 10.1007/s00247-011-2298-6. - DOI - PMC - PubMed
    1. Regev A, et al. Sampling error and intraobserver variation in liver biopsy in patients with chronic HCV infection. Am. J. Gastroenterol. 2002;97:2614–2618. doi: 10.1111/j.1572-0241.2002.06038.x. - DOI - PubMed
    1. Mansoor S, Collyer E, Alkhouri N. A comprehensive review of noninvasive liver fibrosis tests in pediatric nonalcoholic fatty liver disease. Curr. Gastroenterol. Rep. 2015;17:23. doi: 10.1007/s11894-015-0447-z. - DOI - PubMed
    1. Cassinotto C, et al. MR relaxometry in chronic liver diseases: Comparison of T1 mapping, T2 mapping, and diffusion-weighted imaging for assessing cirrhosis diagnosis and severity. Eur. J. Radiol. 2015;84:1459–1465. doi: 10.1016/j.ejrad.2015.05.019. - DOI - PubMed

Publication types