. 2020 Oct 27;3(1):618.
doi: 10.1038/s42003-020-01350-0.

Spatiotemporal identification of druggable binding sites using deep learning

Affiliations

Spatiotemporal identification of druggable binding sites using deep learning

Igor Kozlovskii et al. Commun Biol. .

Abstract

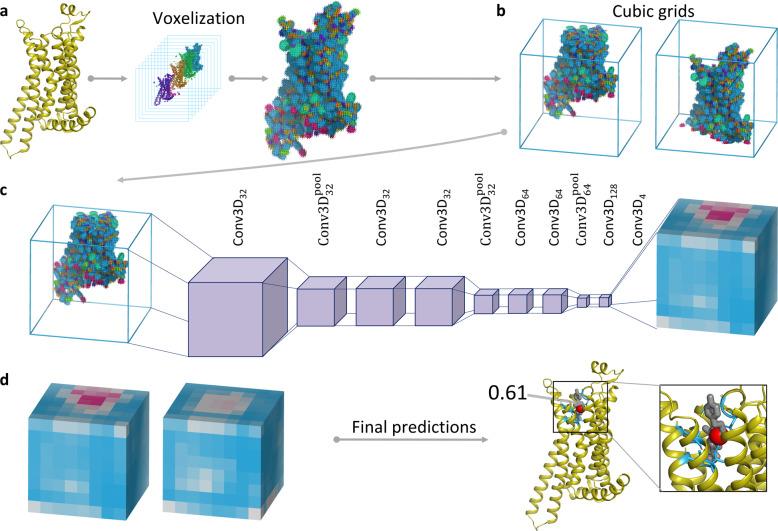
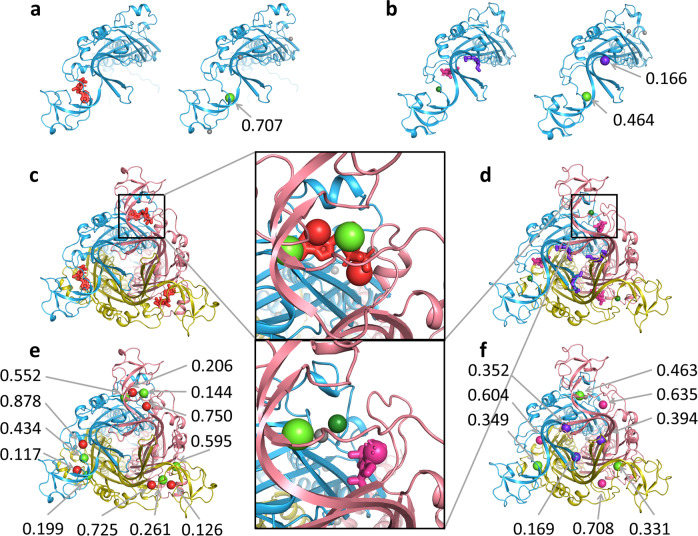
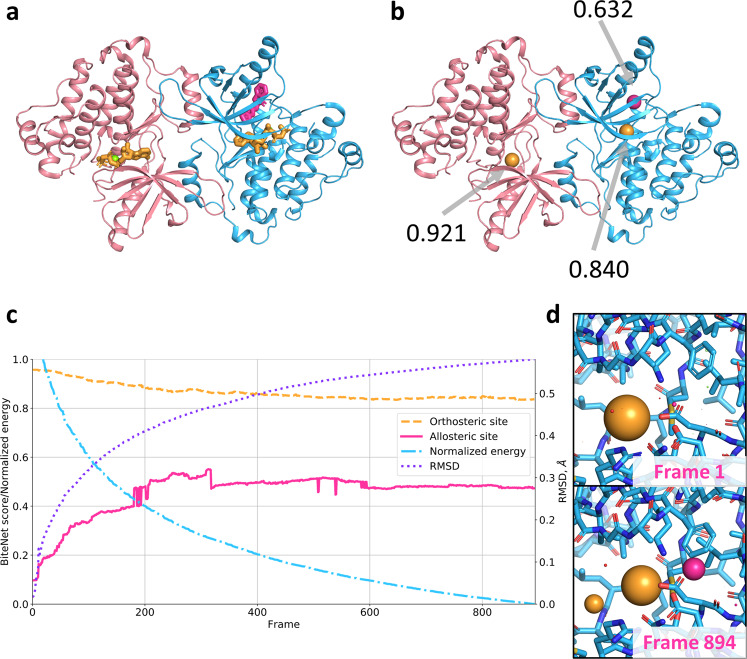
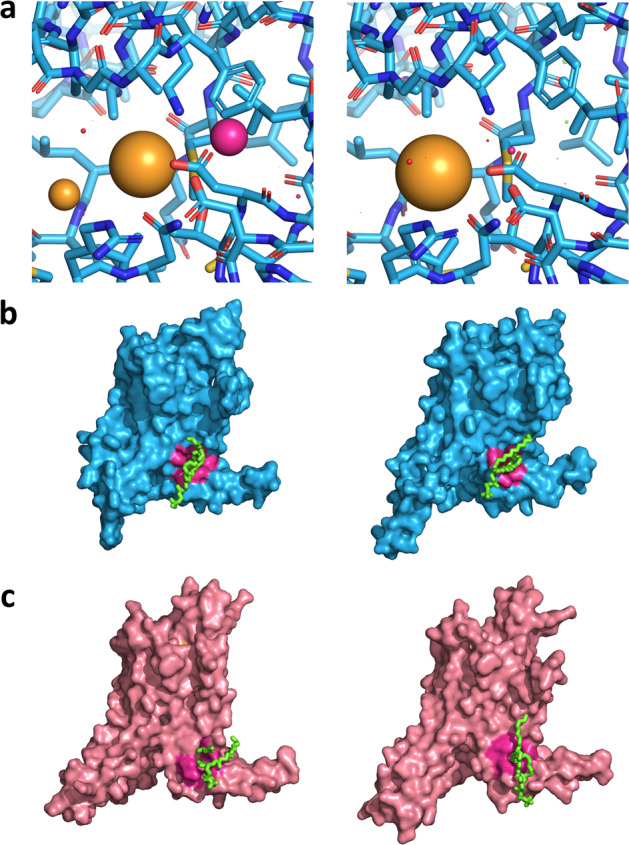
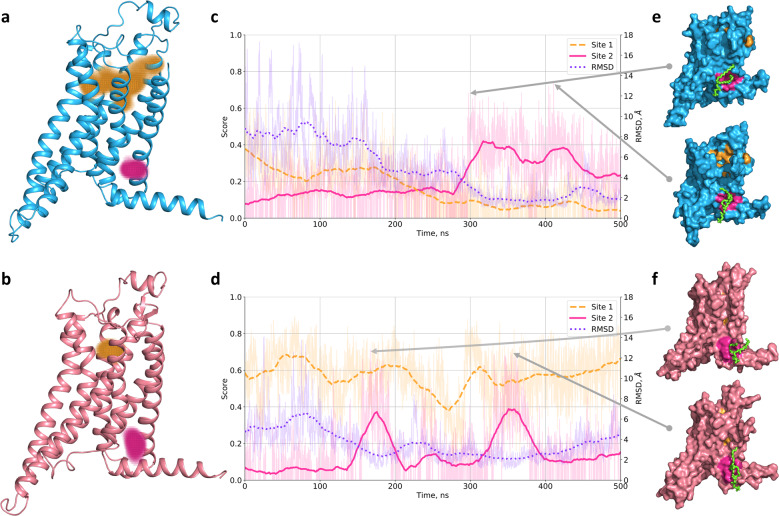
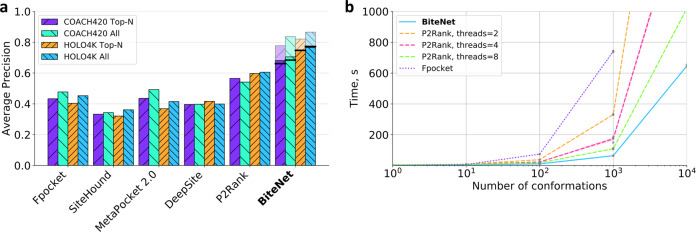
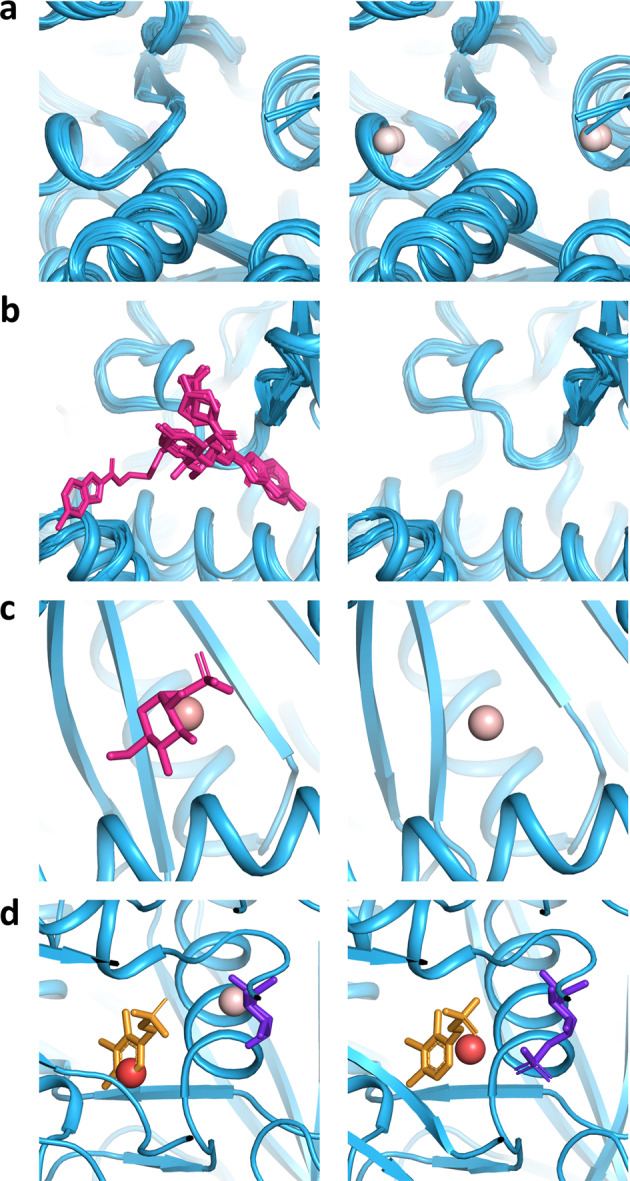
Identification of novel protein binding sites expands druggable genome and opens new opportunities for drug discovery. Generally, presence or absence of a binding site depends on the three-dimensional conformation of a protein, making binding site identification resemble the object detection problem in computer vision. Here we introduce a computational approach for the large-scale detection of protein binding sites, that considers protein conformations as 3D-images, binding sites as objects on these images to detect, and conformational ensembles of proteins as 3D-videos to analyze. BiteNet is suitable for spatiotemporal detection of hard-to-spot allosteric binding sites, as we showed for conformation-specific binding site of the epidermal growth factor receptor, oligomer-specific binding site of the ion channel, and binding site in G protein-coupled receptor. BiteNet outperforms state-of-the-art methods both in terms of accuracy and speed, taking about 1.5 minutes to analyze 1000 conformations of a protein with ~2000 atoms.


Conflict of interest statement

The authors declare no competing interests.

Figures

Fig. 1
Fig. 1. Schematic representation of the BiteNet workflow.
a The input three-dimensional structure of a protein is represented with voxel grid, where channels correspond to the atomic densities. b The voxel grid is split into fixed-size cubic grids to be fed a neural network. c Each cubic grid is processed with the 3D convolutional neural network to predict binding sites in fixed-size cells. Cells in cubic grids are colored according to the probability score confidence, from blue to red. d Predictions obtained for each cubic grid are then processed to output center of the binding site (red sphere), its probability score, and amino acid residues within 6 Å of the predicted center (blue sticks). Co-crystallized ligand is shown with gray sticks.
Fig. 2
Fig. 2. BiteNet predictions for the monomer and oligomer structure of the P2X3 receptor.
a Monomer structure with the orthosteric ligand and cation ion alongside the BiteNet prediction for this structure. b Monomer structure with the allosteric ligand, cation ion and ethylene glycole alongside the BiteNet prediction for this structure. c, d Agonist-bound and antagonist-bound structures of the P2X3 trimer, respectively. e, f BiteNet predictions for the agonist-bound and antagonist-bound structures of the P2X3 trimer, respectively. Orthosteric and allosteric ligands are shown with red and magenta sticks, respectively. cation ions are shown as dark green spheres and ethylene glycol molecules are shown with violet sticks. BiteNet predictions for these molecules are shown as spheres with the corresponding color.
Fig. 3
Fig. 3. BiteNet predictions for the energy minimization trajectory of the assymetric dimer structure of the EGFR kinase domain.
a Assymetric dimer structure of the EGFR kinase domain. Orthosteric and allosteric ligands are shown with yellow and magenta sticks, respectively, Mg ion is shown as green sphere. b BiteNet predictions for the assymetric dimer, the predicted centers for the ligands are shown as spheres with the corresponding color. c BiteNet predictions obtained for the energy minimization trajectory. The normalized energy is shown with blue dash-dotted line, the RMSD with respect to the unbound conformation of the alloteric binding site is shown with violet dotted line, BiteNet probability score for the orthosteric and allosteric binding sites are shown with dashed orange and magenta solid lines, respectively. The normalized energy of 1 and 0 corresponds to  −7.76969 × 105 kJ/mol and  −8.80655 × 105 kJ/mol, respectively. d The starting and the final conformations of the minimization trajectory along with BiteNet predictions.
Fig. 4
Fig. 4. Video frames of energy minimization and molecular dynamic trajectories analyzed with BiteNet.
a BiteNet applied to the minimization trajectory of the EGFR kinase domain starting from the unbound state (Supplementary Movie 1). Predictions corresponding to the orthosteric and allosteric sites are shown as yellow and magenta spheres, respectively. Frames 1 and 894 are shown. b, c BiteNet applied to the ligand-free (b) and ligand-bound (c) A2A molecular dynamics trajectory (Supplementary Movies 2 and 3, respectively). BiteNet predictions for the orthosteric and hypothethical binding sites are colored with yellow and magenta, respectively. Lipid molecule, that occupies the identified binding site, is shown with green sticks. Frames 1489 and 2055 are shown for the ligand-free simulation, and frames 835 and 1806 are shown for the ligand-bound simulation.
Fig. 5
Fig. 5. BiteNet predictions for molecular dynamics trajectories of the adenosine A2A receptor.
a, b Starting ligand-free and agonist-bound conformations of A2A, respectively. Orange point clouds corresponds to the BiteNet predictions of the canonical orthosteric binding site in A2A, while magenta point cloud corresponds to the BiteNet predictions of the hypothetical binding site, observed during the simulation. c, d BiteNet probability scores for the orthosteric binding site (dashed orange line), allosteric binding site (magenta solid line), and RMSD with respect to the window-based mean lipid tail conformation (dotted violet line), computed for the molecular dynamics trajectories. e, f A2A conformations corresponding to the highest BiteNet probability scores for the hypothetical binding site. Lipid molecule, that occupies the hypothetical binding site, is shown with green sticks.
Fig. 6
Fig. 6. Predictive power and computational efficiency of BiteNet.
a Performance of the binding site prediction methods on the COACH420 and HOLO4K benchmarks. Violet and orange bars with diagonal hatching correspond to the average precision calculated for top N predictions for the COACH420 and HOLO4K benchmarks, respectively, where N is the number of true binding sites in a protein. Similarly, cyan and blue back hatched bars correspond to the average precision calculated for all predictions for the COACH420 and HOLO4K benchmarks, respectively. Pale bars correspond to the BiteNet performance, when the true positive binding site is defined as in the training. Black lines correspond to the BiteNet performance on the whole benchmarks. b Elapsed time for fpocket (dotted violet line), P2Rank (dashed orange, magenta, and green lines), and BiteNet (solid blue line) to analyze 1, 10, 1000, and 10,000 conformations of a protein with  ~2000 atoms. The computed elapsed time is the average of ten independent runs, individual data points are shown with gray circles.
Fig. 7
Fig. 7. BiteNet performance on the most representative protein families in the HOLO4K benchmark.
Average precision calculated for protein families with at least 20 protein structures in the HOLO4K benchmark is shown with diagonal hatched blue bars. Ratio of structures from each protein family presented in the training set is shown with back diagonal hatched orange bars.
Fig. 8
Fig. 8. Examples of BiteNet prediction errors on the Glycosil transferase protein family (IPR000811).
a Low scored false positive predictions, for which there are no bound ligands. b False negative predictions, that is absence of predictions in the proximity of the bound ligand. c Similar predictions may correspond to both the true positive and false positive predictions depending on the presence (PDB ID: 3GPB) or absence (PDB ID: 1FU7) of the bound ligand. d Catalytic site with two ligands is predicted either as two (PDB ID: 1LWN) or single (PDB ID: 5GPB) binding sites, resulting in false negative predictions. BiteNet predictions are depicted with spheres colored from white to red with respect to the probability score, and ligands are depicted with magenta, yellow and purple sticks.

References

    1. Hopkins AL, Groom CR. The druggable genome. Nat. Rev. Drug Discov. 2002;1:727. doi: 10.1038/nrd892. - DOI - PubMed
    1. Christopoulos A, et al. International union of basic and clinical pharmacology. xc. multisite pharmacology: recommendations for the nomenclature of receptor allosterism and allosteric ligands. Pharmacol. Rev. 2014;66:918. doi: 10.1124/pr.114.008862. - DOI - PMC - PubMed
    1. Changeux J-P. The concept of allosteric modulation: an overview. Drug Discov. Today. 2013;10:e223. doi: 10.1016/j.ddtec.2012.07.007. - DOI - PubMed
    1. Wagner JR, et al. Emerging computational methods for the rational discovery of allosteric drugs. Chem. Rev. 2016;116:6370. doi: 10.1021/acs.chemrev.5b00631. - DOI - PMC - PubMed
    1. Lu S, Ji M, Ni D, Zhang J. Discovery of hidden allosteric sites as novel targets for allosteric drug design. Drug Discov. Today. 2018;23:359. doi: 10.1016/j.drudis.2017.10.001. - DOI - PubMed

Substances