

Analysis of streaming potential flow and electroviscous effect in a shear-driven charged slit microchannel
- PMID: 33110227
- PMCID: PMC7591916
- DOI: 10.1038/s41598-020-75531-6
Analysis of streaming potential flow and electroviscous effect in a shear-driven charged slit microchannel
Abstract
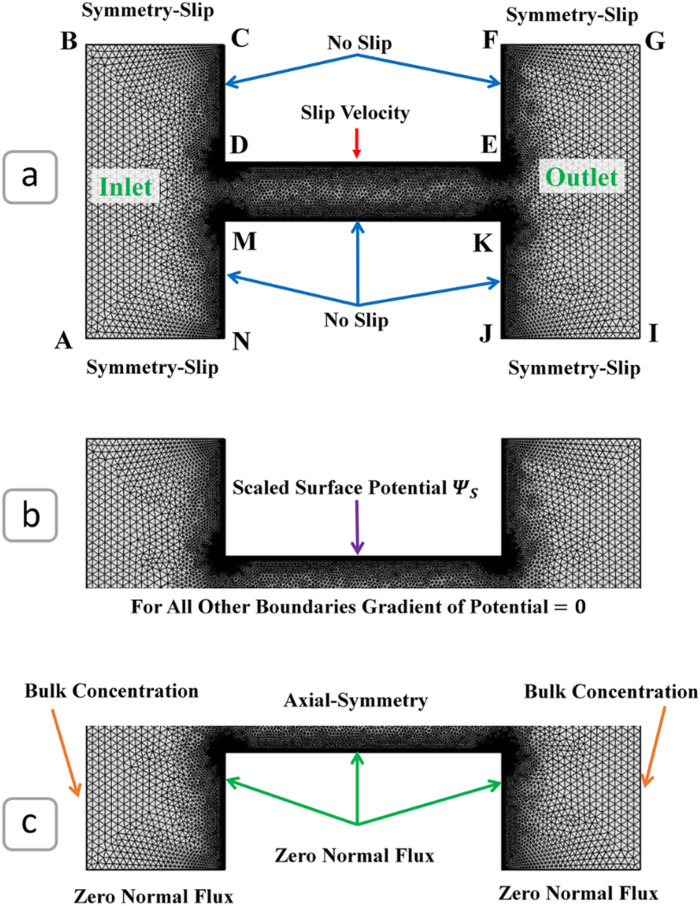
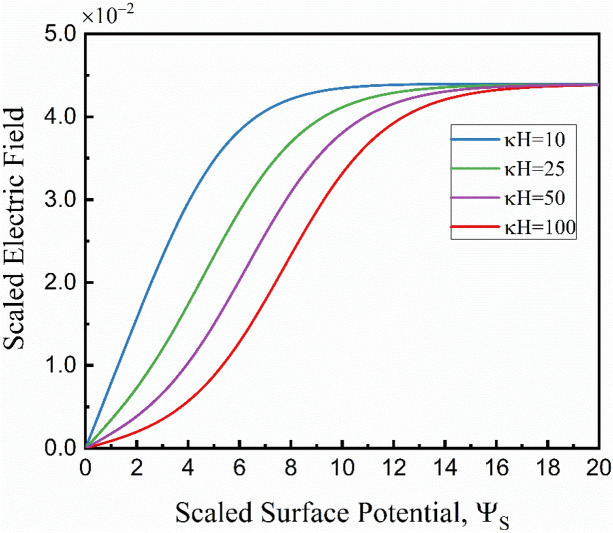
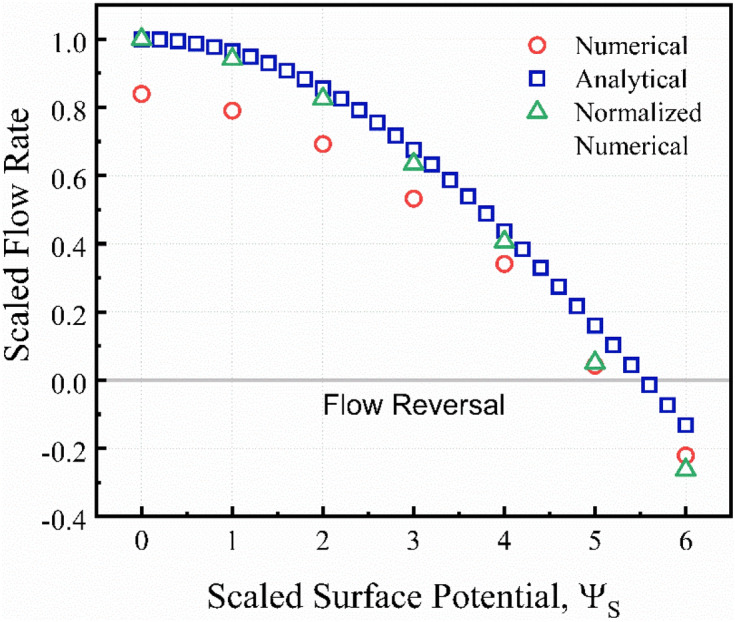
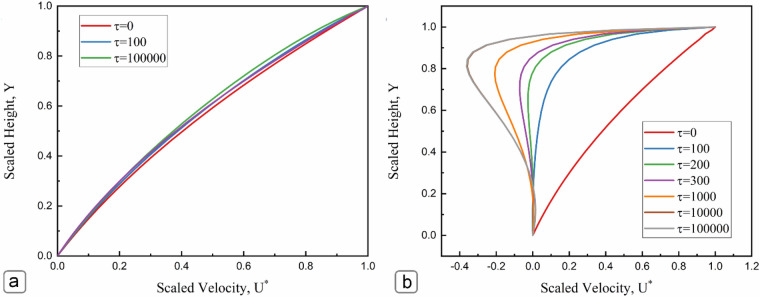
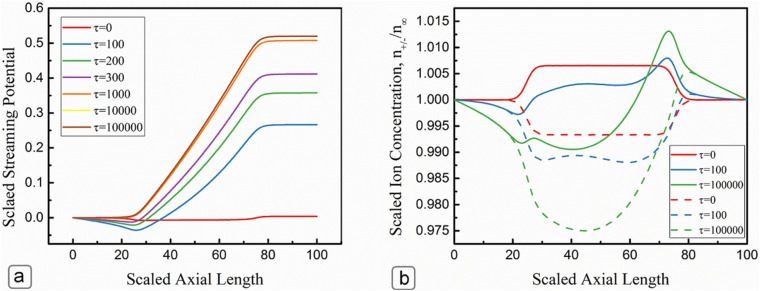
Investigating the flow behavior in microfluidic systems has become of interest due to the need for precise control of the mass and momentum transport in microfluidic devices. In multilayered-flows, precise control of the flow behavior requires a more thorough understanding as it depends on multiple parameters. The following paper proposes a microfluidic system consisting of an aqueous solution between a moving plate and a stationary wall, where the moving plate mimics a charged oil-water interface. Analytical expressions are derived by solving the nonlinear Poisson-Boltzmann equation along with the simplified Navier-Stokes equation to describe the electrokinetic effects on the shear-driven flow of the aqueous electrolyte solution. The Debye-Huckel approximation is not employed in the derivation extending its compatibility to high interfacial zeta potential. Additionally, a numerical model is developed to predict the streaming potential flow created due to the shear-driven motion of the charged upper wall along with its associated electric double layer effect. The model utilizes the extended Nernst-Planck equations instead of the linearized Poisson-Boltzmann equation to accurately predict the axial variation in ion concentration along the microchannel. Results show that the interfacial zeta potential of the moving interface greatly impacts the velocity profile of the flow and can reverse its overall direction. The numerical results are validated by the analytical expressions, where both models predicted that flow could reverse its overall direction when the interfacial zeta potential of the oil-water is above a certain threshold value. Finally, this paper describes the electroviscous effect as well as the transient development of electrokinetic effects within the microchannel.
Conflict of interest statement
The authors declare no competing interests.
Figures


Similar articles
-
Streaming Potential and Associated Electrokinetic Effects through a Channel Filled with Electrolyte Solution Surrounded by a Layer of Immiscible and Dielectric Liquid.Langmuir. 2024 Jun 4;40(22):11695-11712. doi: 10.1021/acs.langmuir.4c01082. Epub 2024 May 20. Langmuir. 2024. PMID: 38767139
-
Streaming-potential-mediated pressure-driven transport of Phan-Thien-Tanner fluids in a microchannel.Phys Rev E. 2020 May;101(5-1):053104. doi: 10.1103/PhysRevE.101.053104. Phys Rev E. 2020. PMID: 32575225
-
The Streaming Potential of Fluid through a Microchannel with Modulated Charged Surfaces.Micromachines (Basel). 2021 Dec 30;13(1):66. doi: 10.3390/mi13010066. Micromachines (Basel). 2021. PMID: 35056231 Free PMC article.
-
Electrokinetic Phenomena in Homogeneous Cylindrical Pores.J Colloid Interface Sci. 1999 Aug 15;216(2):285-296. doi: 10.1006/jcis.1999.6321. J Colloid Interface Sci. 1999. PMID: 10421736
-
Analysis of rotation-driven electrokinetic flow in microscale gap regions of rotating disk systems.J Colloid Interface Sci. 2004 Jan 15;269(2):484-98. doi: 10.1016/s0021-9797(03)00652-0. J Colloid Interface Sci. 2004. PMID: 14654411
References
-
- Li X, Zhou Y. Microfluidic Devices for Biomedical Applications. Cambridge: Woodhead Publishing Limited; 2013.
Grants and funding
LinkOut - more resources
Full Text Sources
