. 2021 Jan;40(1):203-214.
doi: 10.1038/s41388-020-01526-2. Epub 2020 Oct 27.

Sox2 is necessary for androgen ablation-induced neuroendocrine differentiation from Pten null Sca-1+ prostate luminal cells

Affiliations

Sox2 is necessary for androgen ablation-induced neuroendocrine differentiation from Pten null Sca-1+ prostate luminal cells

Oh-Joon Kwon et al. Oncogene. 2021 Jan.

Abstract

Prostate adenocarcinoma undergoes neuroendocrine differentiation to acquire resistance toward antihormonal therapies. The underlying mechanisms have been investigated extensively, among which Sox2 has been shown to play a critical role. However, genetic evidence in mouse models for prostate cancer to support the crucial role of Sox2 is missing. The adult mouse prostate luminal cells contain both castration-resistant Sox2-expressing Sca-1+ cells and castration-responsive Sca-1- cells. We show that both types of the luminal cell are susceptible to oncogenic transformation induced by loss of function of the tumor suppressor Pten. The tumors derived from the Sca-1+ cells are castration resistant and are more inclined to develop castration-induced neuroendocrine differentiation. Genetic ablation of Sox2 suppresses neuroendocrine differentiation but does not impact the castration-resistant property. This study provides direct genetic evidence that Sox2 is necessary for androgen ablation-induced neuroendocrine differentiation of Pten null prostate adenocarcinoma, corroborates that the lineage status of the prostate cancer cells is a determinant for its propensity to exhibit lineage plasticity, and supports that the intrinsic features of cell-of-origin for prostate cancers can dictate their clinical behaviors.


Conflict of interest statement

Disclosure of Potential Conflicts of Interest

The authors declare no conflict of interest.

Figures
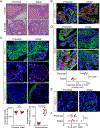
Figure 1.
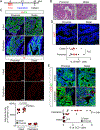
Figure 1.. Both Sca-1+ and Sca-1 luminal cells can serve as targets for transformation induced by Pten loss.
(A) H&E staining of proximal and distal anterior prostate of K8-Pten mice at 1 and 6 months after tamoxifen treatment (N=8 and 9, respectively). Scale bars:100 μm. (B-C) Co-immunostaining of pAKT/K8 (B), K5/K8 (C, upper), Ar/K14 (C, middle), and Nkx3.1/Smooth muscle actin (SMa) (C, lower) in proximal and distal prostates of K8-Pten mice 6 months after tamoxifen treatment. Scale bars:50 μm. Dot plots show integrated density of staining of Ar (left) and Nkx3.1 (right) (N=8, each dot represents average value from 3 representative images from each mouse). (D) Co-immunostaining of Sox2/K8 in proximal and distal prostates of K8-Pten mice 6 months after tamoxifen treatment. Scale bars:50 μm. Dot plot shows integrated density of staining of Sox2 (N=8, each dot represents average value from 3 representative images from each mouse). (E) Co-immunostaining of Ki67/K5 in proximal and distal prostates of K8-Pten mice 6 months after tamoxifen treatment. Scale bars:50 μm. (F) Dot plot shows means ± SD of percentage of Ki67+ cells in proximal and distal prostates of K8-Pten mice 6 months after tamoxifen treatment (N=8, each dot represents average value from 6 representative images of individual mouse). N.S.: no significance.
Figure 2.
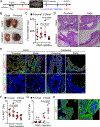
Figure 2.. Prostate cancer derived from Sca-1+ luminal cells displays castration-resistance.
(A) Schematic illustration of experimental design. Tmx: tamoxifen. (B) H&E staining of proximal and distal anterior prostates of castrated K8-Pten mice. Scale bar: 25 μm. (C) Co-immunostaining of Ar/K8 (upper panels) in proximal and distal prostates of intact and castrated K8-Pten mice. Lower panels show Ar staining only. Scale bar: 50 μm. Dot plot shows integrated density of Ar staining (N=8, each dot represents average value from 3 representative images from each mouse). (D-E) Immunostaining of Ki67 (E) and cleaved caspase 3 (CC3) (F) in proximal and distal regions of androgen depleted K8-Pten mice. Scale bars:50 μm. Dot plots show means ± SD of percentage of positively stained cells (N=8, each dot shows average value from 6 representative images of individual mice). N.S.; no significance.
Figure 3.
Figure 3.. Transplantation experiment corroborates that prostate cancer derived from Sca-1+ luminal cells displays castration-resistance.
(A) Schematic illustration of experimental design. Tmx: tamoxifen. (B) Representative transillumination images of tumors outgrown from distal and proximal prostate chunks of tamoxifen-treated K8-Pten mice in host SCID mice underwent mock surgery and androgen deprivation-replacement. Scale bars:5 mm. (C) Dot plot shows means ± SD of weight of tumors (N=6). (D) H&E staining of transplanted tissues in intact or castrated SCID mice. Scale bars:100 μm. (E) Co-immunostaining of pAKT/K8 (upper) and Nkx3.1/Trp63 (lower) of transplants outgrown from proximal and distal prostate of tamoxifen-treated K8-Pten mice in intact and castrated SCID hosts. Scale bars:50 μm. (F) Dot plot shows means ± SD of percentage of Ki67+ cells (N=6, each dot shows average value from 6 representative images from each mouse). (G) Dot plot shows means ± SD of percentage of CC3+ cells (N=6, each dot shows average value from 6 representative images from each mouse). (H) Co-immunostaining of Ar/K8 of transplants outgrown from proximal prostate tissues of tamoxifen-treated K8-Pten mice in intact SCID hosts. Scale bar: 50 μm.
Figure 4.
Figure 4.. Androgen deprivation drives neuroendocrine differentiation of prostate cancer cells at proximal ducts of K8-Pten mice.
(A) Immunostaining of Chga in anterior prostates of K8-Pten mice at 3 months after mock surgery (intact, upper panel) or castration (castration, lower panel) and 6 months after tamoxifen treatment. Scale bar:200 μm. (B) Pie charts show quantification of size of NE colonies (Chga+ or Syp+) in proximal and distal regions of intact (N=9) and castrated (N=10) K8-Pten mice (results summarized from 10–20 representative images per mouse). (C) Co-immunostaining of Sox2/Syp of tumors outgrown from transplanted proximal and distal prostate of tamoxifen-treated K8-Pten mice under kidney capsules of castrated SCID mice. Scale bars:25 μm. Pie charts show quantification of size of NE colonies (Chga+ or Syp+) (N=6, results summarized from 16–30 representative images per mouse). (D) Co-immunostaining of pAKT/Syp (upper) and Pten/Syp (lower) of proximal prostates of castrated K8-Pten mice. Scale bars:25 μm. (E) Co-immunostaining of Ki67/Syp in proximal prostates of castrated K8-Pten mice. Scale bar: 50 μm.
Figure 5.
Figure 5.. Sox2 is not essential for the castration resistant property.
(A) Dot plot shows means ± SD of prostate weight of intact and castrated K8-Pten and K8-Pten-Sox2 mice (N=8). N.S.: no significance. (B-C) H&E staining (B) and co-immunostaining of Sox2/Trp63 (C, upper panels) and pAKT/K8 (C, lower panels) in intact and castrated K8-Pten and K8-Pten-Sox2 mice. Black bars:100 μm; white bars:25 μm. Dot plot shows the integrated density of Sox2 staining (N=8, each dot represents average value from 3 representative images from each mouse). (D-E) Dot plots show means ± SD of percentages of Ki67+ (D) and CC3+ (E) cells in proximal and distal regions of intact and castrated K8-Pten and K8-Pten-Sox2 mice (N=8, each dot indicates average value from 6 representative images per individual mouse). N.S.: no significance.
Figure 6.
Figure 6.. Sox2 is necessary for androgen deprivation-induced neuroendocrine differentiation of Pten-null prostate tumor cells.
(A) Co-immunostaining of Chga/Syp in proximal and distal prostates of intact and castrated K8-Pten and K8-Pten-Sox2 mice. White arrows point to Chga+/Syp+ cells. Scale bars:25 μm. (B) Pie charts show quantification of size of neuroendocrine colony in proximal prostates of intact and castrated K8-Pten and K8-Pten-Sox2 mice (N=8, results summarized from 8–15 representative images per mouse). (C) Co-immunostaining of Chga/Syp of transplanted tissues in intact and castrated SCID mice. Arrows point to neuroendocrine cells. Scale bars=25 μm. (D) Pie charts show quantification of neuroendocrine colony size. N=5–7. Results summarized from 13–25 representative images per mouse.

Similar articles

Cited by

References

    1. Quintanal-Villalonga A, Chan JM, Yu HA, Pe’er D, Sawyers CL, Sen T, et al. Lineage plasticity in cancer: a shared pathway of therapeutic resistance . Nature reviews Clinical oncology. 2020;17(6):360–71. Epub 2020/03/11. - PMC - PubMed
    1. Sequist LV, Waltman BA, Dias-Santagata D, Digumarthy S, Turke AB, Fidias P, et al. Genotypic and histological evolution of lung cancers acquiring resistance to EGFR inhibitors. Science translational medicine. 2011;3(75):75ra26. Epub 2011/03/25. - PMC - PubMed
    1. Konieczkowski DJ, Johannessen CM, Abudayyeh O, Kim JW, Cooper ZA, Piris A, et al. A melanoma cell state distinction influences sensitivity to MAPK pathway inhibitors. Cancer discovery. 2014;4(7):816–27. Epub 2014/04/29. - PMC - PubMed
    1. Labrecque MP, Coleman IM, Brown LG, True LD, Kollath L, Lakely B, et al. Molecular profiling stratifies diverse phenotypes of treatment-refractory metastatic castration-resistant prostate cancer. The Journal of clinical investigation. 2019;130:4492–505. Epub 2019/07/31. - PMC - PubMed
    1. Davies AH, Beltran H, Zoubeidi A. Cellular plasticity and the neuroendocrine phenotype in prostate cancer. Nature reviews Urology. 2018;15(5):271–86. Epub 2018/02/21. - PubMed

Publication types

MeSH terms