

Use of Processed Electroencephalography in the Clinical Setting
- PMID: 33110400
- PMCID: PMC7581499
- DOI: 10.1007/s40140-020-00424-3
Use of Processed Electroencephalography in the Clinical Setting
Abstract
Purpose of review: Processed electroencephalography (pEEG) is widely used in clinical practice. Few clinicians utilize the full potential of these devices. This brief review will address the improvements in patient management available from the utilization of all pEEG data.
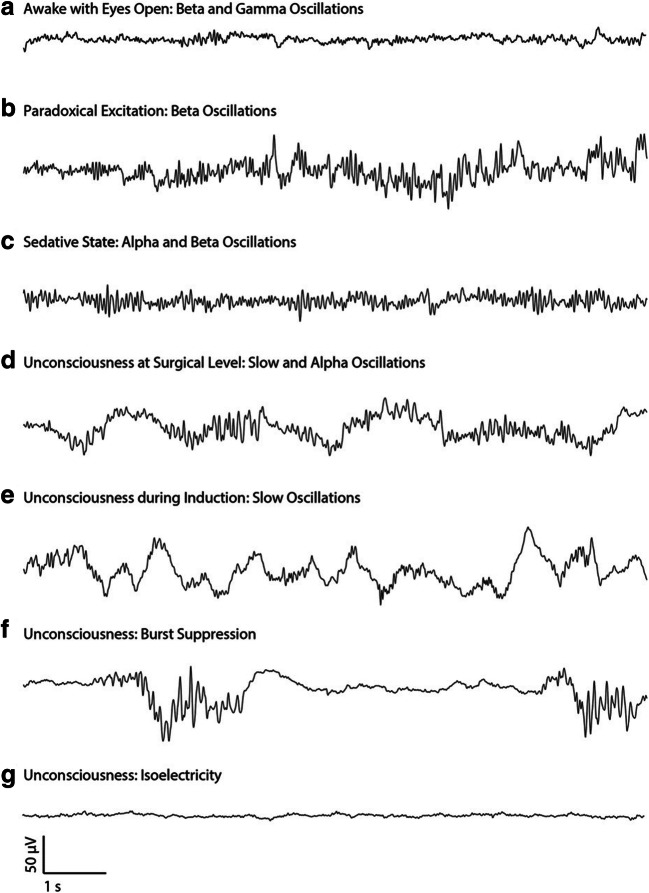
Recent findings: Anesthesiologists easily learn to recognize raw pEEG patterns that are consistent with an appropriate level of hypnotic effect. Power distribution within the waveform can be displayed in a visual format that identifies signatures of the principal anesthetic hypnotics. Opinion on the benefit of pEEG data in the mitigation of postoperative neurological impairment remains divided.
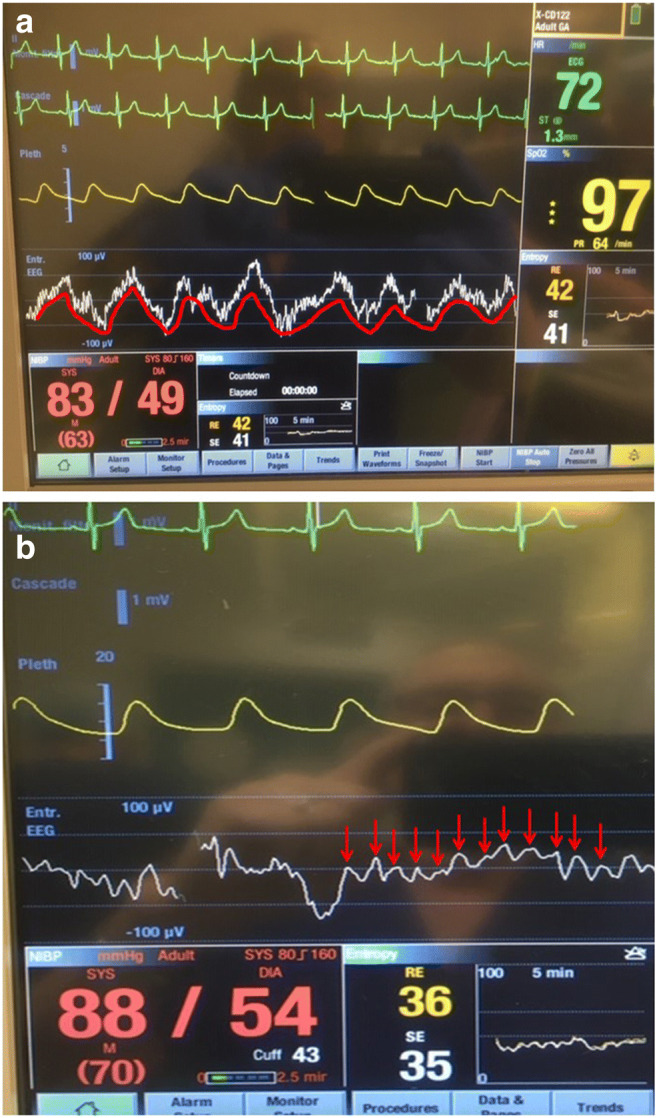
Summary: Looking beyond the index number can aid clinical decision making and improve confidence in the benefits of this monitoring modality.
Keywords: Alpha/delta pattern; BIS; Bispectral index; Density spectral array; Excessive anesthesia; Postoperative neurological deterioration; Power spectra; Processed electroencephalography; pEEG.
© Springer Science+Business Media, LLC, part of Springer Nature 2020.
Conflict of interest statement
Conflict of InterestDavid A. Mulvey has received honoraria for teaching activities on behalf of Gwenagen Ltd., the UK distributor of the Narcotrend pEEG device, and is the President of the UK Society for Intravenous Anaesthesia. Peter Klepsch declares that he has no conflict of interest.
Figures


Similar articles
-
Practical Training of Anesthesia Clinicians in Electroencephalogram-Based Determination of Hypnotic Depth of General Anesthesia.Anesth Analg. 2020 Mar;130(3):777-786. doi: 10.1213/ANE.0000000000004537. Anesth Analg. 2020. PMID: 31880629
-
Raw and processed electroencephalography in modern anesthesia practice: a brief primer on select clinical applications.Korean J Anesthesiol. 2021 Dec;74(6):465-477. doi: 10.4097/kja.21349. Epub 2021 Aug 24. Korean J Anesthesiol. 2021. PMID: 34425639 Free PMC article. Review.
-
A comparison of the clinical usefulness of three different electroencephalogram monitors: Bispectral Index, processed electroencephalogram, and Alaris auditory evoked potentials.Anesth Analg. 2004 May;98(5):1341-5, table of contents. doi: 10.1213/01.ane.0000111109.42728.51. Anesth Analg. 2004. PMID: 15105212 Clinical Trial.
-
Depth of Anesthesia Monitoring.Anesthesiol Clin. 2021 Sep;39(3):477-492. doi: 10.1016/j.anclin.2021.04.004. Epub 2021 Jul 12. Anesthesiol Clin. 2021. PMID: 34392880 Review.
-
Misinterpretation and Limitations of pEEG Monitoring During Multimodal General Anesthesia: A Case Report.A A Pract. 2020 Feb 15;14(4):109-111. doi: 10.1213/XAA.0000000000001159. A A Pract. 2020. PMID: 31876559
Cited by
-
Heart rate variability analysis for the prediction of pre-arousal during propofol-remifentanil general anaesthesia: A feasibility study.PLoS One. 2024 Oct 31;19(10):e0310627. doi: 10.1371/journal.pone.0310627. eCollection 2024. PLoS One. 2024. PMID: 39480866 Free PMC article.
-
Volatile Versus Intravenous Anesthetics in Cardiac Anesthesia: a Narrative Review.Curr Anesthesiol Rep. 2021;11(3):275-283. doi: 10.1007/s40140-021-00466-1. Epub 2021 Jul 10. Curr Anesthesiol Rep. 2021. PMID: 34276252 Free PMC article. Review.
-
Quantitative relationship between anteriorization of alpha oscillations and level of general anesthesia.J Clin Monit Comput. 2023 Apr;37(2):609-618. doi: 10.1007/s10877-022-00932-z. Epub 2022 Nov 1. J Clin Monit Comput. 2023. PMID: 36316519
-
Bispectral index with density spectral array (BIS-DSA) monitoring in a patient with inner ear and cerebral decompression sickness.Diving Hyperb Med. 2024 Sep 30;54(3):237-241. doi: 10.28920/dhm54.3.237-241. Diving Hyperb Med. 2024. PMID: 39288931
References
-
- Fahy BG, Chau DF. The technology of processed electroencephalogram monitoring devices for assessment of depth of anesthesia. Anesth Analg. 2018;126(1):111–117. - PubMed
-
- Standards for basic anesthetic monitoring. American Society of Anesthesiologists: Committee on Standards and Practice Parameters. Available at: https://www.asahq.org/standards-and-guidelines/standards-for-basic-anest.... Last Amended: October 28, 2015 (accessed: 09/29/2020).
-
- PS18 2017. Guideline on monitoring during anaesthesia. Australian and New Zealand College of Anaesthetists (ANZCA) Last amended December 2017. (accessed 09/29/2020).
Publication types
LinkOut - more resources
Full Text Sources
Research Materials
Miscellaneous