

A comparative, correlate analysis and projection of global and regional life expectancy, healthy life expectancy, and their GAP: 1995-2025
- PMID: 33110572
- PMCID: PMC7568920
- DOI: 10.7189/jogh.10.020407
A comparative, correlate analysis and projection of global and regional life expectancy, healthy life expectancy, and their GAP: 1995-2025
Abstract
Background: Life expectancy (LE) and healthy life expectancy (HALE) are indicators measuring the national health level. GAP is the difference between them. This study systematically analyzed and projected LE, HALE, and GAP across global regions from 1995 to 2025.
Methods: We obtained the data of 195 countries/regions on their LE, HALE, and influencing factors from 1995 to 2017. We compared the overall changes of LE, HALE, and GAP. Multiple linear regression analysis examined relationships among LE, HALE, GAP, and the associated factors. Using the Autoregressive Integrated Moving Average (ARIMA) model, we projected trends in LE, HALE, and GAP for 2017-2025.
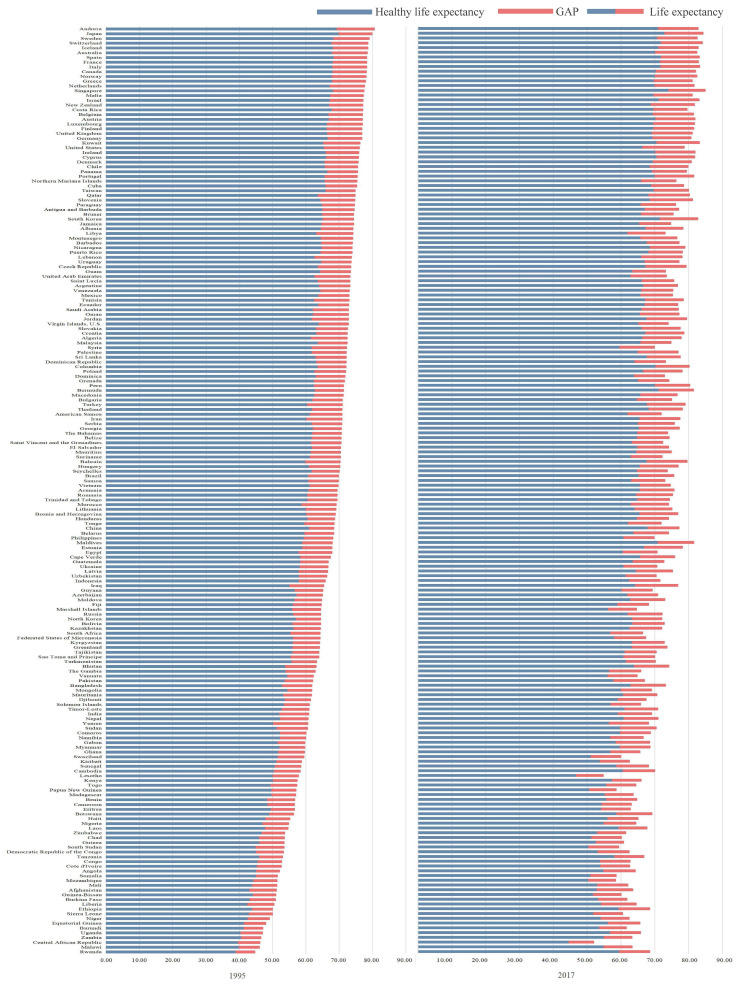
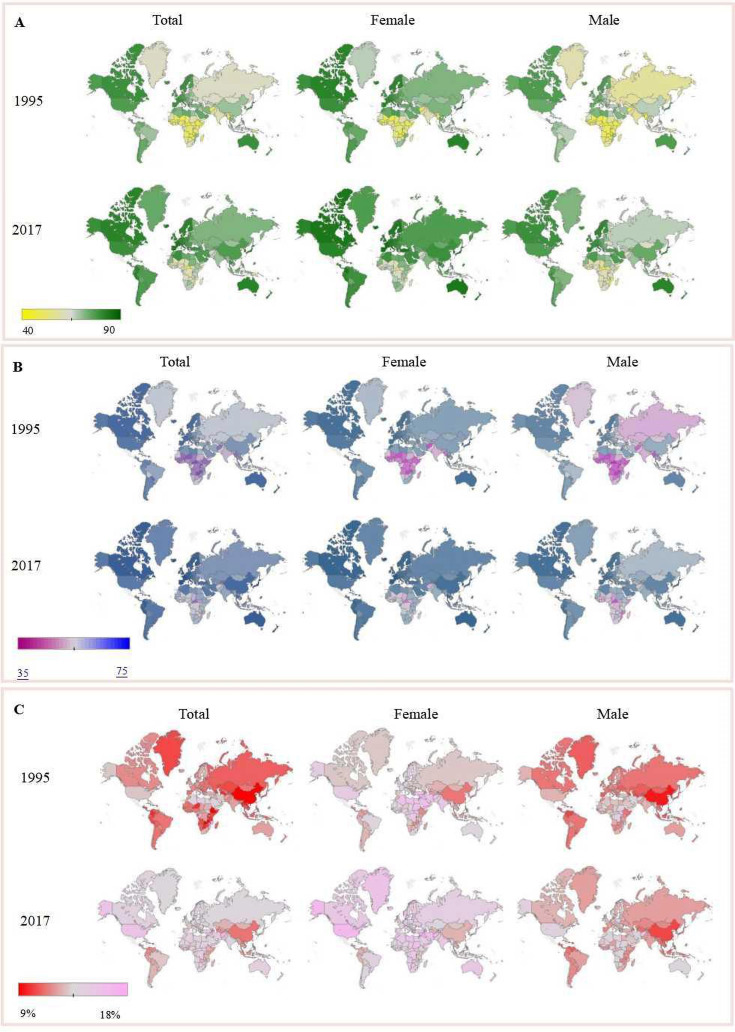
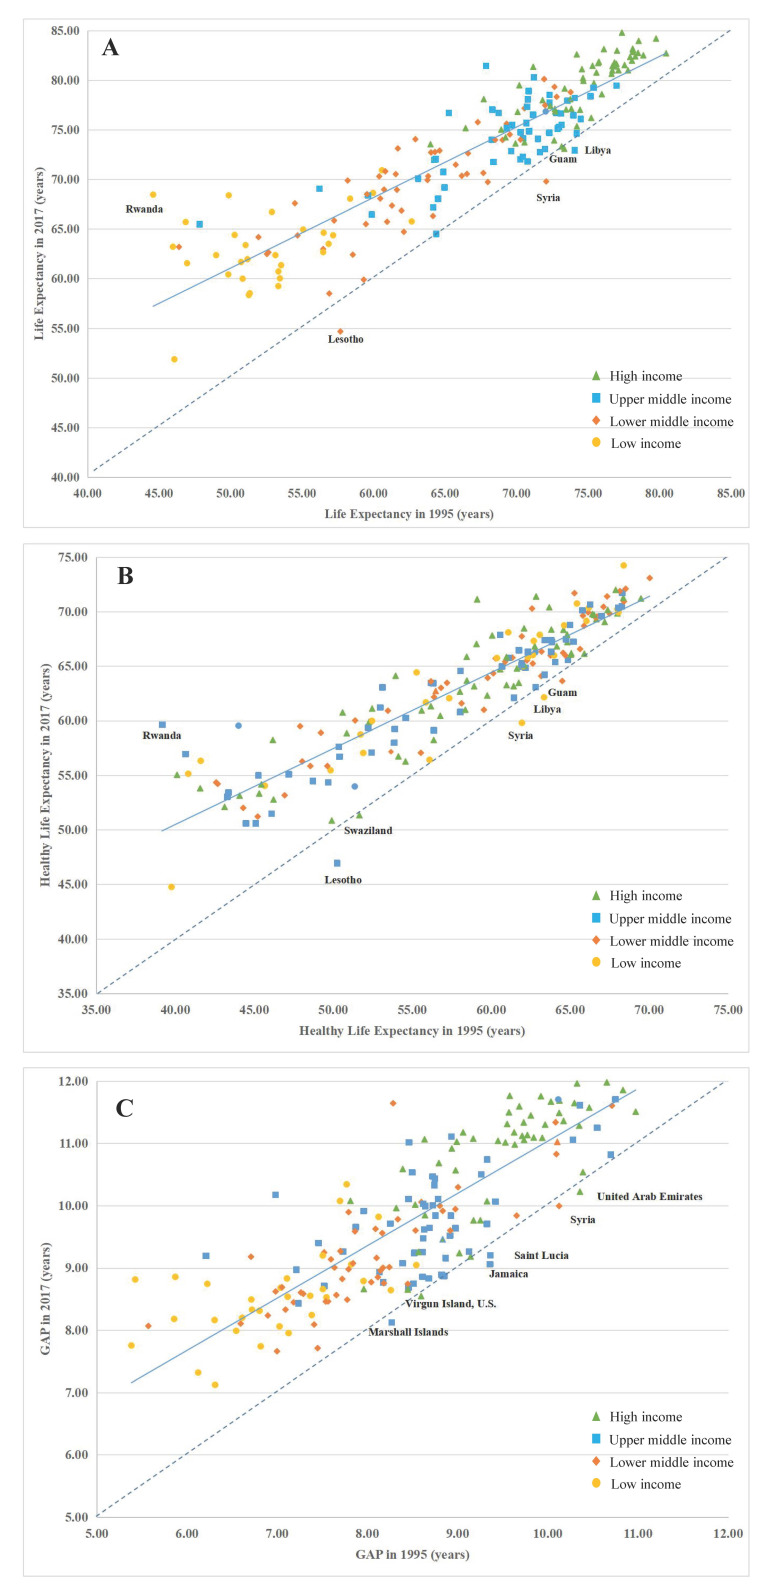
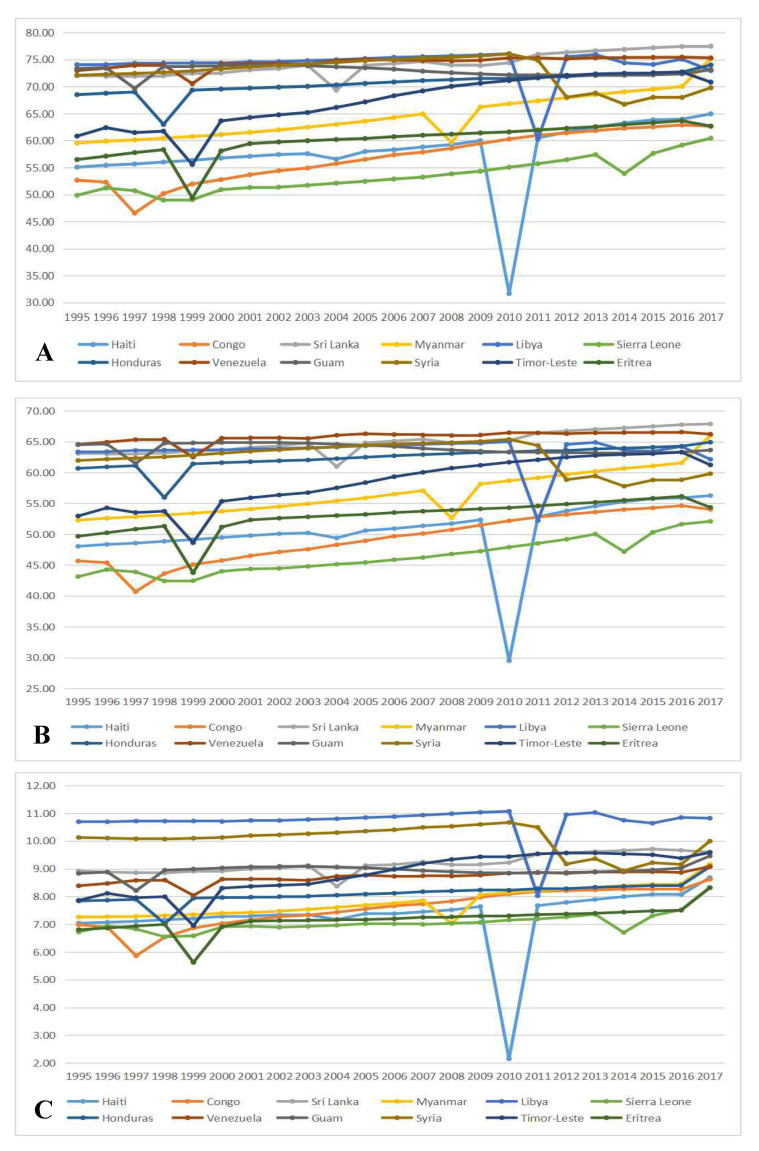
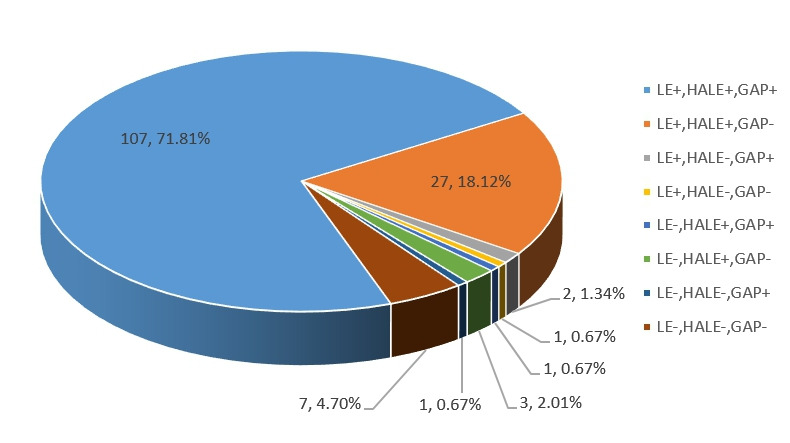
Results: During 1995-2017, LE, HALE, and their GAP in 195 countries/regions in the world showed overall increasing trends. Global average LE increased from 66.20 to 72.98 years, HALE from 57.59 to 63.25 years, and GAP from 8.62 to 9.72 years. LE and HALE in North America, Europe, and Australia were generally higher, while Africa had the lowest rates. Females' LE, HALE, and GAP were all higher than males', but females' growth rates of LE and HALE were lower. Different factors were included to project LE, HALE, and GAP, respectively, and prediction results showed that approximately 18% of the 195 countries/regions might achieve improved LE and HALE and lower GAP.
Conclusions: LE, HALE will likely continue to increase in most of countries and regions worldwide in the future and GAP will further expand. While striving to improve LE and HALE, more attention needs be made to reduce GAP and improve quality of life.
Copyright © 2020 by the Journal of Global Health. All rights reserved.
Conflict of interest statement
Competing interests: The authors completed the ICMJE Unified Competing Interest form (available upon request from the corresponding author), and declare no conflicts of interest.
Figures
References
-
- Life expectancy. Available: https://en.Wikipedia.Org/wiki/life_expectancy/. Accessed: 5 Jan 2018.
-
- The World Health Report 1997–conquering suffering, enriching humanity. World Health Forum. 1997;18:248-60. - PubMed
-
- The global goals. Available: https://www.Globalgoals.Org/https://www.Globalgoals.Org/. Accessed: 5 January 2018.
Publication types
MeSH terms
LinkOut - more resources
Full Text Sources
Miscellaneous
