

Automated Segmentation of Retinal Fluid Volumes From Structural and Angiographic Optical Coherence Tomography Using Deep Learning
- PMID: 33110708
- PMCID: PMC7552937
- DOI: 10.1167/tvst.9.2.54
Automated Segmentation of Retinal Fluid Volumes From Structural and Angiographic Optical Coherence Tomography Using Deep Learning
Abstract
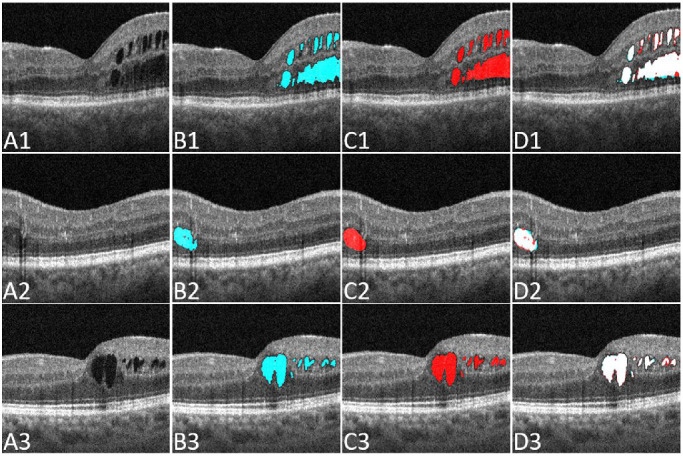
Purpose: We proposed a deep convolutional neural network (CNN), named Retinal Fluid Segmentation Network (ReF-Net), to segment retinal fluid in diabetic macular edema (DME) in optical coherence tomography (OCT) volumes.
Methods: The 3- × 3-mm OCT scans were acquired on one eye by a 70-kHz OCT commercial AngioVue system (RTVue-XR; Optovue, Inc., Fremont, CA, USA) from 51 participants in a clinical diabetic retinopathy (DR) study (45 with retinal edema and six healthy controls, age 61.3 ± 10.1 (mean ± SD), 33% female, and all DR cases were diagnosed as severe NPDR or PDR). A CNN with U-Net-like architecture was constructed to detect and segment the retinal fluid. Cross-sectional OCT and angiography (OCTA) scans were used for training and testing ReF-Net. The effect of including OCTA data for retinal fluid segmentation was investigated in this study. Volumetric retinal fluid can be constructed using the output of ReF-Net. Area-under-receiver-operating-characteristic-curve, intersection-over-union (IoU), and F1-score were calculated to evaluate the performance of ReF-Net.
Results: ReF-Net shows high accuracy (F1 = 0.864 ± 0.084) in retinal fluid segmentation. The performance can be further improved (F1 = 0.892 ± 0.038) by including information from both OCTA and structural OCT. ReF-Net also shows strong robustness to shadow artifacts. Volumetric retinal fluid can provide more comprehensive information than the two-dimensional (2D) area, whether cross-sectional or en face projections.
Conclusions: A deep-learning-based method can accurately segment retinal fluid volumetrically on OCT/OCTA scans with strong robustness to shadow artifacts. OCTA data can improve retinal fluid segmentation. Volumetric representations of retinal fluid are superior to 2D projections.
Translational relevance: Using a deep learning method to segment retinal fluid volumetrically has the potential to improve the diagnostic accuracy of diabetic macular edema by OCT systems.
Keywords: OCT/OCTA; deep learning; retinal fluid volume; segmentation.
Copyright 2020 The Authors.
Conflict of interest statement
Disclosure: Y. Guo, None; T.T. Hormel, None; H. Xiong, None; J. Wang, None; T.S. Hwang, None; Y. Jia, Optovue (F, P)
Figures


Similar articles
-
Multi-Plexus Nonperfusion Area Segmentation in Widefield OCT Angiography Using a Deep Convolutional Neural Network.Transl Vis Sci Technol. 2024 Jul 1;13(7):15. doi: 10.1167/tvst.13.7.15. Transl Vis Sci Technol. 2024. PMID: 39023443 Free PMC article.
-
Classification of diabetes-related retinal diseases using a deep learning approach in optical coherence tomography.Comput Methods Programs Biomed. 2019 Sep;178:181-189. doi: 10.1016/j.cmpb.2019.06.016. Epub 2019 Jun 14. Comput Methods Programs Biomed. 2019. PMID: 31416547
-
Fully Automated Detection and Quantification of Macular Fluid in OCT Using Deep Learning.Ophthalmology. 2018 Apr;125(4):549-558. doi: 10.1016/j.ophtha.2017.10.031. Epub 2017 Dec 8. Ophthalmology. 2018. PMID: 29224926
-
Recent Advanced Deep Learning Architectures for Retinal Fluid Segmentation on Optical Coherence Tomography Images.Sensors (Basel). 2022 Apr 15;22(8):3055. doi: 10.3390/s22083055. Sensors (Basel). 2022. PMID: 35459040 Free PMC article. Review.
-
Deep learning-based detection of diabetic macular edema using optical coherence tomography and fundus images: A meta-analysis.Indian J Ophthalmol. 2023 May;71(5):1783-1796. doi: 10.4103/IJO.IJO_2614_22. Indian J Ophthalmol. 2023. PMID: 37203031 Free PMC article. Review.
Cited by
-
Three-dimensional diabetic macular edema thickness maps based on fluid segmentation and fovea detection using deep learning.Int J Ophthalmol. 2022 Mar 18;15(3):495-501. doi: 10.18240/ijo.2022.03.19. eCollection 2022. Int J Ophthalmol. 2022. PMID: 35310049 Free PMC article.
-
Directional analysis of intensity changes for determining the existence of cyst in optical coherence tomography images.Sci Rep. 2022 Feb 8;12(1):2105. doi: 10.1038/s41598-022-06099-6. Sci Rep. 2022. PMID: 35136133 Free PMC article.
-
Interpretable Diabetic Retinopathy Diagnosis Based on Biomarker Activation Map.IEEE Trans Biomed Eng. 2024 Jan;71(1):14-25. doi: 10.1109/TBME.2023.3290541. Epub 2023 Dec 22. IEEE Trans Biomed Eng. 2024. PMID: 37405891 Free PMC article.
-
Automated Quantification of Pathological Fluids in Neovascular Age-Related Macular Degeneration, and Its Repeatability Using Deep Learning.Transl Vis Sci Technol. 2021 Apr 1;10(4):17. doi: 10.1167/tvst.10.4.17. Transl Vis Sci Technol. 2021. PMID: 34003996 Free PMC article.
-
Nonperfused Retinal Capillaries-A New Method Developed on OCT and OCTA.Invest Ophthalmol Vis Sci. 2025 Apr 1;66(4):22. doi: 10.1167/iovs.66.4.22. Invest Ophthalmol Vis Sci. 2025. PMID: 40202734 Free PMC article.
References
-
- Spaide RF. Retinal vascular cystoid macular edema: review and new theory. Retina. 2016; 36(10): 1823–1842. - PubMed
-
- Gonzalez VH, Campbell J, Holekamp NM, et al. .. Early and long-term responses to anti–vascular endothelial growth factor therapy in diabetic macular edema: analysis of protocol I data. Am J Ophthalmol. 2016; 172: 72–79. - PubMed
-
- Nunes S, Pereira I, Santos A, Bernardes R, Cunha-Vaz J. Central retinal thickness measured with HD-OCT shows a weak correlation with visual acuity in eyes with CSME. Br J Ophthalmol. 2010; 94(9): 1201–1204. - PubMed
Publication types
MeSH terms
Grants and funding
LinkOut - more resources
Full Text Sources
Other Literature Sources
Medical
Research Materials
