Modeling the Formation, Degradation, and Spatiotemporal Distribution of 2-Nitrofluoranthene and 2-Nitropyrene in the Global Atmosphere
- PMID: 33112146
- PMCID: PMC7676291
- DOI: 10.1021/acs.est.0c04319
Modeling the Formation, Degradation, and Spatiotemporal Distribution of 2-Nitrofluoranthene and 2-Nitropyrene in the Global Atmosphere
Abstract
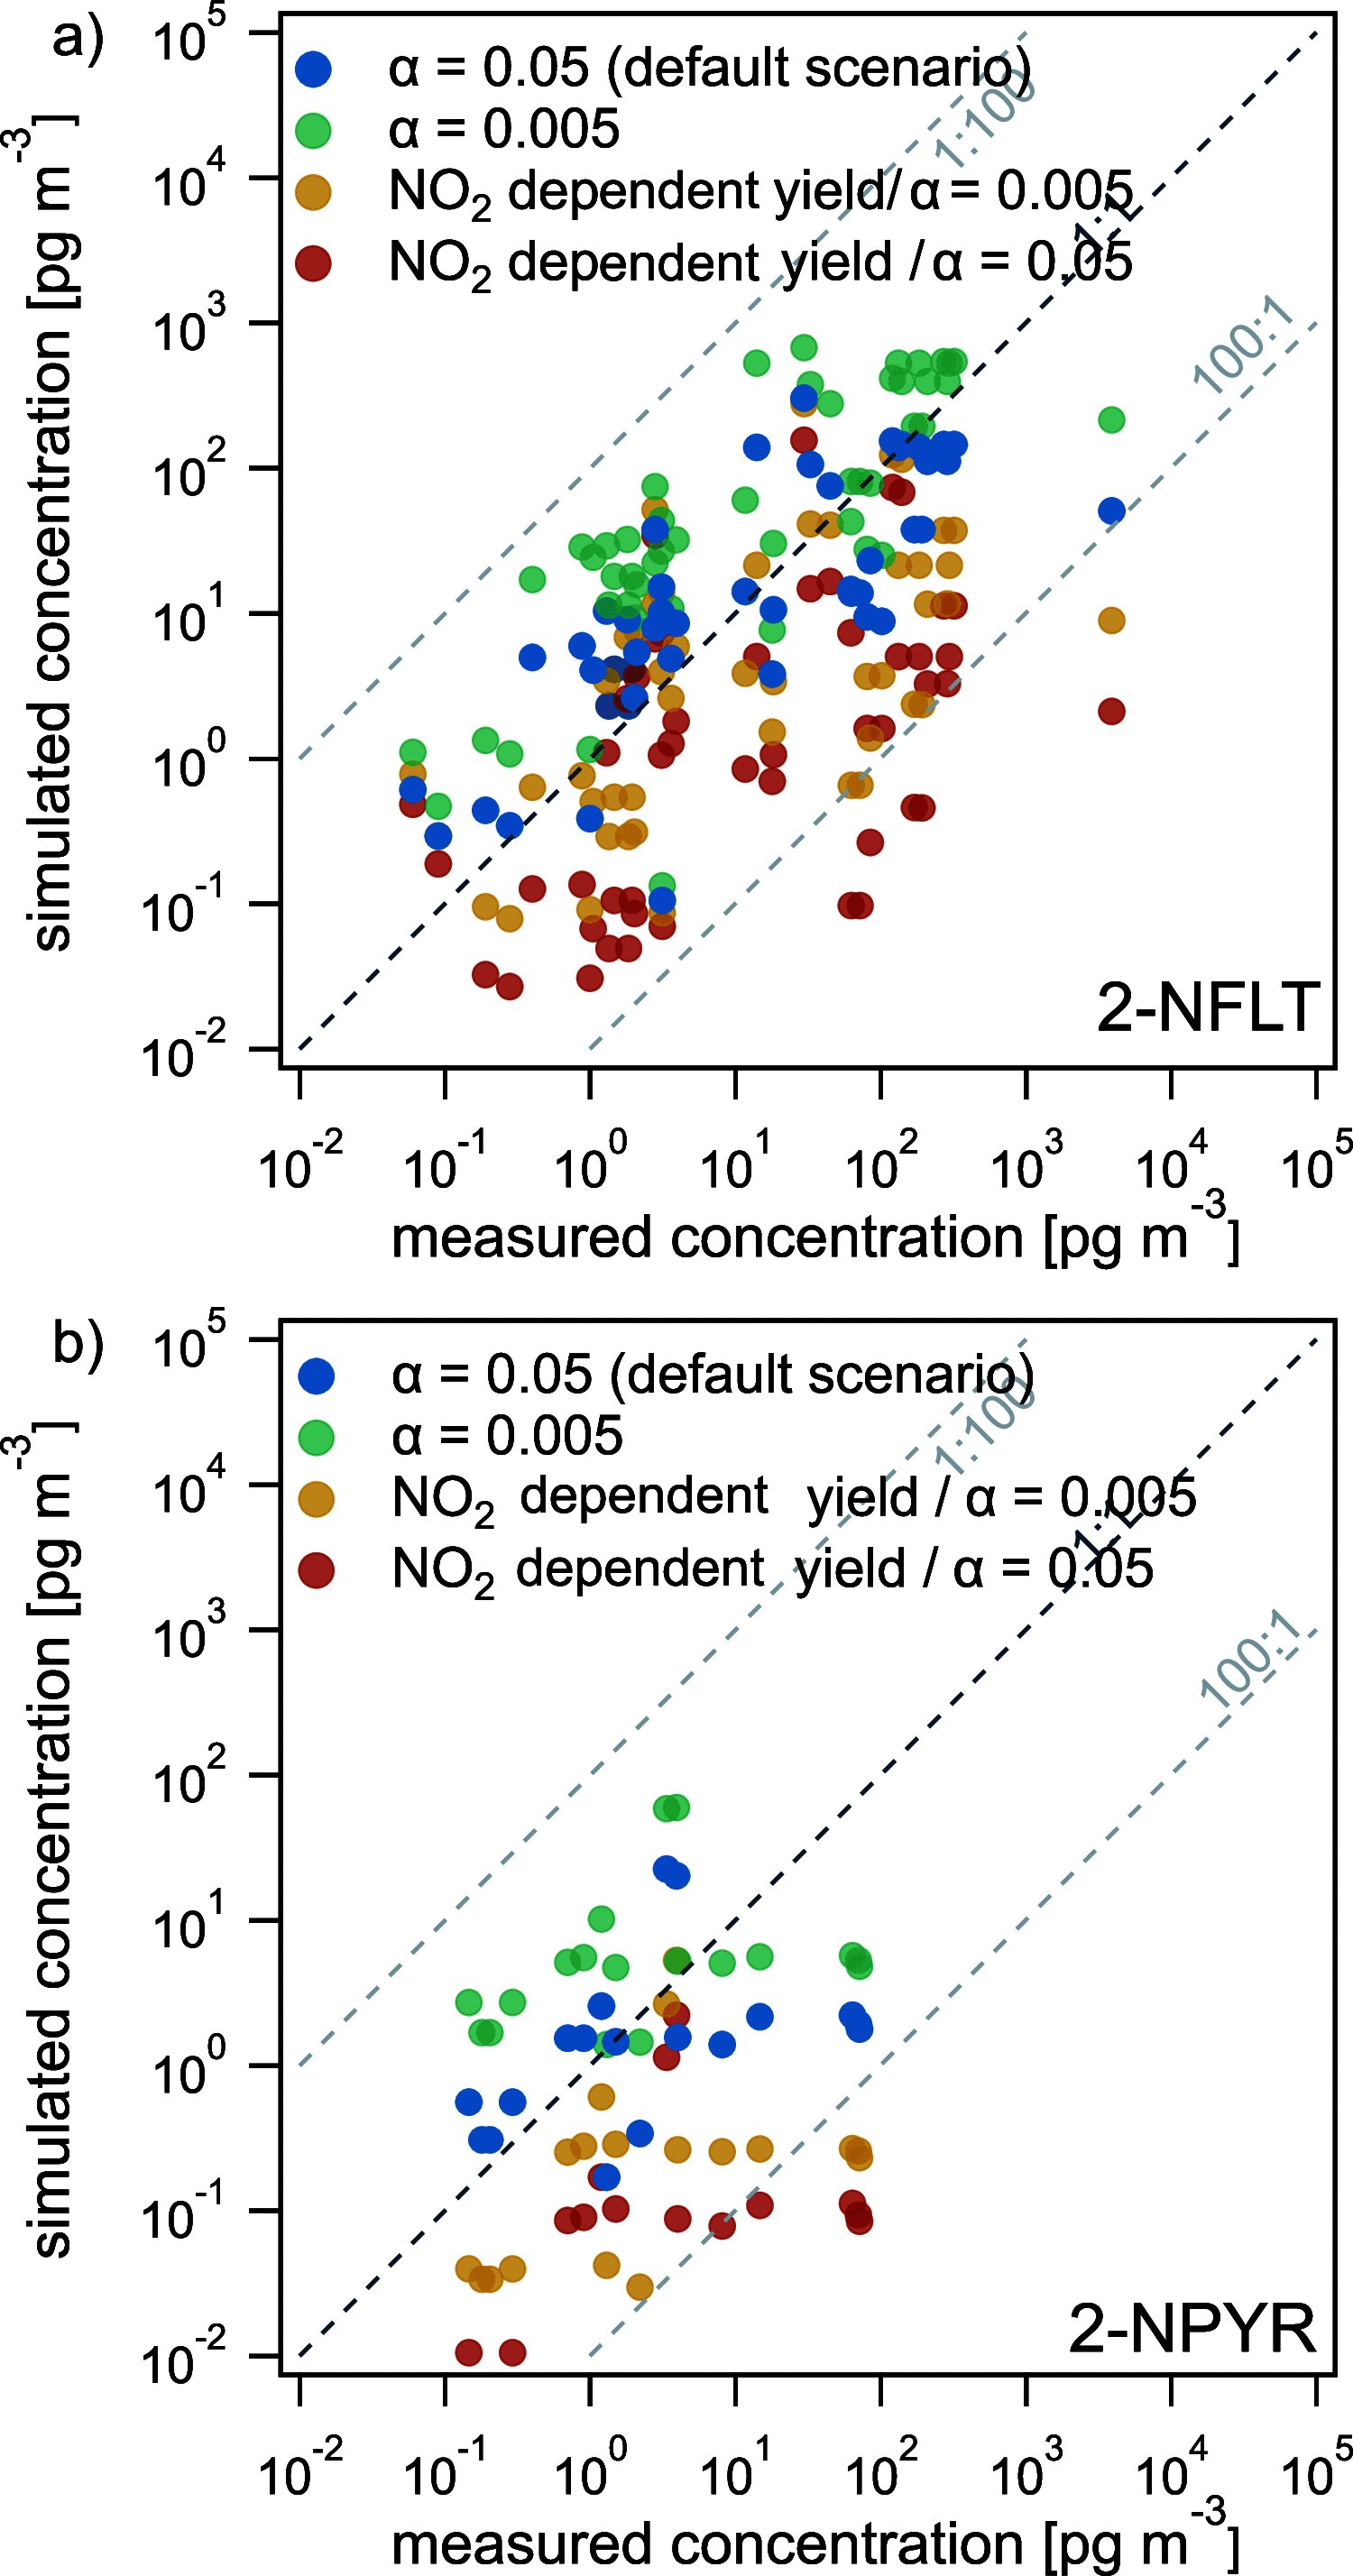
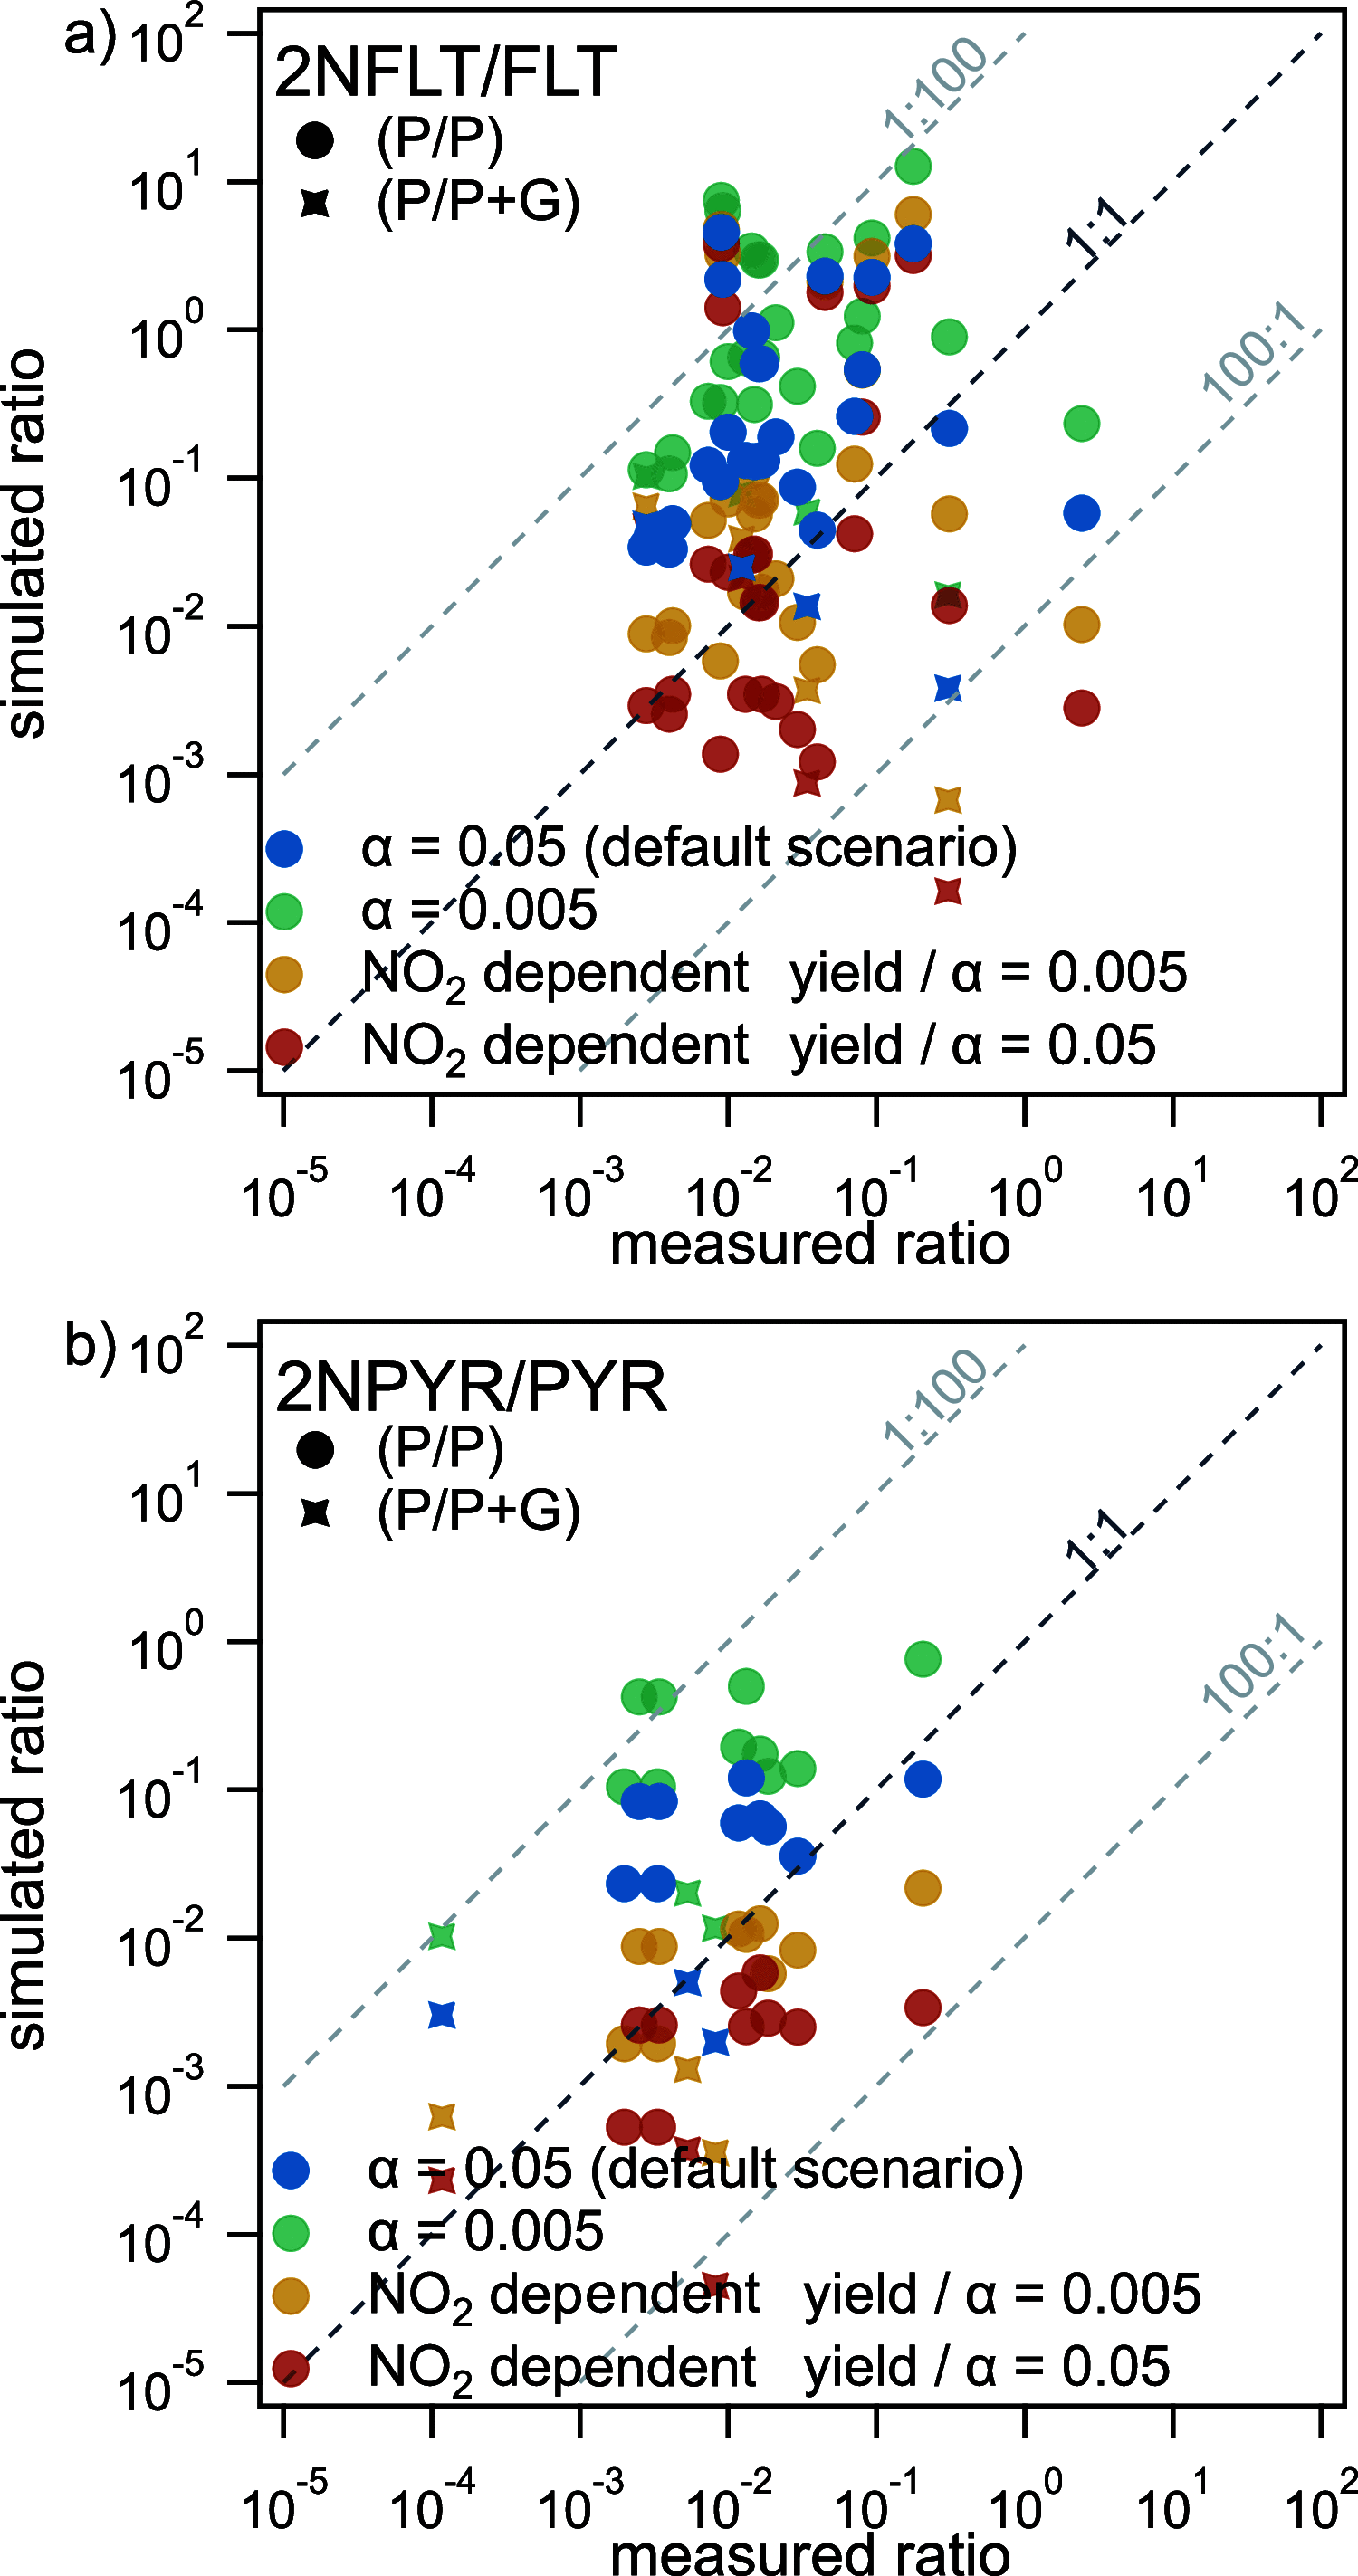
Polycyclic aromatic hydrocarbons (PAHs) are common atmospheric pollutants and known to cause adverse health effects. Nitrated PAHs (NPAHs) are formed in combustion activities and by nitration of PAHs in the atmosphere and may be equally or more toxic, but their spatial and temporal distribution in the atmosphere is not well characterized. Using the global EMAC model with atmospheric chemistry and surface compartments coupled, we investigate the formation, abundance, and fate of two secondarily formed NPAHs, 2-nitrofluoranthene (2-NFLT) and 2-nitropyrene (2-NPYR). The default reactivity scenario, the model with the simplest interpretation of parameters from the literature, tends to overestimate both absolute concentrations and NPAH/PAH ratios at observational sites. Sensitivity scenarios indicate that NO2-dependent NPAH formation leads to better agreement between measured and predicted NPAH concentrations and that photodegradation is the most important loss process of 2-NFLT and 2-NPYR. The highest concentrations of 2-NFLT and 2-NPYR are found in regions with strong PAH emissions, but because of continued secondary formation from the PAH precursors, these two NPAHs are predicted to be spread across the globe.
Conflict of interest statement
The authors declare no competing financial interest.
Figures


Similar articles
-
Diurnal/nocturnal concentrations and sources of particulate-bound PAHs, OPAHs and NPAHs at traffic and suburban sites in the region of Paris (France).Sci Total Environ. 2012 Oct 15;437:297-305. doi: 10.1016/j.scitotenv.2012.07.072. Epub 2012 Sep 1. Sci Total Environ. 2012. PMID: 22947617
-
Emission factors of polycyclic and nitro-polycyclic aromatic hydrocarbons from residential combustion of coal and crop residue pellets.Environ Pollut. 2017 Dec;231(Pt 2):1265-1273. doi: 10.1016/j.envpol.2017.08.087. Epub 2017 Sep 22. Environ Pollut. 2017. PMID: 28947317
-
Concentrations and spatial distribution of polycyclic aromatic hydrocarbons (PAHs) and nitrated PAHs (NPAHs) in the atmosphere of North China, and the transformation from PAHs to NPAHs.Environ Pollut. 2015 Jan;196:164-70. doi: 10.1016/j.envpol.2014.10.005. Environ Pollut. 2015. PMID: 25463710
-
Environmental Behaviors and Toxicities of Polycyclic Aromatic Hydrocarbons and Nitropolycyclic Aromatic Hydrocarbons.Chem Pharm Bull (Tokyo). 2016;64(2):83-94. doi: 10.1248/cpb.c15-00801. Chem Pharm Bull (Tokyo). 2016. PMID: 26833435 Review.
-
Recent analytical methods for atmospheric polycyclic aromatic hydrocarbons and their derivatives.Biomed Chromatogr. 2017 Jan;31(1). doi: 10.1002/bmc.3862. Epub 2016 Nov 22. Biomed Chromatogr. 2017. PMID: 27723111 Review.
Cited by
-
Nitro- and oxy-PAHs in grassland soils from decade-long sampling in central Europe.Environ Geochem Health. 2022 Aug;44(8):2743-2765. doi: 10.1007/s10653-021-01066-y. Epub 2021 Aug 20. Environ Geochem Health. 2022. PMID: 34415461 Free PMC article.
-
Solvent dielectric delimited nitro-nitrito photorearrangement in a perylenediimide derivative.Chem Sci. 2022 Jul 4;13(30):8860-8870. doi: 10.1039/d2sc02979k. eCollection 2022 Aug 4. Chem Sci. 2022. PMID: 35975155 Free PMC article.
-
The Parallel Transformations of Polycyclic Aromatic Hydrocarbons in the Body and in the Atmosphere.Environ Health Perspect. 2022 Feb;130(2):25004. doi: 10.1289/EHP9984. Epub 2022 Feb 28. Environ Health Perspect. 2022. PMID: 35225689 Free PMC article.
-
Global Cancer Risk From Unregulated Polycyclic Aromatic Hydrocarbons.Geohealth. 2021 Sep 1;5(9):e2021GH000401. doi: 10.1029/2021GH000401. eCollection 2021 Sep. Geohealth. 2021. PMID: 34589640 Free PMC article.
-
Evaluation of Orthotrichum lyellii moss as a biomonitor of diesel exhaust.Sci Total Environ. 2024 Apr 20;922:171306. doi: 10.1016/j.scitotenv.2024.171306. Epub 2024 Feb 27. Sci Total Environ. 2024. PMID: 38423310 Free PMC article.
References
-
- Shiraiwa M.; Ueda K.; Pozzer A.; Lammel G.; Kampf C. J.; Fushimi A.; Enami S.; Arangio A. M.; Fröhlich-Nowoisky J.; Fujitani Y.; Furuyama A.; Lakey P. S. J.; Lelieveld J.; Lucas K.; Morino Y.; Pöschl U.; Takahama S.; Takami A.; Tong H.; Weber B.; Yoshino A.; Sato K. Aerosol health effects from molecular to global scales. Environ. Sci. Technol. 2017, 51, 13545–13567. 10.1021/acs.est.7b04417. - DOI - PubMed
-
- Siak J.; Chan T. L.; Gibson T. L.; Wolff G. T. Contribution to bacterial mutagenicity from nitro-PAH compounds in ambient aerosols. Atmos. Environ. 1967, 19, 369–376. 10.1016/0004-6981(85)90104-0. - DOI
Publication types
MeSH terms
Substances
LinkOut - more resources
Full Text Sources

