. 2020 Nov 10;16(11):7207-7218.
doi: 10.1021/acs.jctc.0c00884. Epub 2020 Oct 28.

CHARMM-GUI Free Energy Calculator for Absolute and Relative Ligand Solvation and Binding Free Energy Simulations

Affiliations

CHARMM-GUI Free Energy Calculator for Absolute and Relative Ligand Solvation and Binding Free Energy Simulations

Seonghoon Kim et al. J Chem Theory Comput. .

Abstract

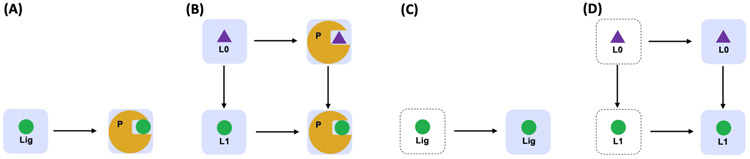
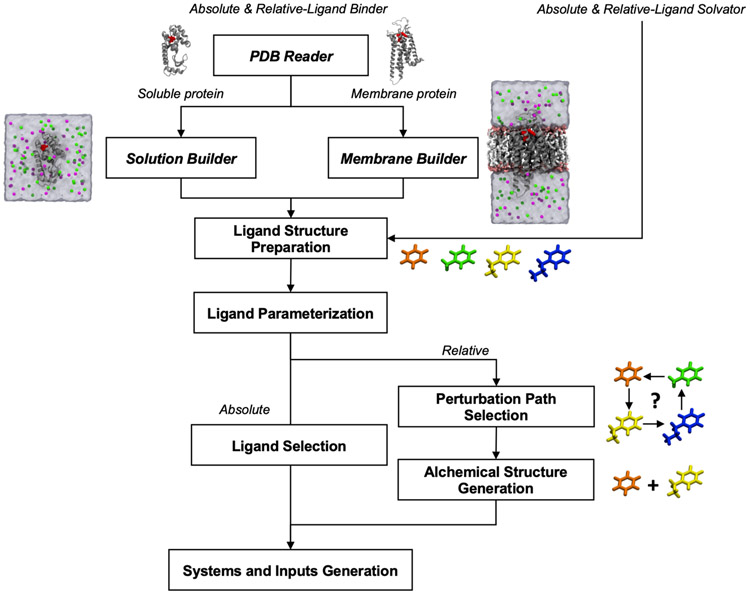
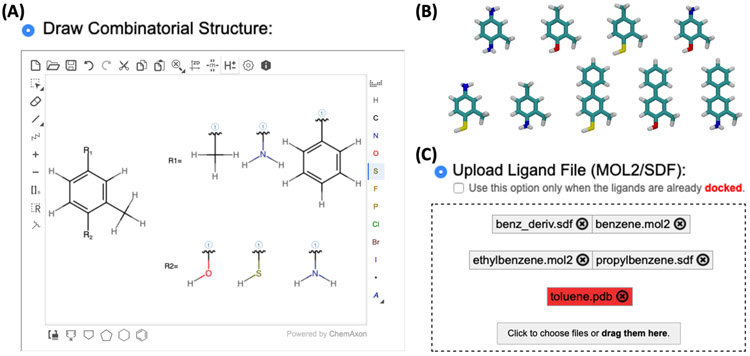
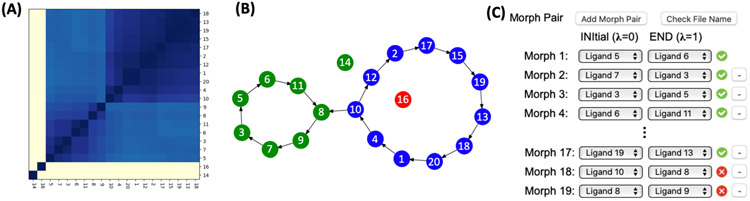
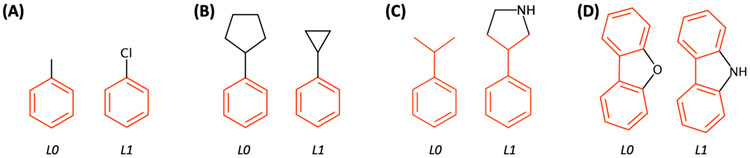
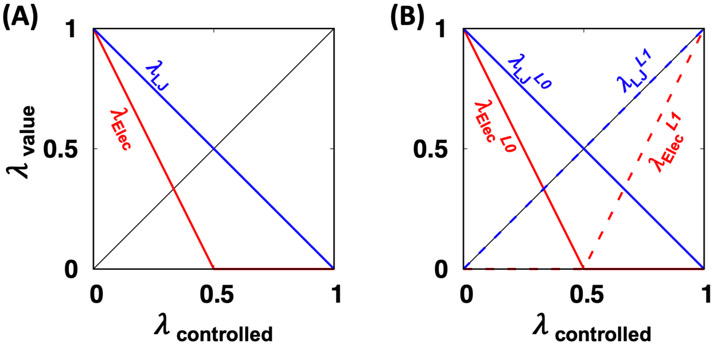
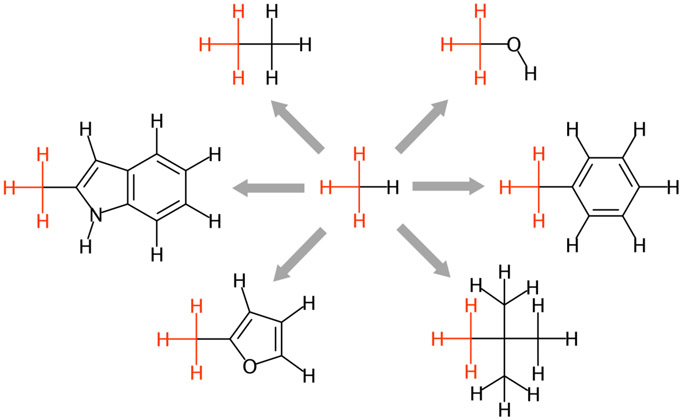
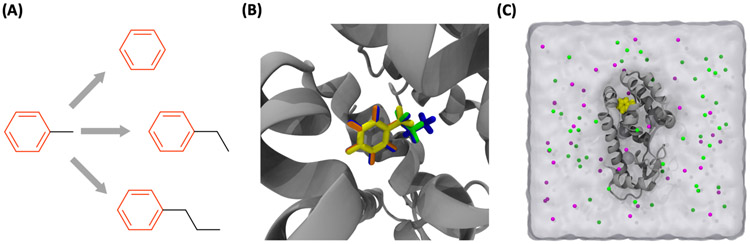
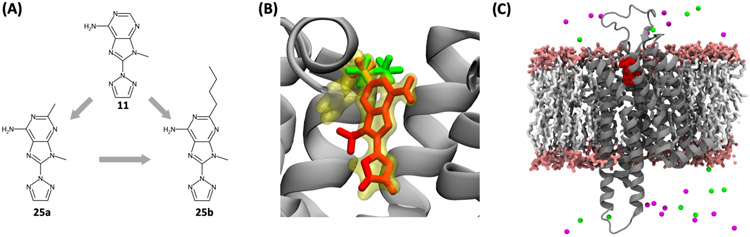
Alchemical free energy simulations have long been utilized to predict free energy changes for binding affinity and solubility of small molecules. However, while the theoretical foundation of these methods is well established, seamlessly handling many of the practical aspects regarding the preparation of the different thermodynamic end states of complex molecular systems and the numerous processing scripts often remains a burden for successful applications. In this work, we present CHARMM-GUI Free Energy Calculator (http://www.charmm-gui.org/input/fec) that provides various alchemical free energy perturbation molecular dynamics (FEP/MD) systems with input and post-processing scripts for NAMD and GENESIS. Four submodules are available: Absolute Ligand Binder (for absolute ligand binding FEP/MD), Relative Ligand Binder (for relative ligand binding FEP/MD), Absolute Ligand Solvator (for absolute ligand solvation FEP/MD), and Relative Ligand Solvator (for relative ligand solvation FEP/MD). Each module is designed to build multiple systems of a set of selected ligands at once for high-throughput FEP/MD simulations. The capability of Free Energy Calculator is illustrated by absolute and relative solvation FEP/MD of a set of ligands and absolute and relative binding FEP/MD of a set of ligands for T4-lysozyme in solution and the adenosine A2A receptor in a membrane. The calculated free energy values are overall consistent with the experimental and published free energy results (within ∼1 kcal/mol). We hope that Free Energy Calculator is useful to carry out high-throughput FEP/MD simulations in the field of biomolecular sciences and drug discovery.


Figures

Figure 1.
Figure 1.
Thermodynamic pathway used for (A) absolute and (B) relative binding free energy, and (C) absolute and (D) relative solvation free energy calculations. The protein is depicted in yellow, the aqueous solvent in blue, the initial ligand in purple, and the end ligand in green. Each Free Energy Calculator module requires two distinct systems for alchemical transformations.
Figure 2.
Figure 2.
Schematic overview of Free Energy Calculator. Users need to prepare a protein-ligand complex structure (from RCSB or docking programs) and additional ligand structures. At the final step, two end-state systems are generated for all selected ligands with all necessary topology and force field files.
Figure 3.
Figure 3.
(A) Multiple ligands can be generated from a core scaffold by drawing functional groups and attachment sites in the sketchpad. (B) Based on the drawing in (A), nine combinatorial structures are generated. (C) MOL2 or SDF files are allowed for “Upload Ligand File” option, and unsupported file format is displayed with red box.
Figure 4.
Figure 4.
(A) Re-ordered similarity matrix by using a hierarchical clustering method; navy and ivory colors represent high and low similarity scores of ligand pairs, respectively. (B) Result of the “Closed minimal perturbation path”, where a filled circle and an arrow represent a ligand and a perturbation path, respectively. Ligands having different charges (14th and 16th ligands) are separated from other ligands, and each cluster is colored in blue, green, and red. (C) Illustrative snapshot of suggested pairs. A pair having ligand(s) unsupported by the CGenFF is marked in red, and these pairs should be removed to go to the system and input generation step.
Figure 5.
Figure 5.
Exemplary maximum common structure mapping results between L0 and L1 for 4 ligand pairs. Red and black represent single-topology (unperturbed) and dual-topology (perturbed) regions, respectively. (A) The mismatched atom and (B) the atoms in different ring size are considered as the dual-topology region. (C) Ring formation is allowed. (D) Matched atoms in the same size of a mismatched ring are considered as the single-topology region.
Figure 6.
Figure 6.
Applied thermodynamic coupling parameters (λ) for LJ and electrostatic interactions of (A) absolute and (B) relative FEP/λ-REMD simulation in NAMD. The λ scaling is controlled using "alchElecLambdaStart” and “alchVdwLambdaEnd” keywords.
Figure 7.
Figure 7.
Seven ligands for testing ALS and RLS modules. For the relative solvation FEP/MD, the gray arrows and the red colors (atoms and bonds) are used for the perturbation paths and the single topology (unperturbed) region, respectively.
Figure 8.
Figure 8.
(A) (A) Four ligands for testing ALB and RLB modules. For the relative binding FEP/MD, the gray arrows and the red colors (atoms and bonds) are used for the perturbation paths and the single topology (unperturbed) region, respectively. (B) Overlaid stick representations of four ligand initial structures (benzene in orange, toluene in yellow, ethylbenzene in green, and propylbenzene in blue) in T4 lysozyme (gray). The aromatic ring of four ligands was well aligned based on the reference ligand (toluene). (C) A representative snapshot of T4-lysozyme-toluene complex in a solution box: gray cartoon for T4-lysozyme, yellow sphere for toluene, magenta and green beads for K+ and Cl ions, respectively.
Figure 9.
Figure 9.
(A) Three congeneric ligands for testing membrane systems; gray arrows represent the path directions for relative binding FEP/MD. (B) Overlaid stick representations of three ligand initial structures (11 in red, 25a in orange, and 25b in green) in A2A GPCR (gray). All ligands are well aligned based on the reference ligand (yellow) in the crystal structure. (C) Representative snapshot of A2A GPCR-11 complex embedded in a POPC bilayer (water is not shown for clarity): gray cartoon for GPCR, red sphere for compound 11, white stick for POPC tail, pink stick for POPC head, magenta and green beads for K+ and Cl ions, respectively.

Similar articles

Cited by

References

    1. Jorgensen WL, The many roles of computation in drug discovery. Science 2004, 303, 1813. - PubMed
    1. Jorgensen W, Efficient drug lead discovery and optimization. Accounts of Chemical Research 2009, 42 (6), 724. - PMC - PubMed
    1. Gilson M; Given J; Bush B; McCammon J, The statistical-thermodynamic basis for computation of binding affinities: a critical review. Biophys J 1997, 72 (3), 1047–1069. - PMC - PubMed
    1. Gilson M; Zhou H, Calculation of protein-ligand binding affinities. Annu Rev Biophys Biomol Struct 2007, 36, 21–42. - PubMed
    1. Mobley D; Dill K, Binding of small-molecule ligands to proteins: "what you see" is not always "what you get". Structure 2009, 17 (4), 489–498. - PMC - PubMed

LinkOut - more resources