. 2020 Oct 28:9:e58868.
doi: 10.7554/eLife.58868.

Functional exploration of heterotrimeric kinesin-II in IFT and ciliary length control in Chlamydomonas

Affiliations

Functional exploration of heterotrimeric kinesin-II in IFT and ciliary length control in Chlamydomonas

Shufen Li et al. Elife. .

Abstract

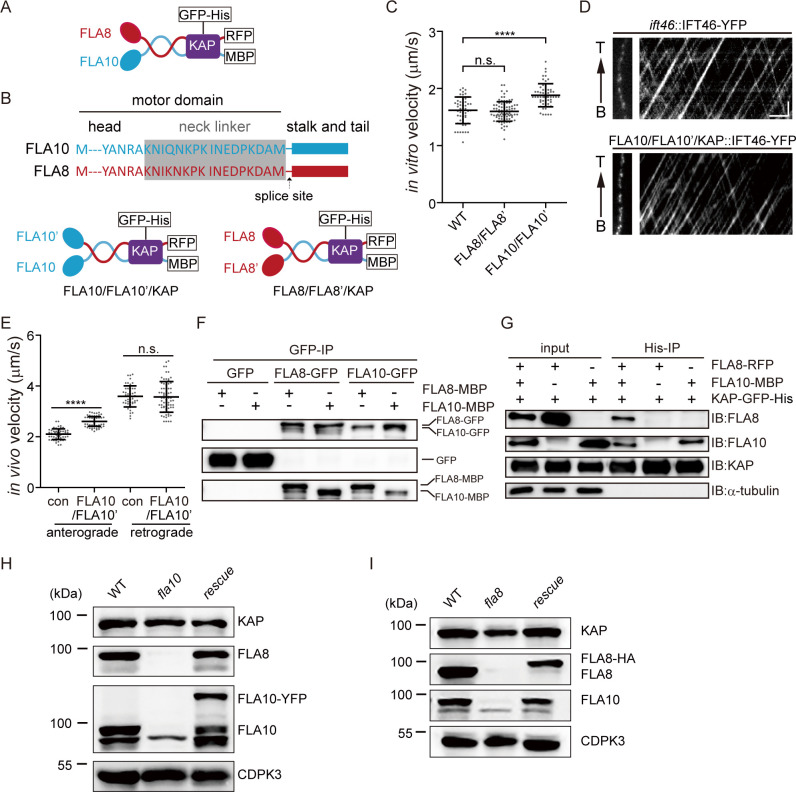
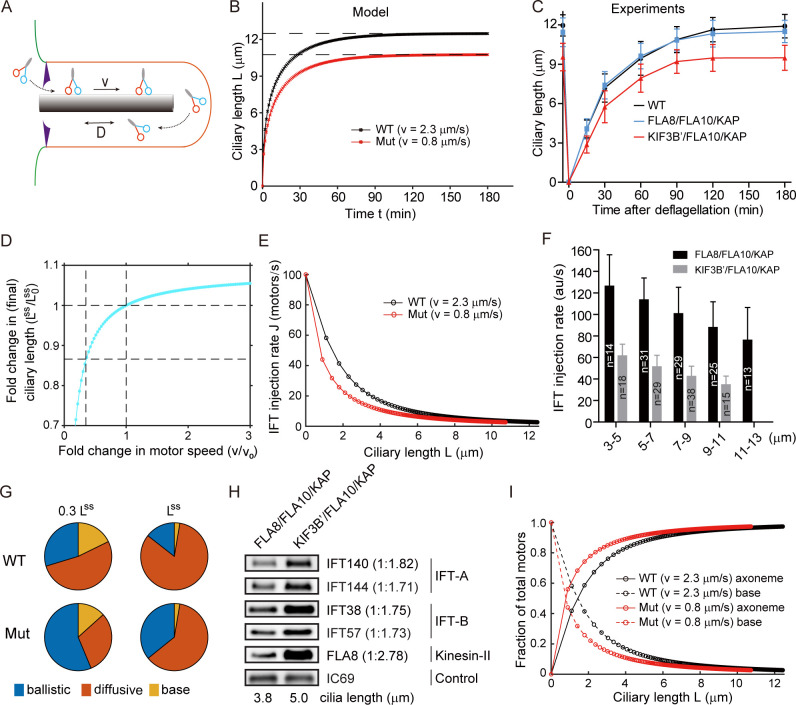
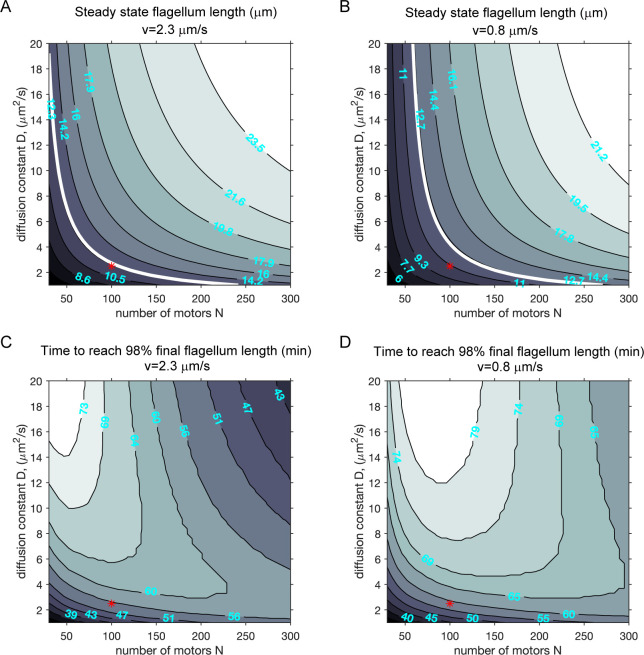
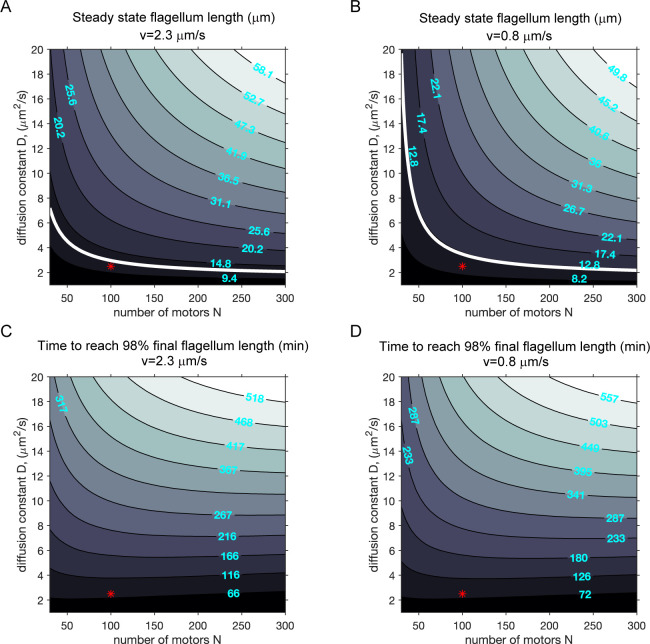
Heterodimeric motor organization of kinesin-II is essential for its function in anterograde IFT in ciliogenesis. However, the underlying mechanism is not well understood. In addition, the anterograde IFT velocity varies significantly in different organisms, but how this velocity affects ciliary length is not clear. We show that in Chlamydomonas motors are only stable as heterodimers in vivo, which is likely the key factor for the requirement of a heterodimer for IFT. Second, chimeric CrKinesin-II with human kinesin-II motor domains functioned in vitro and in vivo, leading to a ~ 2.8 fold reduced anterograde IFT velocity and a similar fold reduction in IFT injection rate that supposedly correlates with ciliary assembly activity. However, the ciliary length was only mildly reduced (~15%). Modeling analysis suggests a nonlinear scaling relationship between IFT velocity and ciliary length that can be accounted for by limitation of the motors and/or its ciliary cargoes, e.g. tubulin.

Keywords: C. elegans; Kinesin-II; cell biology; chlamydomonas reinhardtii; cilia; ciliary length; flagella; intraflagellar transport.


Conflict of interest statement

SL, KW, WC, HT, XL No competing interests declared, JP Reviewing editor, eLife

Figures

Figure 1.
Figure 1.. Requirement of the heterotrimeric organization of CrKinesin-II for IFT (See also Figure 1—figure supplements 1–3).
(A) Schematic diagram of recombinant CrKinesin-II for expression/purification. (B) Overview of chimeric CrKinesin-II constructs with two identical motor domains. The motor domain of FLA10 was replaced with that of FLA8 or vice versa to create chimeric kinesin-IIs with two identical motor domains. Arrow indicates the splice site after the neck linker (gray) for creating the chimeric constructs. (C) In vitro motility assay of chimeric CrKinesin-IIs with two identical motor heads at 23°C. Please note, KAP is present in the chimeric motors. Data shown are mean ± SD. ****p<0.0001; n.s., statistically not significant. (D–E) Analysis of IFT. The velocities of IFT46-YFP expressed in FLA10/FLA10’/KAP cells or in an ift46 rescue strain expressing IFT46-YFP (as a control) were measured using TIRF microscopy. Representative kymographs of IFT (D) and the measurements (E). Data shown are mean ± SD. ****p<0.0001; n.s., statistically not significant. (F) Self-interaction of FLA10 or FLA8. FLA10-GFP and FLA10-MBP or FLA8-GFP and FLA8-MBP were co-expressed respectively in 293 T cells followed by immunoprecipitation with anti-GFP antibody and immunoblotting with GFP and MBP antibodies, respectively. (G) FLA10 interacts with KAP while FLA8 does not. FLA10-MBP or FLA8-RFP was co-expressed respectively with KAP-GFP-His followed by pull-down with a Ni column and immunoblotting with the indicated antibodies. (H–I) The stability of FLA10 and FLA8 in vivo depends on each other. Cells from wild type (WT), fla10, and rescue (fla10::FLA10-YFP) (G) and cells from WT, fla8, rescue (fla8:FLA8-HA) (I) were analyzed by immunoblotting with antibodies against FLA10, FLA8, KAP and CDPK3 (as a loading control). Please note that both FLA8 and FLA10 were not detected in either fla10 or fla8 mutants.
Figure 1—figure supplement 1.
Figure 1—figure supplement 1.. Purification of recombinant CrKinesin-II and chimeric Crkinesin-II with identical motor domains.
(A) Strategy for expression and purification CrKinesin-II. (B) Coomassie-stained SDS-PAGE of purified FLA10/FLA8 from an MBP column (left) and KAP from a Ni column (right). (C) Elution profiles of CrKinesin-II from gel filtration. . (D) Analysis of purified CrKinesin-II by SDS-PAGE and immunoblotting. Elution fractions of CrKinesin-II from gel filtration were separated on a 10% SDS-PAGE followed by coomassie blue staining (top) or by immunoblotting with the indicated antibodies (bottom). An asterisk indicates the fraction used for motility assay. (E–F) FLA8’-MBP/FLA8-RFP/KAP-GFP-His and FLA10’-RFP/FLA10-MBP/KAP-GFP-His were expressed respectively in Sf9 cells followed by purification using MBP and Ni affinity columns. The purified products were analyzed by SDS-PAGE followed by coomassie blue staining (E) or immunoblotting (F).
Figure 1—figure supplement 2.
Figure 1—figure supplement 2.. Cells expressing chimeric CrKinesin-II with identical motor domains of FLA10 form normal cilia.
(A) HA-tagged FLA10’ (motor domain of FLA10 with FLA8 carboxyl tail) was transformed into an aflagellate mutant fla8. The transformants were expected to form a chimeric motor with two identical motor domains of FLA10. The transformants were examined by immunoblotting with wild type (WT) and fla8 cells as control. (B) FLA10’ rescued the aflagellate phenotype of fla8. Shown are the differential interference contrast images of the cells as indicated. Bar, 5 μm. (C) Ciliary regeneration kinetics of FLA10’ transgenic strain with wild type cells as a control. The cells were deflagellated by pH shock to allow ciliogenesis. Ciliary length of the cells was measured before deflagellation or at the indicated times after deflagellation. Data shown are mean ± SD (n = 50).
Figure 1—figure supplement 3.
Figure 1—figure supplement 3.. Self-dimerization of FLA10 and FLA8.
(A–B) Self-dimerization of FLA10 and FLA8 is not affected by the level of protein expression. Cells were transfected with 7.5-fold differences in the amount of plasmid DNA (high and low as indicated) to induce different levels of protein expression and analyzed by immunoprecipitation with GFP antibody and immunoblotting. (A) Expression of FLA10-GFP and FLA10-MBP. (B) Expression of FLA10-GFP and FLA10-MBP. Cells expressing GFP and FLA10-MBP or FLA8-MBP were used as control. Antibodies used for immunoblotting include anti-GFP, anti-MBP and anti-α-tubulin. (C–D) Self-dimerization of FLA10 and FLA8 in the presence of other subunits of kinesin-II. Cells were transfected with FLA10-GFP and FLA10-MBP alone or including FLA8 and KAP (C) or with FLA8-GFP and FLA8-MBP alone or including FLA10 and KAP (D). Anti-GFP was used for immunoprecipitation. Antibodies against GFP, MBP, FLA10, FLA8, KAP, and α-tubulin were used for immunoblotting as indicated.
Figure 2.
Figure 2.. Chimeric CrKinesin-IIs with motor domains of HsKinesin-II function in vitro and in vivo (see also Figure 2—figure supplement 1).
(A) Overview of chimeric CrKinesin-II constructs. The motor domains of FLA10, FLA8 or both in CrKinesin-II were replaced with their counterparts of HsKinesin-II, respectively. (B) In vitro motility assay of CrKinesin-II chimeras at 23°C. The rates are the following: 1.82 ± 0.24 μm/s (n = 48) for CrKinesin-II; 0.50 ± 0.05 μm/s (n = 50) for KIF3A’/FLA8/KAP; 0.51 ± 0.20 μm/s (n = 37) for KIF3B’/FLA10/KAP; 0.32 ± 0.03 μm/s (n = 40) for KIF3A’/KIF3B’/KAP and 0.41 ± 0.18 μm/s (n = 48) for HsKinesin-II. ****p<0.0001; n.s., statistically not significant. (C) Rescue of the aflagellate phenotype of fla8 by FLA8-YFP or KIF3B’-YFP. fla8 was transformed with FLA8-YFP and KIF3B’-YFP respectively. Cells were imaged using differential interference contrast microscopy. Wild type (WT) and fla8 cells were shown as control. Bar, 5 μm. (D) Cells expressing KIF3B’/FLA10/KAP chimera show robust but mild decrease in ciliary length. The ciliary length in steady-state cells as indicated were measured.
Figure 2—figure supplement 1.
Figure 2—figure supplement 1.. Purification of recombinant HsKinesin-II and chimeric CrKinesin-II with motor domains of HsKinesin-II.
(A–C) Expression and purification of recombinant HsKinesin-II. Strategy of expression and purification (A). Purified kinesin-II was subjected to SDS-PAGE analysis followed by coomassie blue staining (B) or immunoblotting with antibodies against KIF3A, KIF3B or KAP3 (C). (D) Purification of chimeric CrKinesin-II with motor domains of HsKinesin-II. The motor domains of recombinant CrKinesin-II as shown in Figure 1A was replaced with one or two motor domains of HsKinesin-II as indicated. The resulting constructs KIF3A’-MBP/FLA8-RFP/KAP-GFP-His, KIF3B’-RFP/FLA10-MBP/KAP-GFP-His and KIF3A’-MBP/KIF3B’-RFP/KAP-GFP-His were expressed respectively in Sf9 cells followed by purification using MBP and Ni affinity columns consecutively. The purified products were analyzed by SDS-PAGE followed by commassie blue staining.
Figure 3.
Figure 3.. Chimeric KIF3B’/FLA10 motor leads to significant reduction in IFT injection rate but slight decrease in ciliary length.
(A) Velocities of FLA8-YFP and KIF3B’-YFP. The anterograde velocities of FLA8-YFP and KIF3B’-YFP that were expressed respectively in fla8 cells were assayed using TIRF microscopy. ****p<0.0001; n.s., statistically not significant. (B) Anterograde velocities of IFT46-YFP in FLA8 and KIF3B’ transgenic cells. IFT46-YFP was transformed into fla8 cells expressing FLA8-HA or KIF3B’-HA followed by analysis using TIRF microscopy. ift46 cells expressing IFT46-YFP were used as a control. (C) KIF3B’/FLA10/KAP chimera leads to ~2.2-fold reduction in IFT injection rate, which was measured by monitoring fluorescence intensity of IFT46-YFP that enters into cilia per time using TIRF microscopy. (D–E) Analysis of the IFT train size. Representative TEM images of cilia showing IFT trains (D) and the average train size were similar among the indicated samples (E). Bar, 100 nm. (F) KIF3B’/FLA10 chimera leads to ~2.1-fold reduction in IFT frequency. IFT46-YFP was expressed in the indicated cells followed by analysis using TIRF microscopy. 69.3 ± 10.34 min−1 (n = 60) for wild type (WT), 72 ± 8.2 min−1 (n = 60) for FLA8-HA/FLA10/KAP and 32.7 ± 6.24 min−1 (n = 60) for KIF3B’-HA/FLA10/KAP cells. (G) Cells expressing chimeric KIF3B’/FLA10/KAP have similar ciliary levels of IFT proteins to the controls. The cilia were isolated from the indicated cells. Equal amounts of ciliary proteins were analyzed by immunoblotting with the indicated antibodies.
Figure 4.
Figure 4.. Mathematical modeling predicts a nonlinear scaling relationship between motor velocity and ciliary length (See also Figure 4—figure supplements 1–3).
(A) A cartoon schematic of kinesin-II mediated IFT in cilia. (B) Simulated kinetics of ciliary assembly during ciliary regeneration. (C) Kinetics of ciliary assembly. Cells were deflagellated by pH shock to allow cilia regeneration. Cells were fixed at the indicated times followed by measurement of ciliary length. Data shown are mean ± SD (n = 50). (D) Modeling: relationship between motor speed and steady-state ciliary length. (E) Modeling: relationship between length and IFT injection rate in a growing cilium. (F) IFT injection rate during ciliary assembly at different length of cilia as indicated. The fluorescence intensity of IFT46-YFP was monitored via TIRF microscopy. The change in IFT injection rate from initial assembly to final length of cilia is statistically significant with p<0.0001. (G) Pie charts: distribution of motors at 0.3 Lss and Lss. (H) Cells expressing slower chimeric motor KIF3B’/FLA10/KAP at shorter growing cilia exhibit higher ciliary levels of IFT proteins relative to the control. Isolated cilia during ciliary regeneration from cells as indicated were subjected to immunoblotting with the indicated antibodies. (I) Modeling: distribution of motors during ciliary assembly at different ciliary lengths.
Figure 4—figure supplement 1.
Figure 4—figure supplement 1.. Modeling (case 1): the effect of diffusion constant and the number of motors on ciliary length and the timescale to reach final ciliary length.
(A–B) Contour plots of the steady-state cilium length when N, the total number of motors, is varied with the rate of diffusion (D) at two different motor speeds, when only motors are limiting (case 1). (A): fast IFT. (B): slow IFT. All other parameters were kept constant. The white contour lines correspond to 12.5 μm (assumed to be the wild-type cilium length). Red markers correspond to parameters used in the simulations presented in the main text. (C–D) Contour plots of the growth time (in minutes) required to attain 98% of the final steady-state flagellum length.
Figure 4—figure supplement 2.
Figure 4—figure supplement 2.. Modeling (case 2): the effect of diffusion constant and the number of motors on ciliary length and the timescale to reach final ciliary length.
(A–B) Contour plots of the steady-state cilium length when N, the total number of motors, is varied with the rate of diffusion (D) at two different motor speeds, when motors and tubulin are both limiting (case 2). (A): fast IFT. (B): slow IFT. All other parameters were kept constant. The white contour lines correspond to 12.5 μm (assumed to be the wild-type cilium length). Red markers correspond to parameters used in the simulations presented in the main text. (C–D) Contour plots of the growth time (in minutes) required to attain 98% of the final steady-state flagellum length.
Figure 4—figure supplement 3.
Figure 4—figure supplement 3.. Modeling (case 3): the effect of diffusion constant and the number of motors on ciliary length and the timescale to reach final ciliary length.
(A–B) Contour plots of the steady-state cilium length when N, the total number of motors, is varied with the rate of diffusion (D) at two different motor speeds, when only motors are limiting and the disassembly rate is length-dependent (case 3). (A): fast IFT. (B): slow IFT. All other parameters were kept constant. The white contour lines correspond to 12.5 μm (assumed to be the wild-type cilium length). Red markers correspond to parameters used in the simulations presented in the main text. (C–D) Contour plots of the growth time (in minutes) required to attain 98% of the final steady-state flagellum length.
Author response image 1.

Similar articles

Cited by

References

    1. Anvarian Z, Mykytyn K, Mukhopadhyay S, Pedersen LB, Christensen ST. Cellular signalling by primary cilia in development, organ function and disease. Nature Reviews Nephrology. 2019;15:199–219. doi: 10.1038/s41581-019-0116-9. - DOI - PMC - PubMed
    1. Bangs F, Anderson KV. Primary cilia and mammalian hedgehog signaling. Cold Spring Harbor Perspectives in Biology. 2017;9:a028175. doi: 10.1101/cshperspect.a028175. - DOI - PMC - PubMed
    1. Bertiaux E, Mallet A, Fort C, Blisnick T, Bonnefoy S, Jung J, Lemos M, Marco S, Vaughan S, Trépout S, Tinevez JY, Bastin P. Bidirectional intraflagellar transport is restricted to two sets of microtubule doublets in the trypanosome flagellum. Journal of Cell Biology. 2018a;217:4284–4297. doi: 10.1083/jcb.201805030. - DOI - PMC - PubMed
    1. Bertiaux E, Morga B, Blisnick T, Rotureau B, Bastin P. A Grow-and-Lock model for the control of flagellum length in trypanosomes. Current Biology. 2018b;28:3802–3814. doi: 10.1016/j.cub.2018.10.031. - DOI - PubMed
    1. Bressloff PC. Stochastic model of intraflagellar transport. Physical Review E. 2006;73:061916. doi: 10.1103/PhysRevE.73.061916. - DOI - PubMed

Publication types

MeSH terms