. 2020 Oct 28:9:e59026.
doi: 10.7554/eLife.59026.

Probing the ionotropic activity of glutamate GluD2 receptor in HEK cells with genetically-engineered photopharmacology

Affiliations

Probing the ionotropic activity of glutamate GluD2 receptor in HEK cells with genetically-engineered photopharmacology

Damien Lemoine et al. Elife. .

Abstract

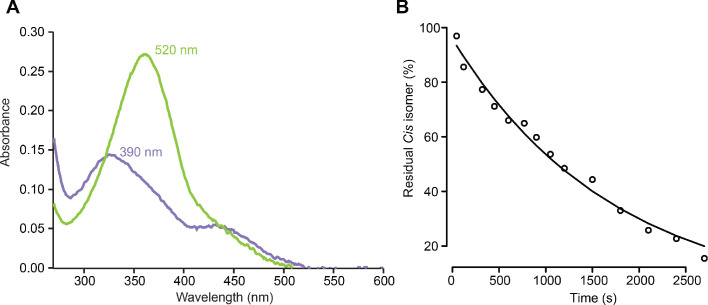
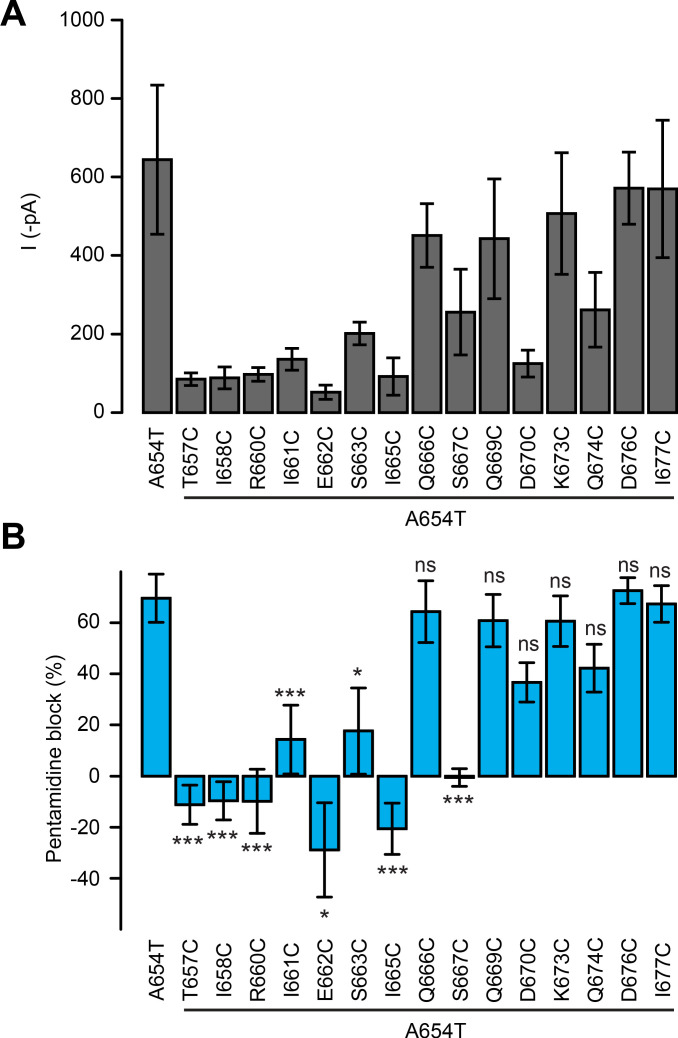
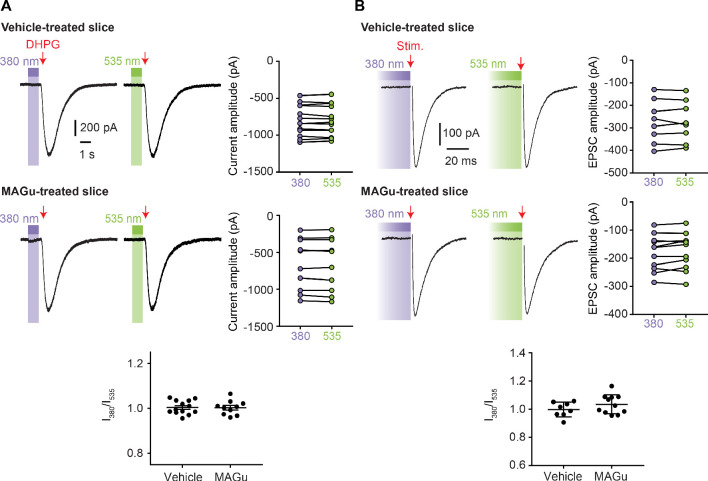
Glutamate delta (GluD) receptors belong to the ionotropic glutamate receptor family, yet they don't bind glutamate and are considered orphan. Progress in defining the ion channel function of GluDs in neurons has been hindered by a lack of pharmacological tools. Here, we used a chemo-genetic approach to engineer specific and photo-reversible pharmacology in GluD2 receptor. We incorporated a cysteine mutation in the cavity located above the putative ion channel pore, for site-specific conjugation with a photoswitchable pore blocker. In the constitutively open GluD2 Lurcher mutant, current could be rapidly and reversibly decreased with light. We then transposed the cysteine mutation to the native receptor, to demonstrate with high pharmacological specificity that metabotropic glutamate receptor signaling triggers opening of GluD2. Our results assess the functional relevance of GluD2 ion channel and introduce an optogenetic tool that will provide a novel and powerful means for probing GluD2 ionotropic contribution to neuronal physiology.

Keywords: azobenzene; biochemistry; chemical biology; glutamate receptors; ion channels; mouse; neuroscience; optogenetics; photopharmacology; tethered ligands.

Plain language summary

Neurotransmitters are chemicals released by the body that trigger activity in neurons. Receptors on the surface of neurons detect these neurotransmitters, providing a link between the inside and the outside of the cell. Glutamate is one of the major neurotransmitters and is involved in virtually all brain functions. Glutamate binds to two different types of receptors in neurons. Ionotropic receptors have pores known as ion channels, which open when glutamate binds. This is a fast-acting response that allows sodium ions to flow into the neuron, triggering an electrical signal. Metabotropic receptors, on the other hand, trigger a series of events inside the cell that lead to a response. Metabotropic receptors take more time than ionotropic receptors to elicit a response in the cell, but their effects last much longer. One type of receptor, known as the GluD family, is very similar to ionotropic glutamate receptors but does not directly respond to glutamate. Instead, the ion channel of GluD receptors opens after being activated by glutamate metabotropic receptors. GluD receptors are produced throughout the brain and play roles in synapse formation and activity, but the way they work remains unclear. An obstacle to understanding how GluD receptors work is the lack of molecules that can specifically block these receptors’ ion channel activity. Lemoine et al. have developed a tool that enables control of the ion channel in GluD receptors using light. Human cells grown in the lab were genetically modified to produce a version of GluD2 (a member of the GluD family) with a light-sensitive molecule attached. In darkness or under green light, the light-sensitive molecule blocks the channel and prevents ions from passing through. Under violet light, the molecule twists, and ions can flow through the channel. With this control over the GluD2 ion channel activity, Lemoine et al. were able to validate previous research showing that the activation of metabotropic glutamate receptors can trigger GluD2 to open. The next step will be to test this approach in neurons. This will help researchers to understand what role GluD ion channels play in neuron to neuron communication.


Conflict of interest statement

DL, SM, JT, BL, PF, AT, LT, AM No competing interests declared

Figures

Figure 1.
Figure 1.. Optogenetic pharmacology strategy to probe the ionotropic activity of GluD receptors.
(A) GluD2 is genetically-modified to incorporate a cysteine residue (yellow) at the entrance to the pore, which serves as a handle for the covalent attachment of a synthetic, photoswitchable tethered ligand (PTL). Under green light (500 nm), the PTL adopts an elongated state and places its cationic head group in the lumen, resulting in ion channel blockade. Under violet light (380 nm), the PTL switches to a twisted, shorter form and unblocks the channel. The position of the Lurcher (Lc) mutation, which produces a permanently open channel, is depicted in red. (B) Chemical structure of pentamidine, a non-selective iGluR blocker with two amidinium head groups. (C) Chemical structures of the PTL MAGu in its trans (top) and cis (bottom) configurations. MAGu is composed of a cysteine-reactive maleimide group, a central azobenzene chromophore, and a guanidinium cationic head group. (D) Molecular model of GluD2, based on the structure of activated GluA2 (5weo). Residues mutated to cysteine are depicted in yellow, while the Lc mutant is shown in red. (E) Top, schematic representation of one GluD subunit, with its ligand-binding domain (LDB) and its four membrane segments (M1-4, M2 being a non-membrane spanning pore loop). Bottom, sequence alignment between the mouse GluA2 and GluD2 receptors around the engineered mutations. M3 is shown in gray, the 15 residues mutated to cysteine in yellow, and the position of the A654T Lc mutation in red.
Figure 1—figure supplement 1.
Figure 1—figure supplement 1.. Photochemical properties of MAGu.
(A) UV-visible spectra of MAGu under 520 nm light (green, mostly trans) or under 390 nm light (pink, mostly cis). (B) Thermal relaxation of cis MAGu in aqueous solution in darkness. Absorbance at 362 nm is plotted as a function of time in darkness following illumination with 390 nm light. Data points were fitted with the following monoexponential decay equation: y = A exp(-x/k) and yielded: A = 95.8 ± 1.9 and k = 5.8e-04 ± 0.2e-04 s−1. The half-life of cis MAGu was ln(2)/k = 1195 s.
Figure 2.
Figure 2.. Screening of the fifteen single-cysteine mutants engineered on the Lc background.
(A) Left, representative current-voltage relationship for GluD2-A654T Lc, with (blue) and without (black) pentamidine (100 μM). The subtracted current (gray) shows clear inward rectification and block at positive voltages. Right, currents recorded at −60 mV were larger for GluD2-A654T than for WT (n = 6 cells, p=0.0033, two-sample t-test), and were strongly reduced with 100 μM pentamidine for A654T (n = 6 cells, p=0.0045, paired t-test) but not for the WT GluD2 (n = 6 cells, p=0.34, paired t-test). (B) Left, ratio of the currents recorded at −60 mV under 380 and 535 nm light, for A654T and the fifteen cysteine mutants engineered on the A654T background (n = 3–8 cells, one-sample t-test, or Wilcoxon when normality is not verified, compared with a theoretical mean value of 1). Right, representative change in holding current when switching between dark, 380 and 535 nm light, for A654T and for five mutants that show modulation of the holding current when switching between 380 and 535 nm light (p<0.05 except for Q669C where p=0.09). (C) Left, representative current traces (Vm = −60 mV) recorded for A654T and A654T-I677C in darkness, then under 380 nm light (violet), upon application of pentamidine (blue, 100 μM), and then under 535 nm after pentamidine washout (green). Right, percent photoswitching (PS = Blockphoto/Blockpenta) for A654T and the cysteine mutants that show both clear leak current and pentamidine block. Photoswitching reached 15.5 ± 3.1% for Q666C (p=0.016, n = 4),–1.9 ± 0.4% for Q669C (p=0.008, n = 6), 14.6 ± 1.7% for D670C (p=0.003, n = 4), 20.5 ± 4.2% for Q674C (p=0.008, n = 5) and 46.3 ± 4.3% for I677C (p=1.34E-05, n = 8, one-sample t-test, or Wilcoxon when normality is not verified, compared with a theoretical mean value of 0). Photoswitching was absent in the control A654T mutant (0.37 ± 0.9%, p=0.72, n = 5) and in the other two cysteine mutants K673C (−0.9 ± 1.06%, p=0.43) and D676C (0.39 ± 0.57%, p=0.53). (D) Model of GluD2 showing the location of A654 (red), Q666, D670, Q674 and I677C (violet), Q669 (green), and all the non-photocontrollable cysteine mutants (yellow). Data are presented as mean value ± sem. Source files of individual data points used for the quantitative analysis are available in the Figure 2—source data 1.
Figure 2—figure supplement 1.
Figure 2—figure supplement 1.. Functional characterization of the cysteine mutants.
(A) Currents recorded at −60 mV for A654T and each of the fifteen cysteine mutants (n = 3–8 cells). (B) Pentamidine block for A654T and each of the fifteen cysteine mutants (n = 3–8 cells). Data are presented as mean value ± sem.
Figure 3.
Figure 3.. Photoregulation of GluD2-A654T-I677C labeled with MAGu.
(A) Representative current traces (Vm = −60 mV) recorded for A654T-I677C in darkness, then under 380 light (violet), upon application of pentamidine or NMDG (blue, 100 μM), and then under 535 nm (green). Membrane potential is switched from −60 to −68 mV during NMDG application to correct for the change in junction potential, and percent BlockNMDG is calculated for Vm = −68 mV. Right, percent block for pentamidine (blue, 74.4 ± 6.5%) and for transMAGu (green, 535 nm, 33.0 ± 2.4%) compared to NMDG block (n = 8 cells). (B) Representative recording showing the reversibility of block/unblock over multiple cycles of 380/535 nm light. (C) Left, representative recording showing the extent of current unblock when varying the illumination time under violet light. Right, quantification of current unblock as a function of illumination time (n = 8 cells). Inset, averaged time-course of current unblock when switching from dark to 380 nm light (mean value in black,± SEM in purple, n = 7 cells) and corresponding mono-exponential fit (red, k = 0.0296 ± 0.0002 ms−1; t1/2 = 23.4 ms). (D) Left, representative current trace showing the thermal stability of cis MAGu in darkness after a brief flash of 380 nm light. Right, 86.2 ± 2.5% of the residual current remains after 1 min in darkness (n = 9 cells). Data are presented as mean value ± sem. Source files of individual data points used for the quantitative analysis are available in the Figure 3—source data 1.
Figure 4.
Figure 4.. Pharmacological action of MAGu at GluD2-A654T-I677C.
(A) Average current-versus-voltage relationship under 380 and 535 nm light (n = 21). S.E.M is shown is shade, and subtracted current in gray. (B) Left, representative dose-dependent blockade of the current upon pentamidine (0.1–100 μM) application, under 380 and 535 nm light. Right, quantification of pentamidine blockade under both wavelengths of light. IC50380 = 5.1 ± 0.3 μM, IC50535 = 4.8 ± 0.5 μM (n = 6 cells). (C) Molecular modeling showing trans MAGu tethered to I677C. (D) Molecular modeling showing the ion channel computed in the absence (top) and presence (bottom) of trans MAGu. The channel is represented with a color coding of the diameter in order to facilitate observation of the change induced by trans MAGu (from green, large, to red, small). One subunit is omitted for clarity. Data are presented as mean value ± sem. Source files of individual data points used for the quantitative analysis are available in the Figure 4—source data 1.
Figure 5.
Figure 5.. Photocontrol of GluD2-I677C (LiGluD2).
(A) Representative DHPG-induced current (measured as indicated by the red arrow) for a MAGu-treated (20 µM, 20 min) cell co-expressing mGlu1b and GluD2-I677C, under 380, 535 and 380 nm light. Note the drop in holding current at the onset of the 380 nm illumination, and the return to the baseline under 535 nm light. (B) Representative DHPG-induced current for a MAGu-treated cell co-expressing mGlu1b and WT GluD2, under 380, 535 and 380 nm light. (C) DHPG-induced currents were reduced under 535 compared to 380 nm light for I677C (22.8 ± 4.6%, n = 8 cells) but not for WT GluD2 (3.3 ± 6.4%, n = 6 cells, p=0.02, two-sample t-test). (D) Ratio of the holding current recorded under 380 nm light and in darkness is different from one for I677C (1.09 ± 0.004%, p=2.44 e-7, n = 8 cells) but not for WT GluD2 (1.01 ± 0.006%, p=0.10, n = 8 cells, one-sample t-test). Source files of individual data points used for the quantitative analysis are available in the Figure 5—source data 1.
Figure 5—figure supplement 1.
Figure 5—figure supplement 1.. MAGu does not photosensitize native GluD and GluA currents in Purkinje cells.
(A) Top, DHPG (200 μM)-induced current in vehicle-treated cerebellar slices were of similar amplitude under 380 and 535 nm light (−800 ± 57 pA vs. −799 ± 57 pA, p>0.999, n = 10). Middle, DHPG (200 μM)-induced current in MAGu-treated cerebellar slices were of similar amplitude under 380 and 535 nm light (−666 ± 113 pA vs. −661 ± 111 pA, p=0.625, n = 13). Bottom, ratio between the current measured under 380 and 535 nm light are not different from one for both vehicle-treated (1.004 ± 0.008, p=0.6475) and MAGu-treated cells (1.003 ± 0.01, p=0.7755). (B) Top, Excitatory post-synaptic currents (EPSCs) in vehicle-treated cerebellar slices were of similar amplitude under 380 and 535 nm light (−272 ± 32 pA vs −273 ± 34 pA, p=0.742, n = 8). Middle, EPSCs in MAGu-treated cerebellar slices were of similar amplitude under 380 and 535 nm light (−176 ± 20 pA vs. −180 ± 19 pA, p=0.320, n = 11). Bottom, ratio between the current measured under 380 and 535 nm light are not different from one for both vehicle-treated (0.9976 ± 0.0185, p>0.999) and MAGu-treated cells (1.035 ± 0.020, p=0.1748). Data are presented as mean value ± sem.

Similar articles

Cited by

References

    1. Ady V, Perroy J, Tricoire L, Piochon C, Dadak S, Chen X, Dusart I, Fagni L, Lambolez B, Levenes C. Type 1 metabotropic glutamate receptors (mGlu1) trigger the gating of GluD2 Delta glutamate receptors. EMBO Reports. 2014;15:103–109. doi: 10.1002/embr.201337371. - DOI - PMC - PubMed
    1. Araki K, Meguro H, Kushiya E, Takayama C, Inoue Y, Mishina M. Selective expression of the glutamate receptor channel Delta 2 subunit in cerebellar purkinje cells. Biochemical and Biophysical Research Communications. 1993;197:1267–1276. doi: 10.1006/bbrc.1993.2614. - DOI - PubMed
    1. Beharry AA, Woolley GA. Azobenzene photoswitches for biomolecules. Chemical Society Reviews. 2011;40:4422. doi: 10.1039/c1cs15023e. - DOI - PubMed
    1. Benamer N, Marti F, Lujan R, Hepp R, Aubier TG, Dupin AAM, Frébourg G, Pons S, Maskos U, Faure P, Hay YA, Lambolez B, Tricoire L. GluD1, linked to schizophrenia, controls the burst firing of dopamine neurons. Molecular Psychiatry. 2018;23:691–700. doi: 10.1038/mp.2017.137. - DOI - PMC - PubMed
    1. Berlin S, Szobota S, Reiner A, Carroll EC, Kienzler MA, Guyon A, Xiao T, Trauner D, Isacoff EY. A family of photoswitchable NMDA receptors. eLife. 2016;5:e12040. doi: 10.7554/eLife.12040. - DOI - PMC - PubMed

Publication types