. 2021 Feb 1;218(2):e20201137.
doi: 10.1084/jem.20201137.

Sustained androgen receptor signaling is a determinant of melanoma cell growth potential and tumorigenesis

Affiliations

Sustained androgen receptor signaling is a determinant of melanoma cell growth potential and tumorigenesis

Min Ma et al. J Exp Med. .

Abstract

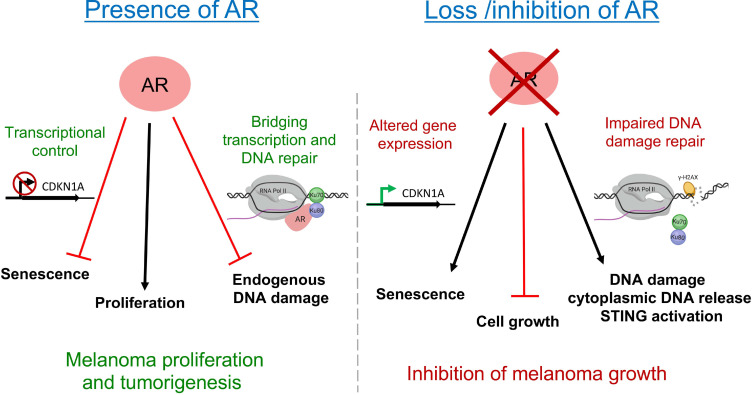
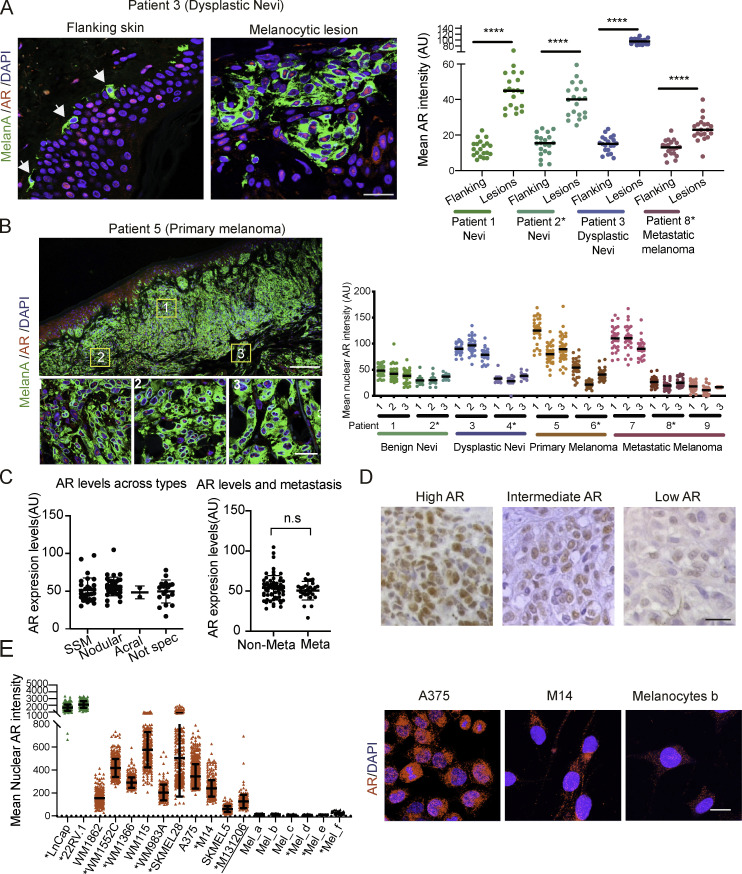
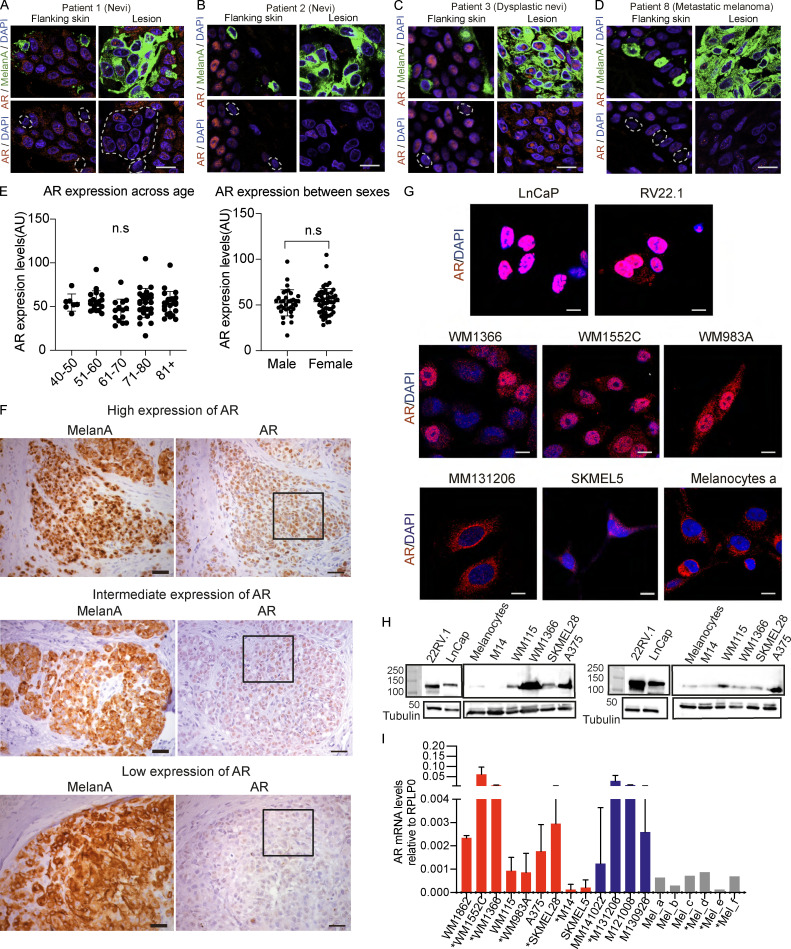
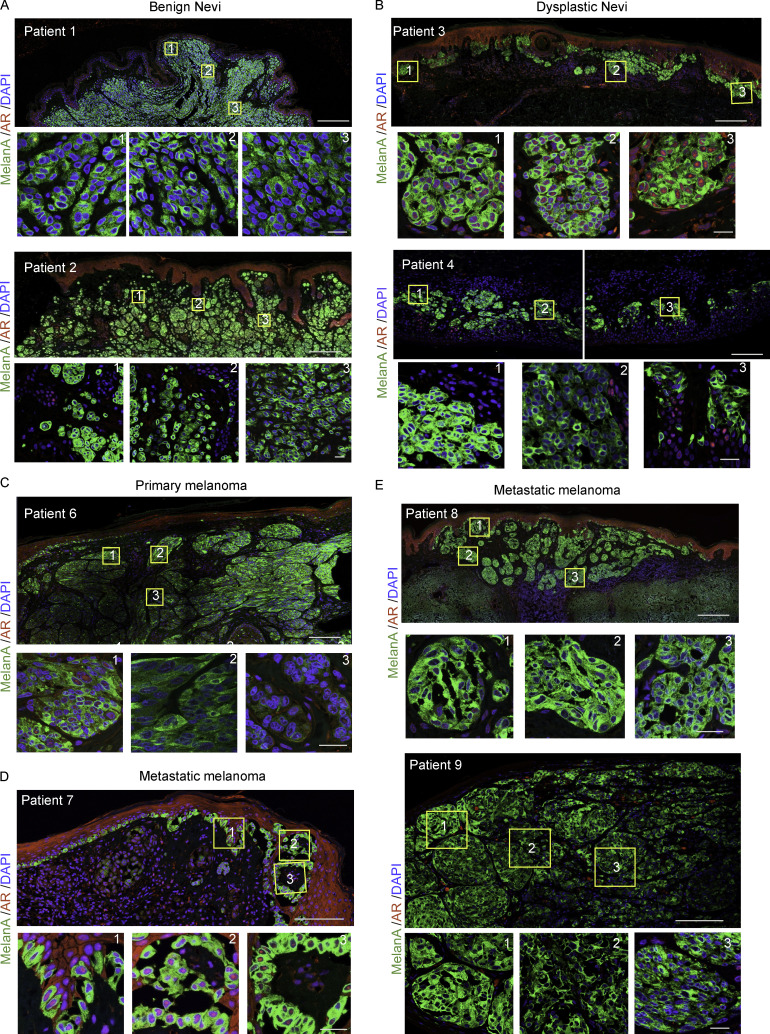
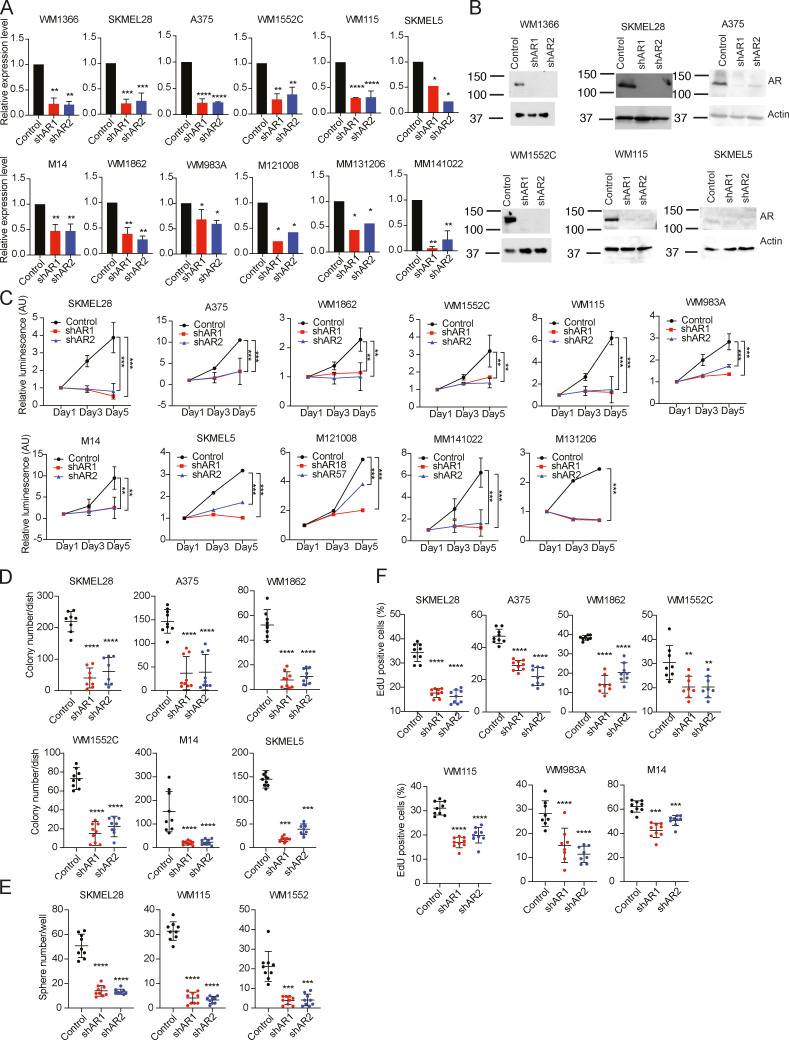
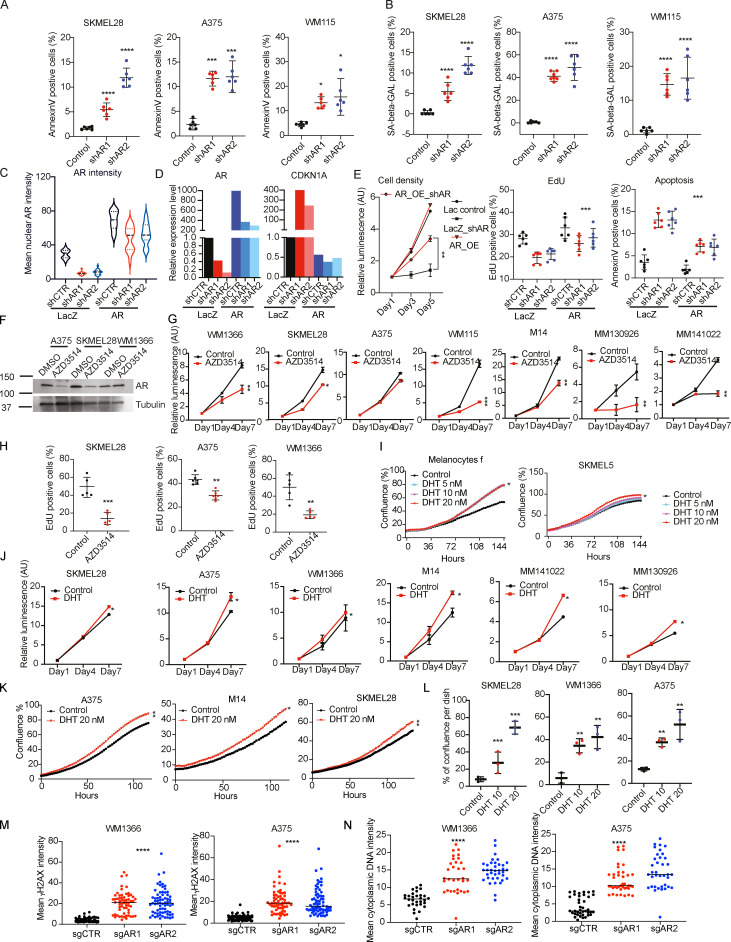
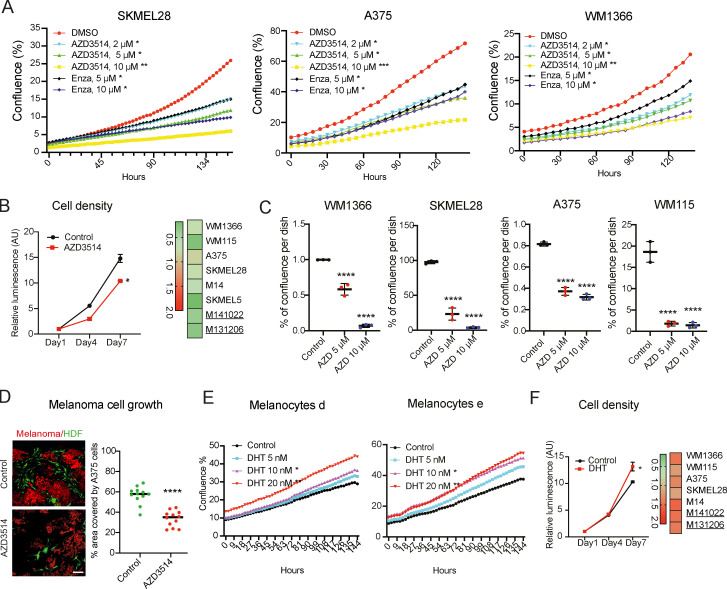
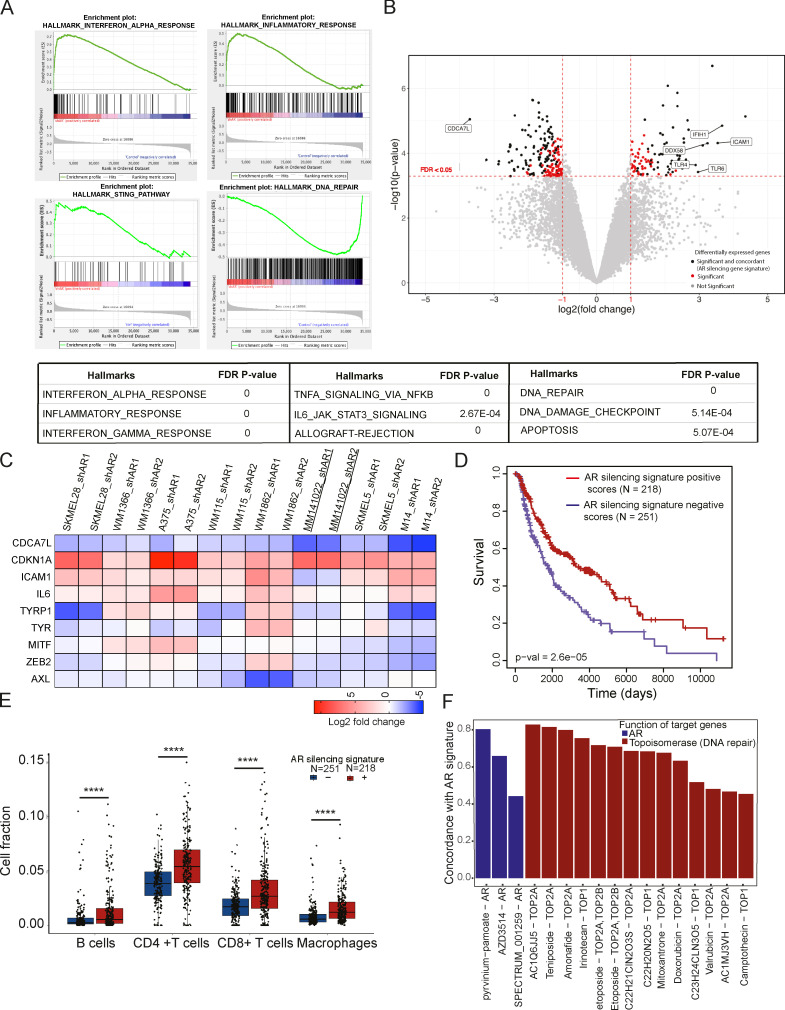
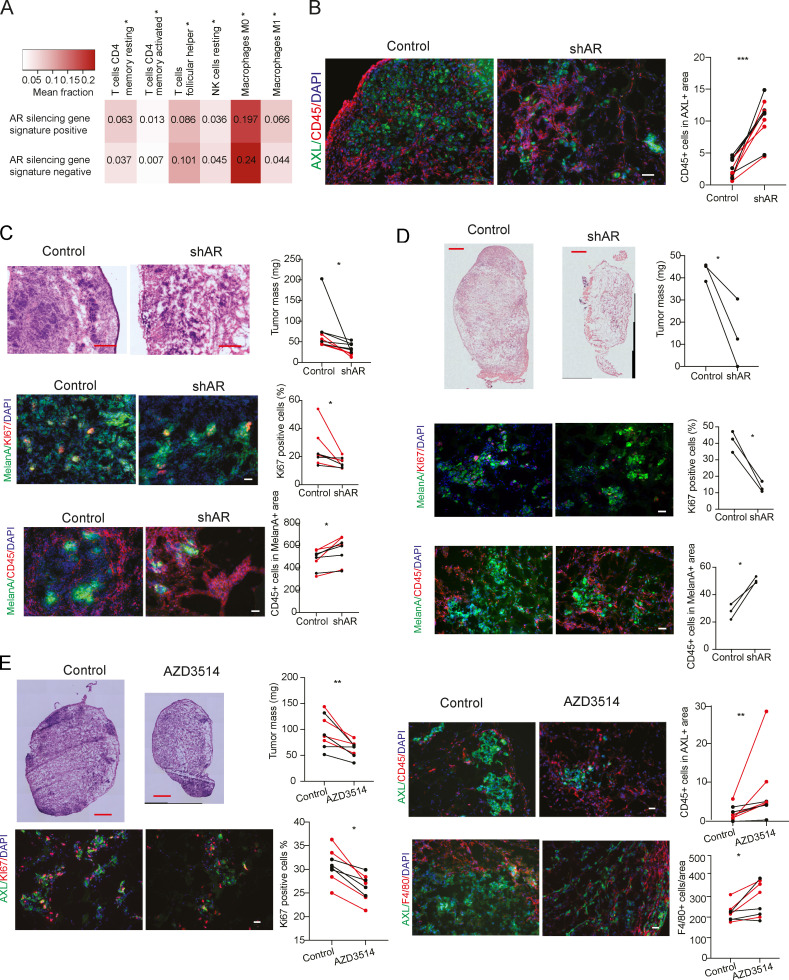
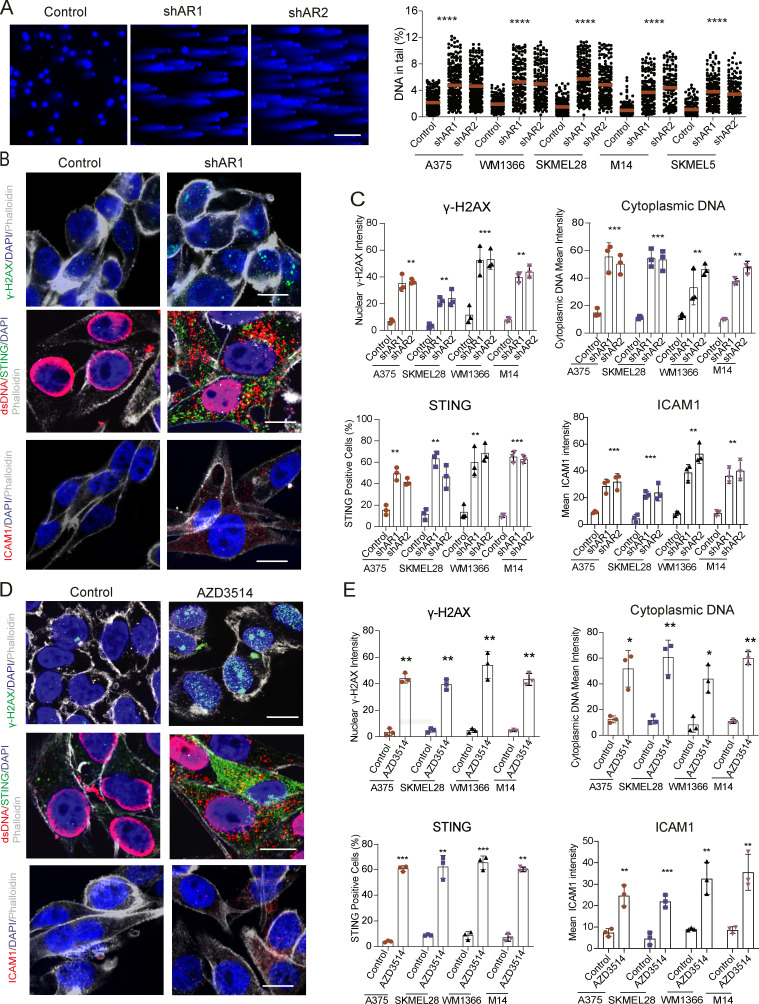
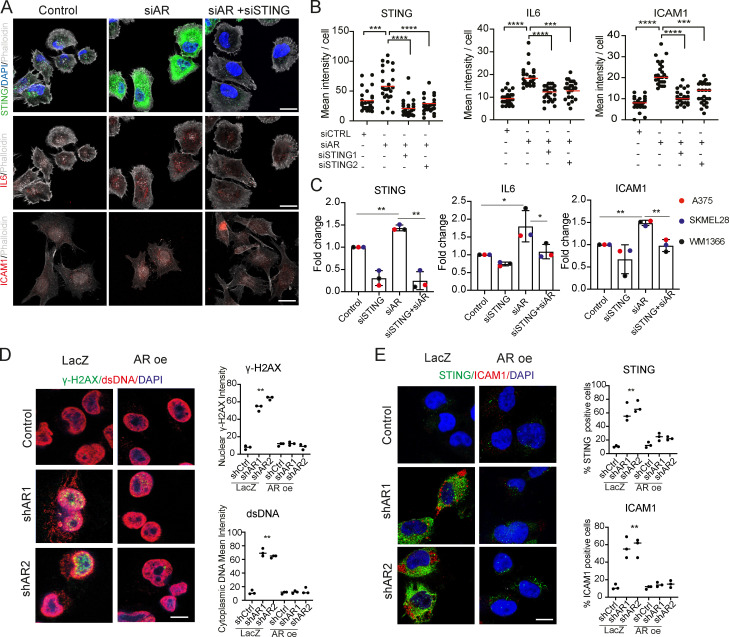
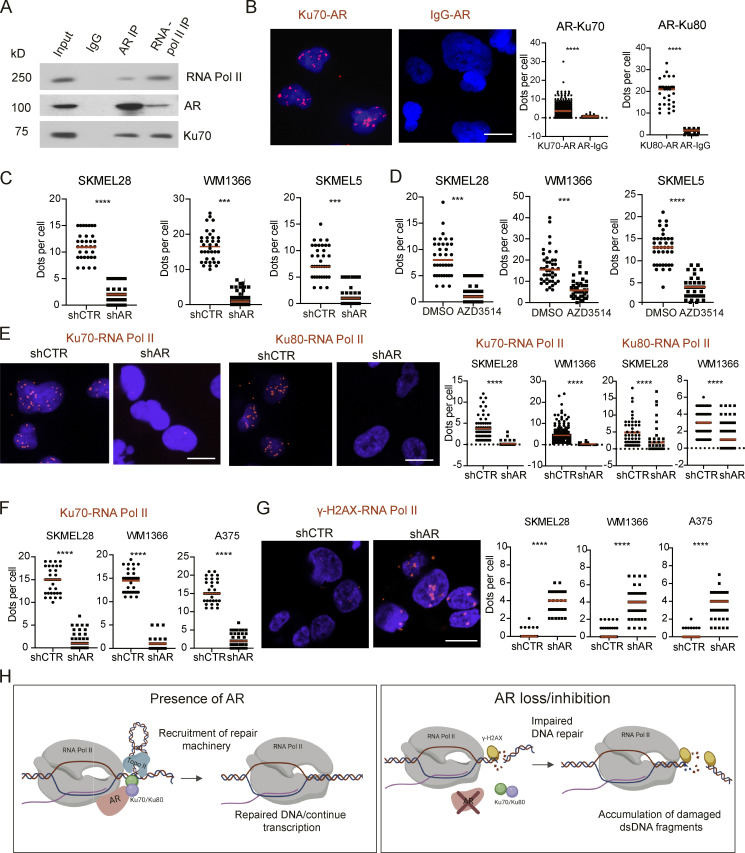
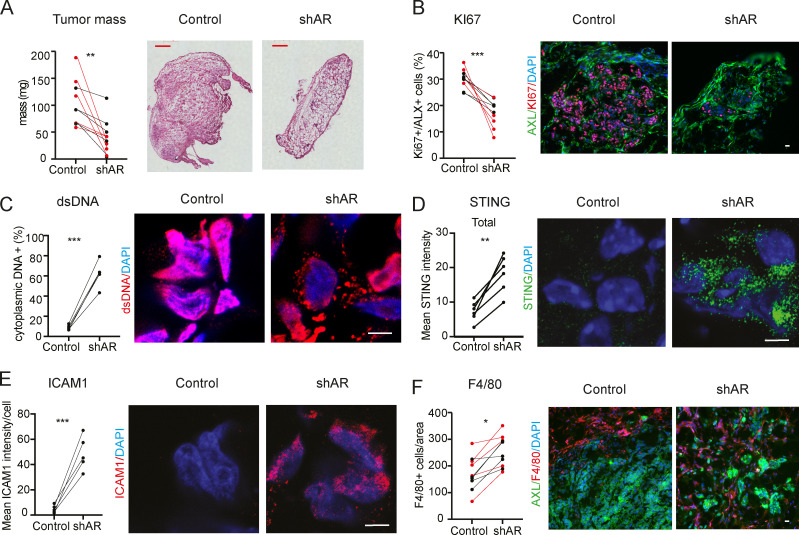
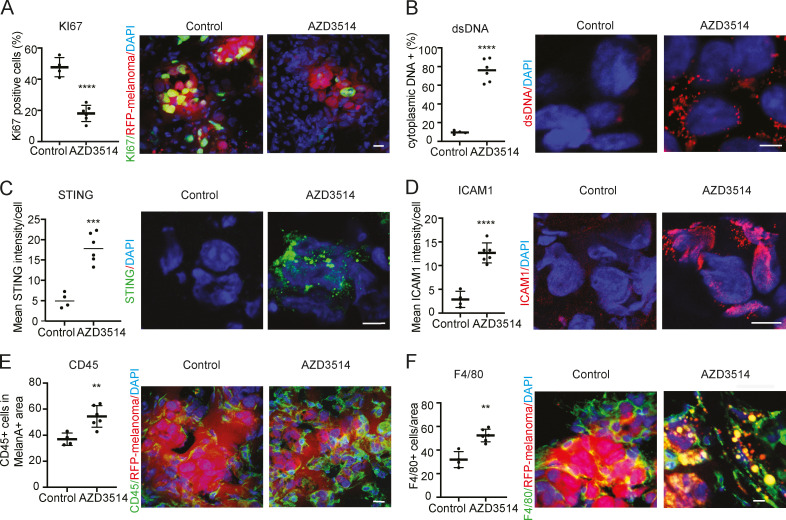
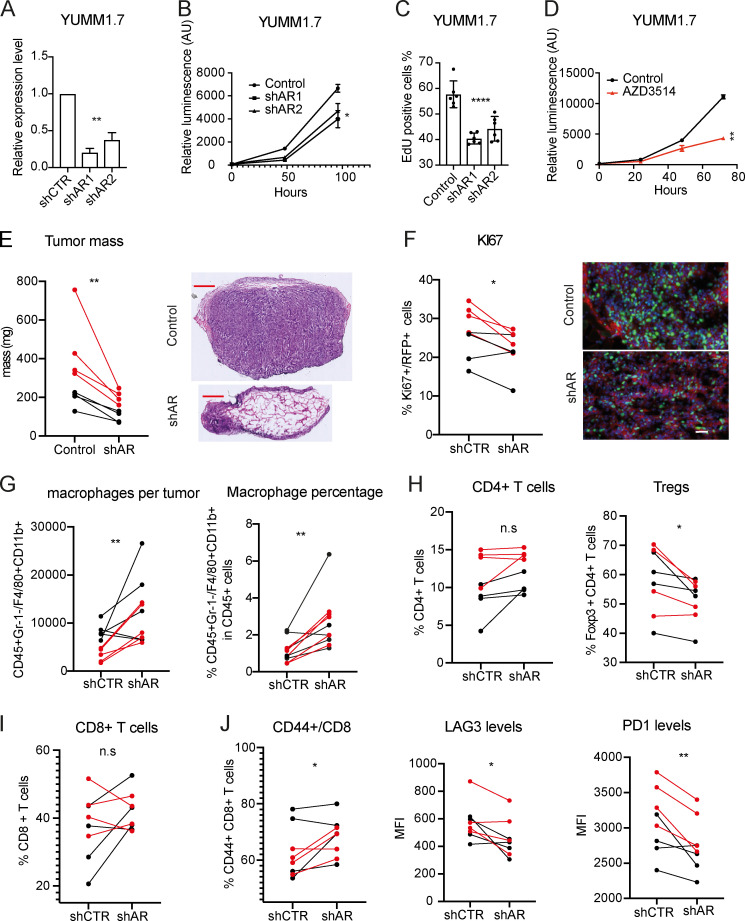
Melanoma susceptibility differs significantly in male versus female populations. Low levels of androgen receptor (AR) in melanocytes of the two sexes are accompanied by heterogeneous expression at various stages of the disease. Irrespective of expression levels, genetic and pharmacological suppression of AR activity in melanoma cells blunts proliferation and induces senescence, while increased AR expression or activation exert opposite effects. AR down-modulation elicits a shared gene expression signature associated with better patient survival, related to interferon and cytokine signaling and DNA damage/repair. AR loss leads to dsDNA breakage, cytoplasmic leakage, and STING activation, with AR anchoring the DNA repair proteins Ku70/Ku80 to RNA Pol II and preventing RNA Pol II-associated DNA damage. AR down-modulation or pharmacological inhibition suppresses melanomagenesis, with increased intratumoral infiltration of macrophages and, in an immune-competent mouse model, cytotoxic T cells. AR provides an attractive target for improved management of melanoma independent of patient sex.


Conflict of interest statement

Disclosures: R. Dummer had intermittent, project-focused consulting and/or advisory relationships with Novartis, Merck Sharp & Dhome (MSD), Bristol-Myers Squibb (BMS), Roche, Amgen, Takeda, Pierre Fabre, Sun Pharma, Sanofi, Catalym, Second Genome, Regeneron, and Alligator outside the submitted work. No other disclosures were reported.

Figures

None
Graphical abstract
Figure 1.
Figure 1.
AR expression in melanoma cells. (A) Representative images and quantification of AR expression in cells of melanocytic lesions versus melanocytes of flanking normal skin (stars) by double IF with antibodies against AR (red) and MelanA (green) for melanocyte identification. DAPI was used for nuclear localization (blue). Shown are AR fluorescence signal intensity in arbitrary units (AU) per individual cells together with mean and statistical significance. MelanA-positive cells, n ≥ 25, unpaired t test, ****, P < 0.001. Samples from male patients in this and following panels are indicated by asterisks. (B) Left: Double IF staining of a primary melanoma lesion and topographically distinct areas (boxes 1, 2, and 3) analyzed for single-cell AR expression. Scale bars: 500 and 50 µm, respectively. IF images of cells in this and other lesions are shown in Fig. S2. Right: Quantification of nuclear AR fluorescence signal in individual MelanA-positive cells (dots) from three topographically delimited areas per melanocytic lesion of different patients. Fluorescence intensity AU values per individual cells are indicated together with the mean. MelanA-positive cells, n ≥ 50, unpaired t test, ****, P < 0.001. (C) Quantification of AR fluorescence signal in MelanA-positive cells in a tissue microarray of different melanoma lesions (left) and metastatic and nonmetastatic forms (right). SSM, superficial spreading melanoma; acral, acral lentiginous melanoma. Quantification was based on digitally acquired images of three independent fields per lesion (≥50 cells per field), with averaged values per individual lesion shown together with mean. Quantification of samples divided by sex and age of patients is provided in Fig. S1 E. Patient sample details provided in Table S1. n.s, not significant. (D) Immunohistochemical staining with anti-AR antibodies of melanomas with high versus intermediate and low AR expression as assessed by double IF analysis in A. Scale bar: 30 µm. Lower-magnification images with MelanA staining of parallel sections are shown in Fig. S1 F. (E) Quantification and representative images of nuclear AR expression by IF analysis of the indicated melanoma cell lines or primary melanoma cells versus primary melanocytes (Mel a-f), and prostate cancer cell lines (LnCAp, 22RV.1) examining >100 cells per sample. Shown are individual cells values (dots) together with mean ± SD. Scale bar: 10 µm. Additional images of cells are shown in Fig. S1 G.
Figure S1.
Figure S1.
AR expression analysis of patient-derived melanocytic lesions and melanoma cells. (A–D) Double IF images of benign nevi (A and B), dysplastic nevi (C), and metastatic melanoma (D) in parallel with flanking skin stained with anti-MelanA (green) and anti-AR (ab74272; red) antibodies. Highlighted in the lower panels are representative MelanA-positive cells and areas used for quantification in Fig. 1 A. Scale bar: 10 µm. (E) Quantification of AR fluorescence signal in MelanA-positive cells in a tissue microarray of melanoma patients divided by age or sex. Quantification was based on digitally acquired images of three independent fields per clinical lesion (minimum of 50 cells per field) on the arrays. Results are expressed as average values for each lesion (dots) together with mean across years of age (left) or sex (right) of patients. n.s, not significant. (F) Immunohistochemical staining with anti-MelanA and anti-AR (ab74272) antibodies of parallel sections of different melanomas with high, intermediate, and low levels of AR expression as quantified by double IF analysis in Fig. 1 B. Shown are representative images, with only the enlarged boxed areas shown in Fig. 1 D. Scale bar: 50 µm. (G) Representative IF images of the indicated prostate cancer cells lines (LnCaP and 22RV.1), melanoma cell lines and primary melanoma cells with high (WM1366, WM1552C, and WM983A) and low (MM131206 and SKMEL5) AR expression, and primary human melanocytes (strain a) stained with anti-AR (red) antibody (D6F11) and DAPI (blue) nuclear staining. Scale bar: 10 µm. (H) Immunoblot analysis of AR expression in melanoma cell lines (A375, SKMEL28, WM1366, WM115, and M14) and primary human melanocytes with two different antibodies in parallel with prostate cancer cell lines (LnCaP and 22RV.1) as comparison. All extracts were run in two parallel gels and blotted, respectively, with anti-AR (D6F11; left) or anti-AR (PG-21; right) antibodies. Shown are low- and high-exposure images of the same blots, for better AR detection in highly expressing prostate cancer versus melanoma cells. (I) RT-qPCR analysis of AR mRNA expression in a panel of melanoma cell lines (red), early-passage primary melanoma cells (blue), and primary human melanocytes (gray). Results are expressed as relative to RRLP0 values.
Figure S2.
Figure S2.
Double IF analysis of patient-derived melanocytic lesions. (A–D) IF staining of benign nevi (A, patients 1 and 2), dysplastic nevi (B, patients 3 and 4), primary melanoma (C, patient 6), and metastatic melanoma (D, patients 7, 8, and 9) skin tissues with anti-MelanA (green) and anti-AR (ab74272; red) antibodies, and topographically distinct areas (boxes 1, 2, and 3) used for single-cell AR expression quantification in Fig. 1 B. Shown are representative low- and high-magnification images of the areas used for quantification. Scale bar: 2 mm and 20 µm, respectively.
Figure S3.
Figure S3.
AR down-modulation suppresses melanoma cell growth. (A) Down-modulation of AR expression in a panel of melanoma cell lines and primary melanoma cells (M121008, MM131206, and MM141022) infected with two AR-silencing lentiviruses versus empty control as assessed by RT-qPCR after selection. Data are shown as mean ± SD, one-way ANOVA with Dunnett’s test, *, P < 0.05; **, P < 0.01; ***, P < 0.005; ****, P < 0.001. Cultures, n = 6. (B) Immunoblot analysis of AR protein expression in different melanoma cell lines with or without AR gene silencing as in A. Shown are the immunoblots of AR protein levels after densitometric scanning of the autoradiographs, using actin signal for normalization (lower panels). (C) Cell density assays (CellTiter-Glo) were performed with the indicated melanoma cell lines and primary melanoma cells (M121008, MM131206, and MM141022) infected with two AR-silencing lentiviruses versus empty vector control. Results are presented as luminescence intensity values relative to day 1. Data are shown as mean ± SD, one-way ANOVA with Dunnett’s test, **, P < 0.01; ***, P < 0.005. Cultures, n = 9. (D–F) Colony formation, sphere formation, and EdU incorporation assays with indicated melanoma cell lines with or without AR silencing. Shown are the results of three independent experiments quantifying in each case three culture dishes per condition (indicated by dots, mean ± SD). Results are presented as mean ± SD, one-way ANOVA with Dunnett’s test, **, P < 0.01; ***, P < 0.005; ****, P < 0.001. Cultures, n = 9.
Figure 2.
Figure 2.
AR down-modulation suppresses melanoma cell proliferation potential. (A) Left: WM1366 melanoma cells infected with two AR-silencing lentiviruses versus empty vector control were analyzed by cell density assays (CellTiter-Glo) on the indicated days after selection. Shown are luminescence intensity values relative to day 1 ± SD; one-way ANOVA with Dunnett’s test. Cultures, n = 9; all experiments repeated three times. *, P < 0.05. Right: Heatmap results with additional melanoma cells. Efficiency of AR gene silencing and individual plots for all heatmap results are shown in Fig. S3 (A and B). (B and C) Clonogenicity and sphere formation assays of the same WM1366 together with heatmap results with additional melanoma cells. Results are shown as individual cultured dishes together with mean ± SD; one-way ANOVA with Dunnett’s test. Cultures, n = 9; all experiments repeated three times. *, P < 0.05; ***, P < 0.005. (D–F) Melanoma cells with or without AR silencing as in the previous panels were tested by EdU labeling assay (D), annexin V staining (E), or SA-β gal activity (F). Shown are individual plots for WM1366 melanoma cells together with mean ± SD; one-way ANOVA with Dunnett’s test; heatmap results for all other indicated lines. Cultures, n = 6; all experiments repeated two times. **, P < 0.01; ****, P < 0.001. (G) Right: IF analysis of AR expression in A375 cells stably infected with an AR-overexpressing (AR oe) lentivirus or vector control and superinfected with an AR-silencing lentivirus or corresponding control. Scale bar 10 µm. Quantification of results, also in cells infected with a second AR-silencing lentivirus, together with mRNA expression measurements are shown in Fig. S4 (C and D). Left: Clonogenicity and SA-β gal assays of A375 melanoma cells with or without AR silencing and overexpression as indicated. Data are shown as mean ± SD; one-way ANOVA with Dunnett’s test. Cultures, n = 6; all experiments repeated two times. ***, P < 0.005. Cell density, EdU labeling, and apoptosis assays for the same cells are shown in Fig. S4 E. (H) Proliferation live-cell imaging assays (IncuCyte) of the indicated primary melanocyte strains (c and f) and melanoma cells (M14) stably infected with an AR-overexpressing lentivirus versus empty vector control. Cells were plated in triplicate wells in 96-well plates followed by cell density measurements (four images per well every 4 h for 128 h). Cultures, n = 3; Pearson r correlation test. *, P < 0.05; **, P < 0.01. (I) Immunoblot analysis of AR expression in dCas9-KRAB–expressing melanoma cells (WM1366, SKMEL28, and A375) infected with lentiviruses expressing two sgRNAs targeting the AR promoter region (sgAR1 and sgAR2) versus scrambled sgRNA control (sgCTR) for 3 d. (J and K) Parallel cultures of cells as in I were tested by clonogenicity (J) and SA-β gal (K) assays on triplicate dishes, starting on day 3 after sgRNA expression. Cultures, n = 3 biological replicates; one-way ANOVA with Dunnett’s test. *, P < 0.05; **, P < 0.01; ***, P < 0.005; ****, P < 0.001.
Figure S4.
Figure S4.
Rescue of AR-silencing effects, pharmacological inhibition, and agonist stimulation. (A and B) Apoptosis and senescence assays in melanoma cells with or without AR silencing. Indicated melanoma cell lines infected with two AR-silencing lentiviruses versus empty vector control were tested by AnnexinV staining (A) and SA-β-GAL staining (B) after selection. AnnexinV- and SA-β-GAL–positive cells were counted using ImageJ. Shown are representative images and results of two independent experiments quantifying in each case three culture dishes per condition (indicated by dots, mean ± SD), one-way ANOVA with Dunnett’s test, *, P < 0.05; **, P < 0.01; ***, P < 0.005, ****, P < 0.001. Cultures, n = 6. (C–E) Concomitant AR overexpression suppresses AR-silencing effects. A375 cells stably infected with a lentiviral vector for constitutive AR expression versus LacZ control and superinfected with two AR-silencing lentiviruses versus vector control for 5 d. Shown is a violin plot quantifying AR IF signal intensity (C), with corresponding representative images shown in Fig. 2 G. Cells per condition, n > 20, one-way ANOVA with Dunnett’s test, ****, P < 0.001. (D) Quantification of AR mRNA expression by RT-qPCR analysis of A375 cells with or without AR overexpression and silencing as in C. The same samples were analyzed for levels of CDKN1A expression as a marker/effector of cellular senescence induced by AR gene silencing. (E) The same melanoma cells as in C and D were tested by cell density assays (CellTiter-Glo), EdU incorporation assays, or apoptosis by annexin V staining. For each condition, cells were tested in duplicated culture dishes, with all experiments repeated three times. Data are shown as mean ± SD, one-way ANOVA with Dunnett’s test, **, P < 0.01; ***, P < 0.005. Cultures, n = 6. (F and G) Growth-suppressive effects of AR inhibitors on melanoma cells. (F) Immunoblot analysis of AR protein expression in the indicated melanoma cell lines treated with AZD3514 (10 µM for 48 h) versus DMSO control. (G) Cell density assays (CellTiter-Glo) of the indicated melanoma cell lines and primary melanoma cells (MM130926 and MM141022) treated with AZD3514 (10 µM) versus solvent control (DMSO). Cells were plated on triplicate wells in 96-well dishes followed by cell density/metabolic activity measurements on the indicated days after treatment. Results are presented as luminescence intensity values relative to day 1. Data are shown as mean ± SD, *, P < 0.05; **, P < 0.01. t test. Cultures, n = 6. (H) EdU labeling assays of the indicated melanoma cells treated with AZD3514 (10 µM) versus solvent control (DMSO) on day 5 after treatment. Data are shown as mean ± SD, t test, **, P < 0.01; ***, P < 0.005. Cultures, n = 5. (I and J) Growth-stimulatory effects of DHT treatment of melanoma cells. (I) Proliferation live-cell imaging assays (IncuCyte) of the primary melanocytes (strain f) and SKMEL5 melanoma cells treated with different doses of DHT (5, 10, and 20 nM) versus DMSO control. Cultures, n = 3; Pearson r correlation test, *, P < 0.05. (J) Cell density assays (CellTiter-Glo) of the indicated melanoma cell lines and primary melanoma cells (MM130926 and MM141022) treated with the AR agonist DHT (20 nM) versus solvent control (DMSO) on the indicated days after treatment. Results are presented as luminescence intensity values relative to day 1. (K) Proliferation live-cell imaging assays of the indicated melanoma cells treated with DHT (20 nM) versus DMSO control. Cultures, n = 3; Pearson r correlation test, *, P < 0.05; **, P < 0.01. (L) Cell density assays of the indicated melanoma cells tested under very sparse conditions. Cells were cultured in medium with charcoal-treated serum for 48 h followed by plating at very low numbers (500 cells per 60-mm dish) in the same medium ± treatment with DHT (10 and 20 nM) versus solvent control (DMSO) for 7 d. Data are represented as relative cell density as quantified by ImageJ analysis of crystal violet–stained dishes. one-way ANOVA with Dunnett’s test, *, P < 0.05; **, P < 0.01; ***, P < 0.005. Cultures, n = 3. (M and N) Quantification of nuclear γ-H2A and cytoplasmic DNA IF signal intensity in the indicated melanoma cells with or without CRISPRi-mediated downmodulation of AR expression as shown in Fig. 2 I. More than 100 cells were counted in each condition. Results are expressed as mean. Cultures, n = 3; one-way ANOVA with Dunnett’s test, ****, P < 0.001.
Figure 3.
Figure 3.
Modulation of melanoma cell proliferation by pharmacological inhibition and agonist stimulation. (A) Proliferation live-cell imaging assays (IncuCyte) of the indicated melanoma cell lines treated with the AR inhibitors AZD3514 (2, 5, and 10 µM) or Enzalutamide (5 and 10 µM) versus DMSO control. Number of wells, n = 3; Pearson r correlation test. *, P < 0.05; **, P < 0.01; ***, P < 0.005. (B) WM1366 melanoma cells treated with AZD3514 versus DMSO control were analyzed by cell density assays (CellTiter-Glo) on the indicated days. Data are shown as mean ± SD; one-way ANOVA with Dunnett’s test. Cultures, n = 9; all experiments repeated three times. *, P < 0.05. Right: Heatmap results with additional melanoma cells, with individual plots shown in Fig. S4 G. (C) The indicated melanoma cells were treated with AZD3514 (5 and 10 µM) versus vehicle control (DMSO) followed by cell density determination by crystal violent staining 7 d later. Data are shown as mean ± SD; one-way ANOVA with Dunnett’s test. Cultures, n = 3. ****, P < 0.001. (D) In vitro cancer/stromal cell expansion assays, with RFP-expressing A375 melanoma cells cocultured with GPF-expressing HDFs with or without treatment with AZD3514 (10 µM) or DMSO control for 4 d. Shown are representative images and quantification of melanoma cell expansion (percentage area covered by melanoma cells per field). Each dot represents one analyzed field. Number of fields, n = 12; two-tailed paired t test, ****, P < 0.001. Scale bar: 30 µm. (E) Proliferation live-cell imaging assays (IncuCyte) of two primary melanocyte strains cultured in medium with charcoal-stripped serum and treated with DHT at the indicated concentrations versus DMSO control. Number of wells, n = 3; Pearson r correlation test. *, P < 0.05; **, P < 0.01. Results of a similar assay with another primary melanocyte strain and melanoma cells are shown in Fig. S4 (I and K). (F) Cell density assays (CellTiter-Glo) of WM1366 melanoma cells in medium with charcoal-treated serum and treated with DHT (20 nM) versus DMSO control for the indicated days. Data are shown as mean ± SD; one-way ANOVA with Dunnett’s test. Cultures, n = 9, all experiments repeated three times. *, P < 0.05. Right: Heatmap results with additional melanoma cells, with individual plots shown in Fig. S4 J.
Figure 4.
Figure 4.
Global analysis of AR-regulated genes in melanoma cells and clinical relevance. (A) GSEA of transcriptional profiles elicited by AR silencing in WM1366, SKMEL28, and WM115 melanoma cells by two different lentiviruses versus empty vector control, using a predefined set of gene signatures related to cellular processes and signaling pathways (Broad Institute, http://software.broadinstitute.org/gsea/msigdb/collections.jsp#H). Cells were analyzed 5 d after infection by Clariom D array hybridization. Top: Plot distribution of gene signatures related to IFNα, inflammatory response, and DNA repair pathways. Genes are ranked by signal-to-noise ratio in AR-silenced versus control melanoma cells; position of individual genes is indicated by black vertical bars; enrichment score is in green. Bottom: Relevant gene sets most significantly associated with AR silencing gene signature are indicated together with the corresponding false discovery rate q values. The full list of significantly associated gene signatures is provided in Table S4. (B) Volcano plot of shared transcriptional changes in WM1366, SKMEL28, and WM115 melanoma cells with or without AR silencing. The x axis shows the log2 fold-change, and the y axis shows −log10 of statistical significance (P value). A false discovery rate threshold of 0.05 and fold-change thresholds of −1 and 1 are indicated by dashed red lines. Each dot represents one gene. Gray and red dots correspond to genes not significantly or nonconcordantly modulated in the three melanoma lines, respectively. Black dots show genes above thresholds that are concordantly up- or down-regulated in all three cell lines and compose the AR-silencing gene signature used for further analysis. A few selected genes among the most significantly differentially expressed ones are indicated. The list of 155 genes associated with AR-silencing gene signature is provided in Table S3. (C) Expression of the indicated genes in multiple melanoma cell lines with or without AR silencing by two different lentiviruses versus empty vector control. (D) Association of the AR-silencing gene signature in melanoma cells (as obtained in B) with patients’ survival in SKCM dataset. Positive and negative association scores for each patient were computed from RNA-sequencing data with GSVA R package. Kaplan–Meier curves show that melanomas with positive association with the AR-silencing signature (red, n = 251) have better survival than those with negative association (blue, n = 218); P = 2.6 × 10⁻⁵, log-rank test. (E) Fraction of tumor-infiltrating immune cells estimated by EPIC R package analysis of SKCM dataset, using default reference profile in tumors with positive and negative association with the AR-silencing signature (red and blue box plots, respectively). Cell fractions for B cells, CD4+ T cells, CD8+ T cells, and macrophages are reported (each dot representing one tumor). Outliers with cell fraction >0.15 are not shown. The additional enrichment scores of signature matrix associated with 22 different immune cell types determined by CIBERSORTx are shown in Fig. S5 A (nonsignificant subpopulations are not shown). ****, P < 0.001. (F) Bar plot reporting the concordance between the melanoma AR-silencing gene signature and iLINCS expression profiles of A375 cells treated with compounds targeting AR (blue), TOPO1, and TOPO2A (red). Perturbagens of each class are sorted by concordance (P < 0.0001), and names of chemical compounds are reported on the x axis along with molecular targets. A list of compounds eliciting gene expression profiles with concordance coefficient >0.6 with AR-silencing signature is reported in Table S5.
Figure S5.
Figure S5.
Suppression of melanoma formation by AR silencing or inhibition. (A) Prevalence of stromal and immune cells in TCGA SKCM samples with and without enrichment for the AR-silencing gene signature. Heatmaps reporting mean fractions of significantly prevalent (Wilcoxon rank-sum test, Bonferroni-adjusted P < 0.05) stromal and immune cell types (columns) for TCGA SKCM samples with AR-silencing signature up or down (rows) obtained using CIBERSORTx. Red intensity is proportional to the mean cell fraction, which is also reported in each entry. (B) Double IF analysis of lesions from Fig. 8 A with antibodies against AXL, for melanoma cell identification and CD45-positive cells. Shown is the quantification together with representative images of CD45-positive cells per AXL-positive tumor area, counting in each five fields, five male mice and five female mice; data of male mice in red. Scale bars: 20 µm. ***, P < 0.005. (C) AR silencing inhibits A375 melanoma tumorigenesis. Top: Tumor size, measured by digital caliper (mass = [length × width × height] × π/6) together with representative low-magnification H&E images of the retrieved lesions. Middle: Double IF analysis of lesions with antibodies against MelanA (green), for melanoma cell identification, and Ki67-positive cells. Shown are representative images of MelanA-positive cells stained with antibodies against the other markers, together with relative quantification (counting in each case >50 cells in three to five fields on digitally retrieved images, using ImageJ). Bottom: Double IF analysis of lesions with antibodies against MelanA, CD45, for melanoma cells, and hematopoietic cell identification, respectively. Shown are representative images together with quantification of number of F4/80-positive cells per MelanA-positive tumor area, counting in each case three to four fields. Control versus experimental lesions, n = 20; two-tailed paired t test, *, P < 0.05; **, P < 0.01; ***, P < 0.005. Scale bars: 10 µm. (D) AR silencing inhibits SKMEL28 melanoma tumorigenesis. Top: Tumor size, measured by digital caliper (mass = [length × width × height] × π/6) together with representative low-magnification H&E images of the retrieved lesions. Scale bars: 100 µm. Middle: Double IF analysis of lesions with antibodies against MelanA (green), for melanoma cell identification, and Ki67-positive cells. Shown are representative images of MelanA-positive cells stained with antibodies against the other markers, together with relative quantification (counting in each case >50 cells in three to five fields on digitally retrieved images, using ImageJ). Bottom: Double IF analysis of lesions with antibodies against MelanA, CD45 for melanoma cells, and hematopoietic cell identification, respectively. Shown are representative images together with quantification of number of CD45-positive cells per MelanA-positive tumor area, counting in each case three to four fields. Control versus experimental lesions, n = 6; two-tailed paired t test, *, P < 0.05. Scale bars: 10 µm. (E) AZD3514 pretreatment inhibits WM1366 melanoma tumorigenesis. Top left: Tumor size, measured by digital caliper (mass = [length × width × height] × π/6) together with representative low-magnification H&E images of the retrieved lesions. Double IF analysis of lesions with antibodies against AXL (green), for melanoma cell identification, and Ki67-positive cells (lower left). Shown are representative images of AXL-positive cells stained with Ki67 together with relative quantification (counting in each case >50 cells in three to five fields on digitallyretrieved images, using ImageJ). Right: Double IF analysis of lesions with antibodies against AXL, CD45, and F4/80, for melanoma cell, hematopoietic cell, and macrophage identification, respectively. Shown are representative images together with quantification of number of F4/80-positive cells per AXL positive tumor area (counting in each case three to four fields). Control versus experimental lesions, n = 16; two-tailed paired t test, *, P < 0.05; **, P < 0.01; ***, P < 0.005. Scale bars: 10 µm.
Figure 5.
Figure 5.
Loss of AR function induces DNA breakage, cytoplasmic dsDNA leakage, and STING activation. (A) Comet assays of melanoma cell lines with or without AR silencing on day 1 after selection. Shown are representative images of WM1366 melanoma cells together with quantification of percentage tail DNA (Comet Score) in five different melanoma cell lines. Scale bar: 10 µm. Number of cells, n =125; one-way ANOVA; ****, P < 0.001. (B) Representative double IF images of WM1366 cells with or without AR silencing stained with antibodies against γ-H2AX (green) and phalloidin (gray; upper panel), dsDNA (red) and STING (green; middle panel), and ICAM1 (red; lower panels). Scale bar: 10 µm. (C) Quantification of nuclear γ-H2AX, cytoplasmic DNA, ICAM1 IF signal intensity, and percentage of STING-positive cells in the indicated panel of melanoma cell lines with or without AR silencing. More than 100 cells were counted in each condition. Results are expressed as mean ± SD. Cultures, n = 3; one-way ANOVA with Dunnett’s test, **, P < 0.01, ***, P < 0.005. (D and E) Double IF image analysis of a panel of melanoma cells treated with AZD3514 (10 µM) versus DMSO control for 2 d. Shown are representative images (D) and quantification (E) of the results as in C. Cultures, n = 3; two-tailed paired t test, *, P < 0.05; **, P < 0.01, ***, P < 0.005.
Figure 6.
Figure 6.
Loss of AR function induces STING-dependent gene expression. (A and B) Double IF analysis of WM1366 melanoma cells transfected with STING and/or AR-silencing siRNAs versus scrambled controls, with antibodies against STING (upper panel, green), IL6, and ICAM1 (middle and lower panels, red) and phalloidin staining for cell border delimitation (gray). Shown are representative images (A) and quantification (B) of STING, IL6, and ICAM1 fluorescence signal intensity per cell, 48 h after transfection. Each dot corresponds to mean fluorescence intensity per cell. Number of cells, n = 25; paired t test, ***, P < 0.005, ****, P < 0.001. Scale bar: 10 µm. (C) RT-qPCR analysis of STING, IL6, and ICAM1 mRNA expression in the indicated melanoma cell lines 48 h after transfection with STING and/or AR-silencing siRNAs versus scrambled controls. Each bar corresponds to mean expression levels per melanoma cell line. Data are represented as mean ± SD. Number of strains, n = 3; one-way ANOVA with Dunnett’s test, *, P < 0.05, **, P < 0.01. (D) Representative double IF images and quantification of γ-H2AX expression (green) and cytoplasmic dsDNA leakage (red) in A375 cells stably infected with an AR-overexpressing (AR oe) or control lentivirus and superinfected with two AR-silencing lentiviruses versus control. Scale bar: 10 µm. Data are from triplicate experiments; each dot represents one experiment. Cultures, n = 3; one-way ANOVA with Dunnett’s test, **, P < 0.01. (E) Representative double IF images and quantification of STING (green) and ICAM1 (red) expression in A375 cells with or without AR overexpression and silencing as in D. Independent experiments, n = 3; one-way ANOVA with Dunnett’s test, **, P < 0.01.
Figure 7.
Figure 7.
AR anchors the Ku70 and Ku80 DNA repair proteins to RNA Pol II and prevents RNA Pol II–associated DNA damage. (A) Co-IP analysis with anti-AR and anti-RNA pol II antibodies in WM1366 melanoma cells and immunoblotted for indicted proteins. (B) PLAs of WM1366 melanoma cells with antibodies against AR and Ku70 and nonimmune IgGs as specificity control. Red fluorescence puncta resulting from the juxtaposition of anti-AR and anti-Ku70/Ku80 antibodies were visualized by confocal microscope with concomitant DAPI nuclear staining. Shown are representative images and quantification of the number of puncta per cell. For this and following panels, n (cells per condition) > 50; ***, P < 0.005; ****, P < 0.001, 2-tailed unpaired t test. (C) PLAs of AR and Ku70 association in melanoma cell lines with elevated (WM1366 and SKMEL28) versus low (SKMEL5) levels of total AR protein (as shown in Fig. 1 E), with or without shRNA-mediated AR gene silencing. ***, P < 0.005; ****, P < 0.001. (D) PLAs of AR and Ku70 association in the same melanoma cell lines as in C with or without treatment with the AR inhibitor AZD3514 (10 µM for 48 h). ***, P < 0.005; ****, P < 0.001. (E and F) PLAs of the indicated melanoma cell lines with or without AR gene silencing with antibodies against Ku70 or Ku80 and total RNA Pol II (E) or elongating form (CTD Ser2 phosphorylated; F). ****, P < 0.001. (G) PLAs of melanoma cells with or without AR gene silencing as in F, with antibodies against the elongating form of RNA Pol II and γ-H2AX. Shown are better representative images. Scale bars: 10 µm. ****, P < 0.001. (H) Diagrammatic model of the AR anchoring function, required for Ku70/Ku80 association to the RNA Pol II transcription complex and prevention of transcription-associated DNA damage.
Figure 8.
Figure 8.
Suppression of melanoma formation by AR silencing. WM1366 melanoma cells with or without AR silencing were tested by parallel intradermal Matrigel injections into NOD/SCID male and female mice (five per group; data of male mice in red). (A) Tumor size, measured by digital caliper (mass = [length × width × height] × π/6) together with representative H&E images of the retrieved lesions 16 d after injection. (B–E) Double IF analysis of lesions with antibodies against AXL, for melanoma cell identification, quantification of KI67-positive (B) or cytoplasmic dsDNA–positive (C) cells, and mean fluorescence signal intensity of STING (D) and ICAM1 expression (E). Shown are representative images of AXL-positive cells (AXL signal not shown in C–E) stained with antibodies against the other markers, together with relative quantification (>50 cells in three to five fields). (F) Representative images and quantification of the number of F4/80-positive macrophages per AXL-positive tumor area, counting in each case three to four fields. Similar determination of CD45 positive cells is shown in Fig. S5 B. Control versus experimental lesions, n = 10; two-tailed paired t test, *, P < 0.05; **, P < 0.01; ***, P < 0.005. Scale bar: 10 µm. Similar tumorigenicity experiments with A375 and SKMEL28 cells with or without shRNA-mediated AR silencing is shown in Fig. S5 (C and D).
Figure 9.
Figure 9.
Suppression of melanoma formation by AR inhibition. (A–F) RFP-expressing A375 melanoma cells were injected intradermally into 10 male mice. 3 d after injection, mice were treated by oral gavage with either AZD3514 (50 mg/kg) or DMSO vehicle alone for 12 consecutive days. IF analysis was used to assess KI67 (A) and cytoplasmic dsDNA (B) positivity and STING (C) and ICAM1 (D) expression levels in melanoma cells (RFP-positive) together with numbers of juxtaposed leukocytes (E) and macrophages (F), as assessed by staining for the CD45 and F4/80 markers, respectively. Shown are quantifications together with representative images, including one (F) showing engulfment of fragmented RFP-positive melanoma cells into F4/80-positive macrophages in lesions of mice treated with the AZD3514 inhibitor. Control versus experimental lesions, n = 4 and 10; unpaired t test, **, P < 0.01; ***, P < 0.005, ****, P < 0.001. Scale bar: 10 µm (A–F). Similar tumorigenicity experiments with injection of AZD3514-pretreated WM1366 cells are shown in Fig. S5 E.
Figure 10.
Figure 10.
Suppression of mouse melanoma formation and immune cells recruitment by AR gene silencing. (A–C) Mouse melanoma cells YUMM1.7 were infected with two AR-silencing lentiviruses versus empty vector control, 24 h after selection, by determination of AR mRNA levels (A), cell density (B), and EdU labeling assay (C). (D) YUMM1.7 cells were treated with AZD3514 (10 µM) versus DMSO control followed by cell density assays on the indicated days after treatment. Data are shown as mean ± SD; one-way ANOVA with Dunnett’s test, *, P < 0.05; **, P < 0.01; ****, P < 0.001. Cultures, n = 6. (E and F) RFP-expressing YUMM1.7 cells with or without AR silencing were tested by parallel intradermal Matrigel injections into C57BL/6JOIaHsd male and female mice (four per group; data of male mice in red). Shown are representative H&E and IF images of the retrieved lesions 14 d after injections and determination of tumor mass (E) and percentage of KI67-positive RPF-expressing YUMM1.7 cells. For F, >50 cells in three to five fields per lesion; control versus experimental lesions, n = 8; two-tailed paired t test, *, P < 0.05. Scale bar: 500 µm (E) and 100 µm (F). (G–J) FACS analysis of tumor dissociated cells for total numbers of macrophage cells (CD45+ Gr-1 F4/80+ CD11b+; G), percentage of macrophages in the CD45+ cell populations (left and right panels, respectively; H), percentage of CD4+ T cells (CD45+ CD3+ CD4+) over total CD45+ leukocytes and fraction of regulatory T cells (Tregs; CD45+ CD3+ CD4+ FoxP3+) within CD4+ T cells, and percentage of CD8+ T cells (CD45+ CD3+ CD8+) over total CD45+ leukocytes (I) and of CD44+ population of CD8+ T cells together with mean fluorescence intensity (MFI) levels of LAG-3 and PD-1 staining in CD44+ fraction cells (J). Control versus experimental lesions, n = 8; two-tailed paired t test, *, P < 0.05; **, P < 0.01; n.s, not significant.

References

    1. Adutler-Lieber, S., Friedman N., and Geiger B.. 2018. Expansion and Antitumor Cytotoxicity of T-Cells Are Augmented by Substrate-Bound CCL21 and Intercellular Adhesion Molecule 1. Front. Immunol. 9:1303 10.3389/fimmu.2018.01303 - DOI - PMC - PubMed
    1. An, X., Zhu Y., Zheng T., Wang G., Zhang M., Li J., Ji H., Li S., Yang S., Xu D., et al. . 2019. An Analysis of the Expression and Association with Immune Cell Infiltration of the cGAS/STING Pathway in Pan-Cancer. Mol. Ther. Nucleic Acids. 14:80–89. 10.1016/j.omtn.2018.11.003 - DOI - PMC - PubMed
    1. Bambury, R.M., and Scher H.I.. 2015. Enzalutamide: Development from bench to bedside. Urol. Oncol. 33:280–288. 10.1016/j.urolonc.2014.12.017 - DOI - PubMed
    1. Bonner, W.M., Redon C.E., Dickey J.S., Nakamura A.J., Sedelnikova O.A., Solier S., and Pommier Y.. 2008. GammaH2AX and cancer. Nat. Rev. Cancer. 8:957–967. 10.1038/nrc2523 - DOI - PMC - PubMed
    1. Bottoni, G., Katarkar A., Tassone B., Ghosh S., Clocchiatti A., Goruppi S., Bordignon P., Jafari P., Tordini F., Lunardi T., et al. . 2019. CSL controls telomere maintenance and genome stability in human dermal fibroblasts. Nat. Commun. 10:3884 10.1038/s41467-019-11785-7 - DOI - PMC - PubMed

Publication types

MeSH terms