Evaluation of Risk-Adjusted Home Time After Hospitalization for Heart Failure as a Potential Hospital Performance Metric
- PMID: 33112393
- PMCID: PMC7593877
- DOI: 10.1001/jamacardio.2020.4928
Evaluation of Risk-Adjusted Home Time After Hospitalization for Heart Failure as a Potential Hospital Performance Metric
Abstract
Importance: Thirty-day home time, defined as time spent alive and out of a hospital or facility, is a novel, patient-centered performance metric that incorporates readmission and mortality.
Objectives: To characterize risk-adjusted 30-day home time in patients discharged with heart failure (HF) as a hospital-level quality metric and evaluate its association with the 30-day risk-standardized readmission rate (RSRR), 30-day risk-standardized mortality rate (RSMR), and 1-year RSMR.
Design, setting, and participants: This hospital-level cohort study retrospectively analyzed 100% of Medicare claims data from 2 968 341 patients from 3134 facilities from January 1, 2012, to November 30, 2017.
Exposures: Home time, defined as time spent alive and out of a short-term hospital, skilled nursing facility, or intermediate/long-term facility 30 days after discharge.
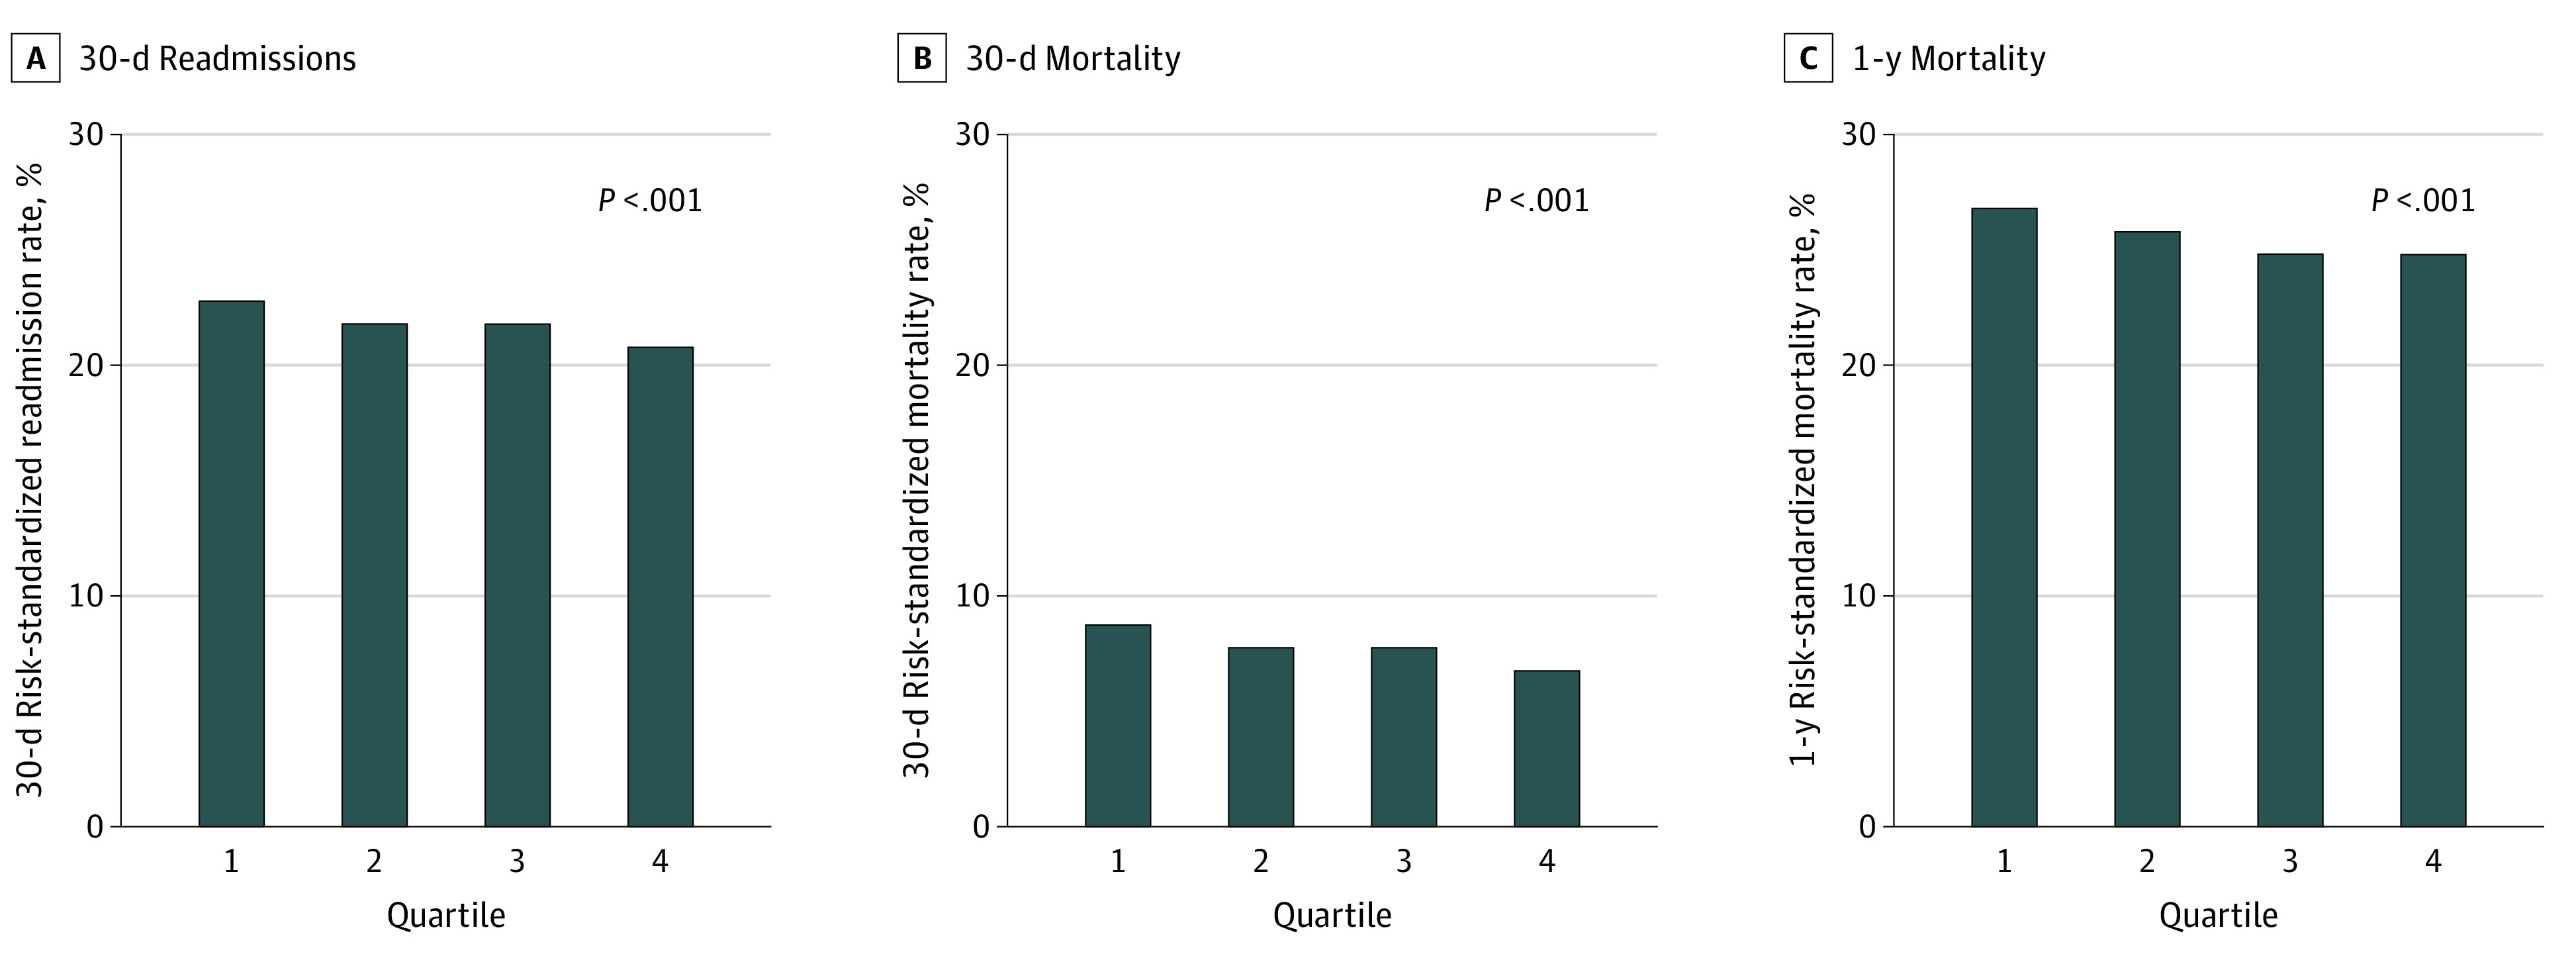
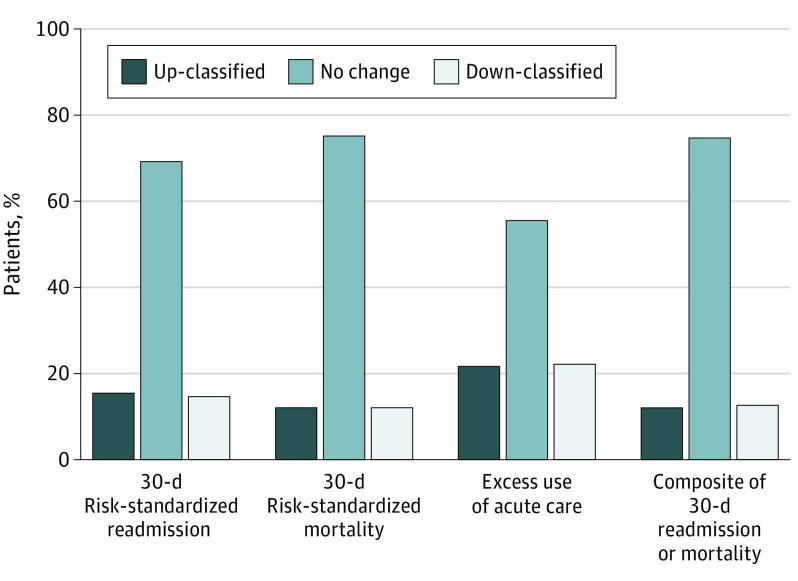
Main outcomes and measures: For each hospital, a risk-adjusted 30-day home time for HF was calculated similar to the Centers for Medicare & Medicaid Services risk-adjustment models for 30-day RSRR and RSMR. Hospitals were categorized into quartiles (lowest to highest risk-adjusted home time). The correlations between hospital rates of risk-adjusted 30-day home time and 30-day RSRR, 30-day RSMR, and 1-year RSMR were estimated using the Pearson correlation coefficient. Distribution of days lost from a perfect 30-day home time were calculated. Reclassification of hospital performance using 30-day home time vs 30-day RSRR was also evaluated.
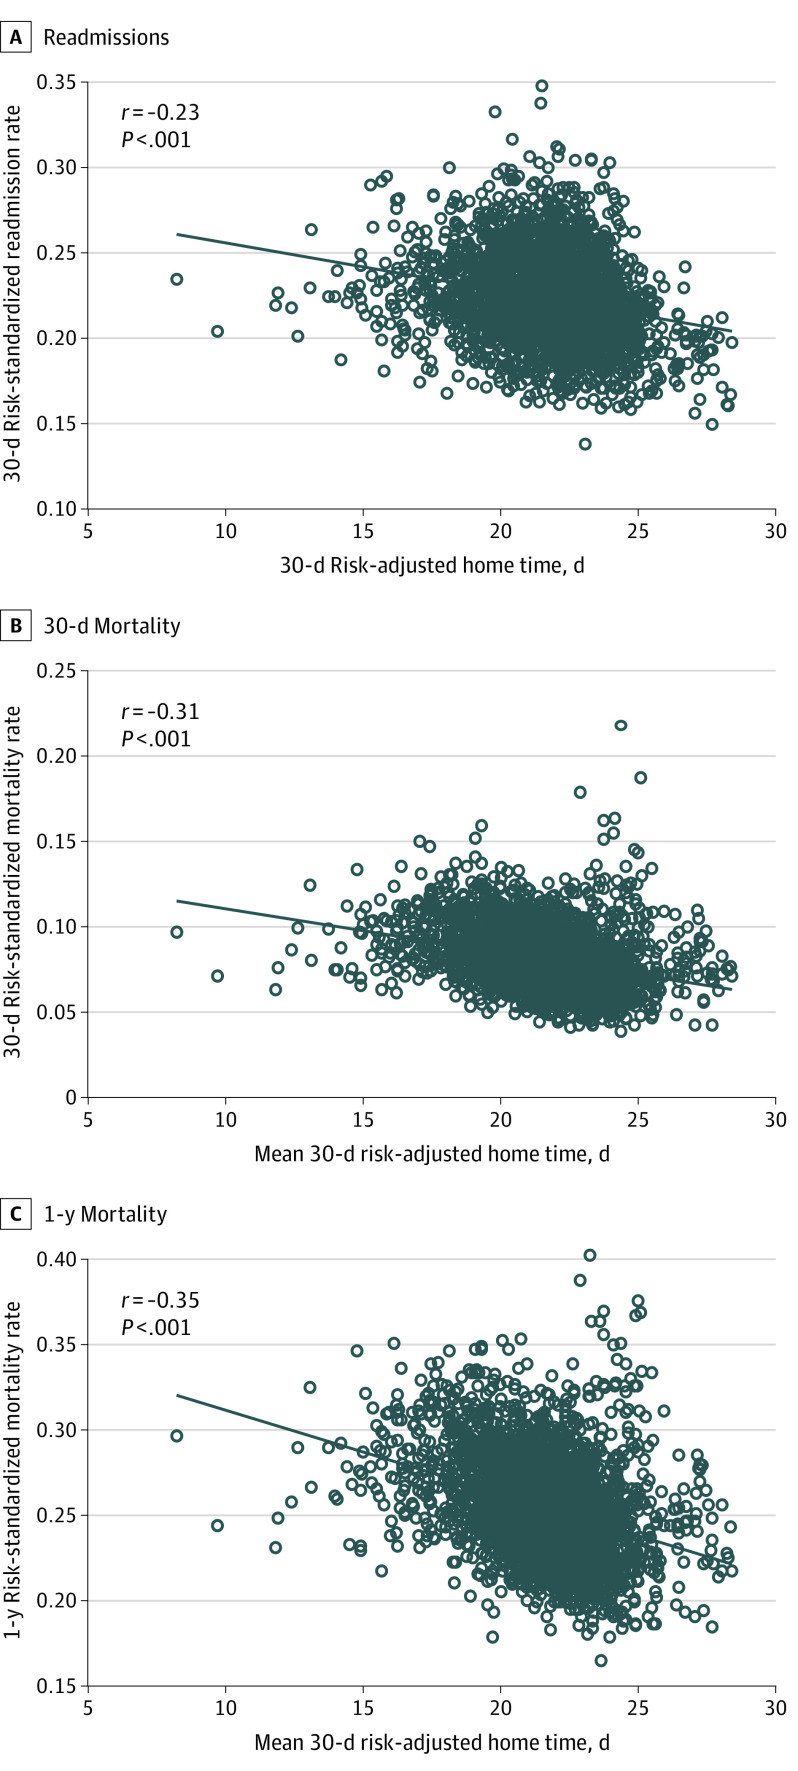
Results: Overall, 2 968 341 patients (mean [SD] age, 81.0 [8.3] years; 53.6% female) from 3134 hospitals were included in this study. The median hospital risk-adjusted 30-day home time for patients with HF was 21.77 days (range, 8.22-28.41 days). Hospitals in the highest quartile of risk-adjusted 30-day home time (best-performing hospitals) were larger (mean [SD] number of beds, 285 [275]), with a higher volume of patients with HF (median, 797 patients; interquartile range, 395-1484) and were more likely academic hospitals (59.9%) with availability of cardiac surgery (51.1%) and cardiac rehabilitation (68.8%). A total of 72% of home time lost was attributable to stays in an intermediate- or long-term care facility (mean [SD], 2.65 [6.44] days) or skilled nursing facility (mean [SD], 3.96 [9.04] days), 13% was attributable to short-term readmissions (mean [SD], 1.25 [3.25] days), and 15% was attributable to death (mean [SD], 1.37 [6.04] days). Among 30-day outcomes, the 30-day RSRR and 30-day RSMR decreased in a graded fashion across increasing 30-day home time categories (correlation coefficients: 30-day RSRR and 30-day home time, -0.23, P < .001; 30-day RSMR and 30-day home time, -0.31, P < .001). Similar patterns of association were also noted for 1-year RSMR and 30-day home time (correlation coefficient, -0.35, P < .001). Thirty-day home time meaningfully reclassified hospital performance in 30% of the hospitals compared with 30-day RSRR and in 25% of hospitals compared with 30-day RSMR.
Conclusions and relevance: In this study, 30-day home time among patients discharged after a hospitalization for HF was objectively assessed as a hospital-level quality metric using Medicare claims data and was associated with readmission and mortality outcomes and with reclassification of hospital performance compared with 30-day RSRR and 30-day RSMR.
Conflict of interest statement
Figures
Comment in
-
Incorporating Patient Preferences Into Hospital Quality Metrics for Heart Failure.JAMA Cardiol. 2021 Feb 1;6(2):177-178. doi: 10.1001/jamacardio.2020.4964. JAMA Cardiol. 2021. PMID: 33112367 No abstract available.
Similar articles
-
Risk-Adjusted, 30-Day Home Time After Transcatheter Aortic Valve Replacement as a Hospital-Level Performance Metric.J Am Coll Cardiol. 2022 Jan 18;79(2):132-144. doi: 10.1016/j.jacc.2021.10.038. J Am Coll Cardiol. 2022. PMID: 35027108 Free PMC article.
-
Evaluation of Risk-Adjusted Home Time After Acute Myocardial Infarction as a Novel Hospital-Level Performance Metric for Medicare Beneficiaries.Circulation. 2020 Jul 7;142(1):29-39. doi: 10.1161/CIRCULATIONAHA.119.044765. Epub 2020 May 15. Circulation. 2020. PMID: 32408764 Free PMC article.
-
Risk-Standardized Home Time as a Novel Hospital Performance Metric for Pneumonia Hospitalization Among Medicare Beneficiaries: a Retrospective Cohort Study.J Gen Intern Med. 2021 Oct;36(10):3031-3039. doi: 10.1007/s11606-021-06712-w. Epub 2021 Apr 26. J Gen Intern Med. 2021. PMID: 33904043 Free PMC article.
-
Geographic access to cardiac rehabilitation and cardiovascular disease outcomes: A study of rural United States counties.Curr Probl Cardiol. 2024 Sep;49(9):102740. doi: 10.1016/j.cpcardiol.2024.102740. Epub 2024 Jul 5. Curr Probl Cardiol. 2024. PMID: 38972468 Review.
-
Promoting Participation in Pulmonary Rehabilitation after Hospitalization for Chronic Obstructive Pulmonary Disease, Strategies of Top-performing Systems: A Qualitative Study.Ann Am Thorac Soc. 2023 Apr;20(4):532-538. doi: 10.1513/AnnalsATS.202203-237OC. Ann Am Thorac Soc. 2023. PMID: 36449407 Free PMC article. Review.
Cited by
-
Days at Home After Transcatheter Mitral Valve Repair Versus Medical Therapy Alone in Heart Failure.J Am Heart Assoc. 2025 Jan 7;14(1):e038401. doi: 10.1161/JAHA.124.038401. Epub 2024 Dec 24. J Am Heart Assoc. 2025. PMID: 39719428 Free PMC article. Clinical Trial.
-
Comparing Hospital-Free Days by Frailty Status for Patients Undergoing Surgical Intervention for Cardiovascular Disease.J Am Coll Surg. 2025 Sep 1;241(3):438-447. doi: 10.1097/XCS.0000000000001408. Epub 2025 Aug 14. J Am Coll Surg. 2025. PMID: 40226927
-
Risk-Adjusted, 30-Day Home Time After Transcatheter Aortic Valve Replacement as a Hospital-Level Performance Metric.J Am Coll Cardiol. 2022 Jan 18;79(2):132-144. doi: 10.1016/j.jacc.2021.10.038. J Am Coll Cardiol. 2022. PMID: 35027108 Free PMC article.
-
Achieving Equity in Hospital Performance Assessments Using Composite Race-Specific Measures of Risk-Standardized Readmission and Mortality Rates for Heart Failure.Circulation. 2023 Apr 11;147(15):1121-1133. doi: 10.1161/CIRCULATIONAHA.122.061995. Epub 2023 Apr 10. Circulation. 2023. PMID: 37036906 Free PMC article.
-
Hospital Heart Failure Medical Therapy Score and Associated Clinical Outcomes and Costs.JAMA Cardiol. 2024 Nov 1;9(11):1029-1038. doi: 10.1001/jamacardio.2024.2969. JAMA Cardiol. 2024. PMID: 39320905
References
-
- Benjamin EJ, Muntner P, Alonso A, et al. ; American Heart Association Council on Epidemiology and Prevention Statistics Committee and Stroke Statistics Subcommittee . Heart disease and stroke statistics-2019 update: a report from the American Heart Association. Circulation. 2019;139(10):e56-e528. doi:10.1161/CIR.0000000000000659 - DOI - PubMed
MeSH terms
LinkOut - more resources
Full Text Sources
Other Literature Sources
Medical
Research Materials
Miscellaneous