Selective serotonin reuptake inhibitor attenuates the hyperresponsiveness of TLR2+ and TLR4+ Th17/Tc17-like cells in multiple sclerosis patients with major depression
- PMID: 33112414
- PMCID: PMC7884649
- DOI: 10.1111/imm.13281
Selective serotonin reuptake inhibitor attenuates the hyperresponsiveness of TLR2+ and TLR4+ Th17/Tc17-like cells in multiple sclerosis patients with major depression
Abstract
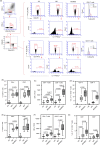
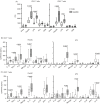
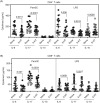
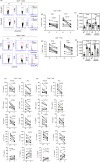
Elevated frequency of Th17-like cells expressing Toll-like receptors (TLRs) has been recently associated with relapsing-remitting multiple sclerosis (MS) pathogenesis, a chronic inflammatory demyelinating autoimmune disease of the central nervous system. We aimed to investigate the impact of current major depressive disorder (MDD) on the behaviour of these cells following in vitro stimulation with TLR2, TLR4, TLR5 and TLR9 agonists. Here, the level of both cell proliferation and cytokine production related to Th17/Tc17 phenotypes in response to TLR2 (Pam3C) and TLR4 (LPS) ligands was significantly higher in CD4+ and CD8+ T-cell cultures from MS/MDD patients when compared to non-depressed patients. These cytokine levels were positively associated with neurological disabilities in patients. No difference for responsiveness to TLR5 (flagellin) and TLR9 (ODN) agonists was observed. LPS, but not Pam3C, induced significant IL-10 release, mainly in patients without MDD. Interestingly, more intense expression of TLR2 and TLR4 on these cells was observed in MDD patients. Finally, in vitro addition of serotonin and treatment of MDD patients with selective serotonin reuptake inhibitors (SSRIs) reduced the production of Th17/Tc17-related cytokines by CD4+ and CD8+ T cells in response to Pam3C and LPS. However, only SSRI therapy diminished the frequency and intensity of TLR2 and TLR4 expression on circulating CD4+ and CD8+ T cells. In summary, although preliminary, our findings suggest that adverse events that elevate circulating levels of TLR2 and TLR4 ligands can affect MS pathogenesis, particularly among depressed patients.
Keywords: Multiple sclerosis; PAMP; TLR; Tc17; Th17; cytokines; major depressive disorder; selective serotonin reuptake inhibitors; serotonin.
© 2020 John Wiley & Sons Ltd.
Conflict of interest statement
All authors declare that there are no conflicts of interest.
Figures


Similar articles
-
Elevated proportion of TLR2- and TLR4-expressing Th17-like cells and activated memory B cells was associated with clinical activity of cerebral cavernous malformations.J Neuroinflammation. 2022 Feb 2;19(1):28. doi: 10.1186/s12974-022-02385-2. J Neuroinflammation. 2022. PMID: 35109870 Free PMC article.
-
TLR-2 and TLR-4 agonists favor expansion of CD4+ T cell subsets implicated in the severity of neuromyelitis optica spectrum disorders.Mult Scler Relat Disord. 2019 Sep;34:66-76. doi: 10.1016/j.msard.2019.06.018. Epub 2019 Jun 18. Mult Scler Relat Disord. 2019. PMID: 31229737
-
Major depression favors the expansion of Th17-like cells and decrease the proportion of CD39+Treg cell subsets in response to myelin antigen in multiple sclerosis patients.Cell Mol Life Sci. 2022 May 18;79(6):298. doi: 10.1007/s00018-022-04315-0. Cell Mol Life Sci. 2022. PMID: 35585332 Free PMC article.
-
The Effect of Second-Generation Antidepressant Treatment on the Memory of Patients With Major Depressive Disorder: A Meta-analysis Study With Structural Equation Models.J Clin Psychopharmacol. 2020 Jan/Feb;40(1):54-62. doi: 10.1097/JCP.0000000000001150. J Clin Psychopharmacol. 2020. PMID: 31834095 Review.
-
[Fluoxetine: an update of its use in major depressive disorder in adults].Encephale. 2004 Jul-Aug;30(4):392-9. doi: 10.1016/s0013-7006(04)95453-x. Encephale. 2004. PMID: 15597466 Review. French.
Cited by
-
Antidepressant fluoxetine alleviates colitis by reshaping intestinal microenvironment.Cell Commun Signal. 2024 Mar 12;22(1):176. doi: 10.1186/s12964-024-01538-5. Cell Commun Signal. 2024. PMID: 38475799 Free PMC article.
-
Emerging Roles of T Helper Cells in Non-Infectious Neuroinflammation: Savior or Sinner.Front Immunol. 2022 Jun 30;13:872167. doi: 10.3389/fimmu.2022.872167. eCollection 2022. Front Immunol. 2022. PMID: 35844577 Free PMC article. Review.
-
Depression and anxiety in multiple sclerosis. Review of a fatal combination.J Neural Transm (Vienna). 2024 Aug;131(8):847-869. doi: 10.1007/s00702-024-02792-0. Epub 2024 Jun 13. J Neural Transm (Vienna). 2024. PMID: 38869643 Review.
-
Toll-like Receptors in Immuno-Metabolic Regulation of Emotion and Memory.Cells. 2025 Jun 19;14(12):933. doi: 10.3390/cells14120933. Cells. 2025. PMID: 40558558 Free PMC article. Review.
-
Depression and Obesity in Patients With Psoriasis and Psoriatic Arthritis: Is IL-17-Mediated Immune Dysregulation the Connecting Link?Front Immunol. 2021 Jul 21;12:699848. doi: 10.3389/fimmu.2021.699848. eCollection 2021. Front Immunol. 2021. PMID: 34367160 Free PMC article. Review.
References
-
- Lisak RP. Multiple sclerosis: evidence is immunopathogenesis. Neurology. 1980; 30:99–105. - PubMed
-
- M.S.I.F., 2013 . Atlas of MS 2013: Mapping Multiple Sclerosis Around the World. Multiple Sclerosis International Federation. Available at: https://www.msif.org/wp‐content/uploads/2014/09/Atlas‐of‐MS.pdf. Accessed June 1, 2020.
-
- Milo R, Miller A. Revised diagnostic criteria of multiple sclerosis. Autoimmun Rev. 2014; 13:518–24. - PubMed
-
- Schumacher GA, Beebe G, Kibler RF, Kurland LT, Kurtzke JF, McDowell F, et al. Problems of experimental trials of therapy in multiple sclerosis: report by the panel on the evaluation of experimental trials of therapy in multiple sclerosis. Ann N Y Acad Sci. 2006; 122:552–68. - PubMed
-
- Matusevicius D, Kivisäkk P, He B, Kostulas N, Özenci V, Fredrikson S, et al. Interleukin‐17 mRNA expression in blood and CSF mononuclear cells is augmented in multiple sclerosis. Mult Scler J. 1999; 5:101–4. - PubMed
Publication types
MeSH terms
Substances
LinkOut - more resources
Full Text Sources
Research Materials

