. 2020 Dec;30(12):1356-1370.
doi: 10.1002/hipo.23276. Epub 2020 Oct 28.

NMDA receptors promote hippocampal sharp-wave ripples and the associated coactivity of CA1 pyramidal cells

Affiliations

NMDA receptors promote hippocampal sharp-wave ripples and the associated coactivity of CA1 pyramidal cells

Timothy Howe et al. Hippocampus. 2020 Dec.

Abstract

Hippocampal sharp-wave ripples (SWRs) support the reactivation of memory representations, relaying information to neocortex during "offline" and sleep-dependent memory consolidation. While blockade of NMDA receptors (NMDAR) is known to affect both learning and subsequent consolidation, the specific contributions of NMDAR activation to SWR-associated activity remain unclear. Here, we combine biophysical modeling with in vivo local field potential (LFP) and unit recording to quantify changes in SWR dynamics following inactivation of NMDAR. In a biophysical model of CA3-CA1 SWR activity, we find that NMDAR removal leads to reduced SWR density, but spares SWR properties such as duration, cell recruitment and ripple frequency. These predictions are confirmed by experiments in which NMDAR-mediated transmission in rats was inhibited using three different NMDAR antagonists, while recording dorsal CA1 LFP. In the model, loss of NMDAR-mediated conductances also induced a reduction in the proportion of cell pairs that co-activate significantly above chance across multiple events. Again, this prediction is corroborated by dorsal CA1 single-unit recordings, where the NMDAR blocker ketamine disrupted correlated spiking during SWR. Our results are consistent with a framework in which NMDA receptors both promote activation of SWR events and organize SWR-associated spiking content. This suggests that, while SWR are short-lived events emerging in fast excitatory-inhibitory networks, slower network components including NMDAR-mediated currents contribute to ripple density and promote consistency in the spiking content across ripples, underpinning mechanisms for fine-tuning of memory consolidation processes.

Keywords: NMDA receptors; computational model; sharp-wave ripples; spindles.


Conflict of interest statement

CONFLICT OF INTEREST

The authors declare no conflict of interest.

Figures

FIGURE 1
FIGURE 1
Computational model of spontaneous sharp-wave ripple (SWR) activity in CA3-CA1 (a) Representation of network elements, shows the two subnetworks (CA3 and CA1), populated with excitatory (gray) and inhibitory (red) neurons, connected by synapses, with recurrent excitatory connections among CA3 pyramidal cells and projections from CA3 pyramidal cells to excitatory and inhibitory cells in CA1. The network has 240 inhibitory cells and 1,200 excitatory cells in CA3, 160 inhibitory cells, and 800 excitatory cells in CA1. (b) Example of NMDA connectivity matrix in one simulation, note that NMDA connections follow a topography that favors nearby postsynaptic cells within an absolute radius of a third of the network. The topography is inherited in the Schaffer collateral component of NMDA synapses. Note that no NMDA synapses to inhibitory cells or from CA1 pyramidal cells are present in this model. (c) A rastergram showing one simulation output. The top two plots mark the spike timing of each cell in the network, red marks are for inhibitory cells and black marks for excitatory. Each line corresponds to a different cell. The x-axis shows 10 s of a 100 s simulation. The bottom two plots quantify ongoing network activity by summing all pyramidal cell spikes in CA3 (or CA1) in a sliding 100 ms window and normalize that by the total number of pyramidal cells in the subnetwork. Note how SWR activity corresponds to peaks in the spiking probability plots both in CA3 and CA1, and that the SWR activity in the network can show long pauses (more than 5 s in this case) during which the network shows irregular activity. (d) Same as Panel (c) but showing one example of the model network activity with blocked NMDA receptors
FIGURE 2
FIGURE 2
Comparing networks with (blue) and without (orange) NMDA Mean and SDs of sharp waves (SPW) in CA3 and ripples (RPL) in CA1 properties comparing a pool of 40 simulations (100 s each) that include NMDA synapses and 40 simulations (100 s each) that did not. The presence of NMDA results in a much higher density (count per second) of events both in CA3 and CA1 (a) (Mann–Whitney test for both SPW and RPL comparisons, RPL p = 2.20e-6, SPW p = 7.02e-7), but does not induce changes in basic biophysical properties of the sharp-wave ripples (SWRs) such as duration (b) and within-ripple frequency (c). Removing NMDA synapses affects the distribution of interevent times both in CA3 (d) and CA1 (e), shown as sample probability plots. The lower plots (green bars) report the difference in bar height between the two plots (with minus without) to emphasize that the highest impact of removing NMDA is the loss of short-time interevent gaps
FIGURE 3
FIGURE 3
Removing NMDA connections disrupts consistent co-activation of cell pairs across ripples. Analysis of the network spiking activity during sharp-wave ripples (SWRs) revealed that biophysical properties such as spike count during the events for each cell population (a) and the fraction of cells active in each event (b) are not altered after NMDA removal (blue—NMDA, orange—no NMDA). (c) Representation of the method used to evaluate if a cell pair (Cells A and B in the example) co-activates across ripples more often than chance. The co-activation is found as fraction of events (SPW for CA3 cell pairs, RPL for CA1 cell pairs) in which both cells spiked at least once (regardless of order). The activation rate of each cell is found as the fraction of ripples in which it spiked. Bernoulli variables with probabilities matching the activation rates are independently drawn for as many times as events in the simulation (e.g., if four ripples happened, the variables are drawn four times), and the sample co-activation rate is found. This sampling is repeated 10,000 times, generating a probability distribution histogram, which is compared to the co-activation value found in the original simulation (the blue pin). (d) Example of the co-activation value and probability histogram for a cell pair in a simulation. If the distance between the blue pin (true co-activation value) and the mean of the histogram is larger than 2 SDs of the histogram, the pair is deemed “significantly co-active,” meaning its co-activation across ripples in the simulation exceeds statistical chance. (e) Bar plot comparing the fraction of significantly co-active pairs when 100 pairs are randomly selected in each simulation and classified as significantly co-active (or not) according to the method shown in (c) and (d). Bars show average across 40 simulations in each group (NMDA conductance present or removed) and standard error of the mean. Star marks that the two sets of values are significantly different (Mann–Whitney test, p = 4 e-4)
FIGURE 4
FIGURE 4
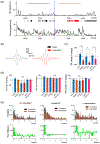
Effects of NMDAR antagonists on in vivo ripple properties (a) Time course of an example experiment in which 0.1 mg MK801 was administered. Upper panel shows density of detected ripples. Vertical dashed line denotes injection time (time 0 s), and horizontal bars denote preinjection (black) and postinjection (red) analysis windows. Lower panel shows smoothed running speed of the animal, and the central raster plot denotes detected inactivity periods eligible for ripple analyses, with those inside the analysis windows colored black for baseline, and red for postinjection. (b) Ripple-triggered average waveform of the CA1 LFP in the baseline time window (left panel) and the postinjection time window (right panel) for the rat shown in (a). (c) Comparison of percentage change in mean ripple density between baseline and postinjection time windows across all rats, for rats injected with saline (blue bars) and each of the three drugs (red bars). Error bars denote SEM. (d) Percentage change in other ripple properties between baseline and postinjection time windows across all rats, for rats injected with saline (blue bars) and each drug (red bars). Left: mean ripple amplitude, middle: mean intraripple frequency, right: mean length of ripple events. Error bars denote SEM. (e) Effect of three NMDAR antagonists on interripple interval. Top panel: histogram bars denote mean probability of each time bin across all rats, error bars denote SEM. Black bars: preinjection and orange bars: postinjection. Lower panel: difference in mean probability between preinjection and postinjection conditions for each time bin of the histogram
FIGURE 5
FIGURE 5
Effects of 8 mg/kg ketamine on ripple spiking coactivity within CA1. (a,b) Multiunit activity (MUA, z-scored) time-referred to ripple peak in immobility times before (black, baseline trace) and after injection of saline (blue trace, n = 7) (a) or 8 mg/kg ketamine (orange trace, n = 7) (b). Note that peak MUA during ripples is lower when NMDA transmission is inhibited by ketamine, in contrast to modeling results (Figure 3) that suggest no change in overall spiking during ripples. (c–e) Comparison of cell pair co-activation rates in saline versus ketamine injections, performed following the same methods used for the computational model (Figure 3, Panels c–e). (c) One example of co-activation rate for pyramidal cells in CA1 after saline injection (blue pin) in relation to the histogram of possible co-activation rates derived from independent draws of Bernoulli variables with rates matching the experimentally shown activation rates for these two cells. Arrows show the distance between the actual co-activation value and the distribution mean (d) and the SD of the histogram distribution (σ). (d) For each cell pair detected, its excessive co-occurrence was evaluated as the ratio D/σ (defined in Panel c). Black circles show the excessive co-occurrence found for all pairs in our experiments, separated in saline vs. ketamine condition. Bar plots show mean and SEM for each group. (e) For each cell pair, if its excessive co-occurrence was above 2 (meaning the true co-occurrence was 2 SDs bigger than the bootstrapped mean), it would be classified as significantly co-active. Bar plot shows mean and SEM across all available cell pairs, in the saline vs. ketamine condition. Note that inhibition of NMDA transmission results in strong reduction of above-chance co-activation of cell pairs

Similar articles

Cited by

References

    1. Abraham WC, & Robins A (2005). Memory retention—The synaptic stability versus plasticity dilemma. Trends in Neurosciences, 28(2), 73–78. 10.1016/j.tins.2004.12.003 - DOI - PubMed
    1. Andrasfalvy BK, & Magee JC (2001). Distance-dependent increase in AMPA receptor number in the dendrites of adult hippocampal CA1 pyramidal neurons. The Journal of Neuroscience, 21(23), 9151–9159. - PMC - PubMed
    1. Berman RM, Cappiello A, Anand A, Oren DA, Heninger GR, Charney DS, & Krystal JH (2000). Antidepressant effects of ketamine in depressed patients. Biological Psychiatry, 47(4), 351–354. 10.1016/s0006-3223(99)00230-9 - DOI - PubMed
    1. Bliss TV, & Collingridge GL (1993). A synaptic model of memory: Long-term potentiation in the hippocampus. Nature, 361(6407), 31–39. 10.1038/361031a0 - DOI - PubMed
    1. Brette R, & Gerstner W (2005). Adaptive exponential integrate-and-fire model as an effective description of neuronal activity. Journal of Neurophysiology, 94(5), 3637–3642. 10.1152/jn.00686.2005 - DOI - PubMed

Publication types

MeSH terms

Substances