. 2020 Dec 15;31(26):2892-2903.
doi: 10.1091/mbc.E20-09-0591. Epub 2020 Oct 28.

ESCargo: a regulatable fluorescent secretory cargo for diverse model organisms

Affiliations

ESCargo: a regulatable fluorescent secretory cargo for diverse model organisms

Jason C Casler et al. Mol Biol Cell. .

Abstract

Membrane traffic can be studied by imaging a cargo protein as it transits the secretory pathway. The best tools for this purpose initially block export of the secretory cargo from the endoplasmic reticulum (ER) and then release the block to generate a cargo wave. However, previously developed regulatable secretory cargoes are often tricky to use or specific for a single model organism. To overcome these hurdles for budding yeast, we recently optimized an artificial fluorescent secretory protein that exits the ER with the aid of the Erv29 cargo receptor, which is homologous to mammalian Surf4. The fluorescent secretory protein forms aggregates in the ER lumen and can be rapidly disaggregated by addition of a ligand to generate a nearly synchronized cargo wave. Here we term this regulatable secretory protein ESCargo (Erv29/Surf4-dependent secretory cargo) and demonstrate its utility not only in yeast cells, but also in cultured mammalian cells, Drosophila cells, and the ciliate Tetrahymena thermophila. Kinetic studies indicate that rapid export from the ER requires recognition by Erv29/Surf4. By choosing an appropriate ER signal sequence and expression vector, this simple technology can likely be used with many model organisms.


Figures
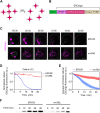
FIGURE 1:
FIGURE 1:
ESCargo as a tool for monitoring secretion in S. cerevisiae. (A) Strategy for generating and dissolving fluorescent aggregates. DsRed-Express2 tetramers (red) fused to a dimeric variant of FKBP (gold) associate to form aggregates. Addition of the FKBP ligand SLF (blue) blocks dimerization, thereby dissolving the aggregates into soluble tetramers. (B) Functional segments of the ESCargo construct. pOst1 (green): ER signal sequence that directs cotranslational translocation in yeast. APVNTT (pink): tripeptide ER export signal followed by tripeptide N-linked glycosylation signal. DsRed-Express2 (red): tetrameric red fluorescent protein. Dimeric FKBP (gold): reversibly dimerizing FKBPRD(C22V) variant. The lengths of the segments are not to scale. (C) Secretion of ESCargo in yeast cells containing or lacking Erv29. ERV29 wild-type and erv29Δ strains expressing ESCargo were grown overnight to mid–log phase and then imaged by confocal and brightfield microscopy. SLF was added at time zero to a final concentration of 100 µM. Average projected Z-stacks are taken from Supplemental Movie S1. Scale bar, 2 µm. (D) Quantification of the intracellular ESCargo fluorescence from the cells in C. At each time point, the brightfield image was used to select the cell profile and quantify the total ESCargo fluorescence. Each fluorescence trace was normalized to the average of the three highest fluorescence signals in that trace. (E) Average intracellular ESCargo fluorescence. For each of the two strains, signals were measured from at least eight cells from three movies, and the traces normalized as in D were averaged. Error ranges represent SEM. (F) Detecting secretion of ESCargo into the medium by immunoblotting. The strains imaged in C were grown overnight in rich medium and then washed and resuspended in fresh medium to the same optical density. SLF was then added to a final concentration of 100 µM to dissolve the ESCargo aggregates. After the indicated times, secreted ESCargo was precipitated from the culture medium, subjected to endoglycosidase H treatment to trim N-glycans, and analyzed by immunoblotting with an anti-FKBP antibody. A representative result is shown. Based on reference markers, the detected band had an apparent molecular weight of ∼37 kDa, close to the predicted molecular weight of 38.3 kDa.
FIGURE 2:
FIGURE 2:
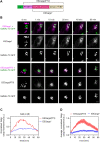
Traffic of ESCargo variants in cultured mammalian cells. (A) Functional segments of the ESCargo(FTV) and ESCargo* constructs. pIgH (green): mammalian ER signal sequence. FTVNTT (pink): tripeptide ER export signal followed by tripeptide N-linked glycosylation signal. For further details, see Figure 1A. (B) Comparison of the bulk flow ESCargo* variant with signal-containing ESCargo(FTV). Flp-In 293 T-REx cells stably expressing the Golgi marker GalNAc-T2-GFP were grown on confocal dishes and transfected with expression constructs for ESCargo* (top) or ESCargo(FTV) (bottom) 24–48 h before confocal imaging. Following cycloheximide treatment, SLF was added at time zero to a final concentration of 50 µM. For each cargo variant, the top row shows the merged images while the other two rows show the red and green channels. Average projected Z-stacks were taken from the first part of Supplemental Movie S2. Scale bar, 5 μm. (C) Quantification of Golgi-associated cargo fluorescence for the cells in B. The GalNAc-T2-GFP signal was used to create masks to quantify the Golgi-associated fluorescence in the cargo channel. (D) Quantification was performed as in C to generate averaged time courses, using at least seven cells from six movies for each variant. Error ranges represent SEM.
FIGURE 3:
FIGURE 3:
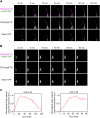
Traffic of ESCargo(FTV) in rat cortical neurons. Isolated neurons were cultured for 15 d in vitro and were transfected with constructs encoding ManII-GFP and ESCargo(FTV) 48 h before imaging. SLF was added at time zero to a final concentration of 50 µM. For each of two representative cells, the top row shows the merged images while the other two rows show the red and green channels. Average projected Z-stacks were taken from the second part of Supplemental Movie S2. (A) Example of a neuron with a long tubular extension from the somatic Golgi into a dendrite. Two Golgi outposts were initially visible, and the tubule progressively fragmented to create additional Golgi outposts. Scale bar, 10 μm. (B) Example of a neuron that initially contained multiple punctate Golgi outposts. Scale bar, 10 µm. (C) Quantification of Golgi outpost-associated cargo fluorescence in the cells in A and B. The ManII-GFP signal was used to create masks to quantify the Golgi outpost-associated fluorescence in the cargo channel.
FIGURE 4:
FIGURE 4:
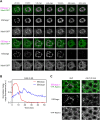
Traffic of ESCargo variants in Drosophila melanogaster. (A) Comparison of the bulk flow ESCargo* variant with signal-containing ESCargo in Drosophila S2 cells. Cells were transfected with Ubi-GAL4, pUASt-ManII-eGFP, and either pUASt-ssBiP-ESCargo* (top) or pUASt-ssBiP-ESCargo (bottom). After 3–4 d, the cells were adhered to ConA-coated dishes for 30 min before confocal imaging. SLF was added at time zero to a final concentration of 50 μM. For each cargo variant, the top row shows the merged images while the other two rows show the red and green channels. Average projected Z-stacks were taken from Supplemental Movie S3. Scale bar, 5 μm. (B) Quantification of Golgi-associated cargo fluorescence for the cells in A. The ManII-GFP signal was used to create masks to quantify the Golgi-associated fluorescence in the cargo channel. (C) Colocalization of ESCargo with the Golgi in Drosophila egg chamber follicular epithelial cells. Egg chambers from a Drosophila line (w; traffic jam-Gal4/+; UASt-ssBiP-ESCargo/UASp-YFP-Rab10) expressing ESCargo and YFP-Rab10 were fixed before and 5 min after introducing 50 μM SLF. Shown are average projections of the central four slices from confocal Z-stacks. The top row shows the merged images while the other two rows show the red and green channels. Scale bar, 5 μm.
FIGURE 5:
FIGURE 5:
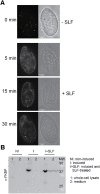
Traffic of ESCargo* in T. thermophila. (A) Confocal cross-sections of fixed Tetrahymena cells expressing ER-targeted ESCargo*, with paired differential interference contrast images. Protein expression was induced with CdCl2 before the addition of 12.5 µM SLF. The top panel shows cells fixed immediately after SLF addition (0 min), and the other panels show cells fixed after treatment with SLF for 5, 15, or 30 min. The fluorescence exposure times were 100 ms for the 0 min image or 400 ms for the other images. Bright fluorescent puncta were visible initially but disappeared within 5 min after SLF addition, resulting in dispersed fluorescence in ER-like membranes that included the nuclear envelope. By 30 min, some punctate fluorescence had reappeared. Scale bars, 10 μm. (B) Immunoblot analysis of ESCargo* secretion. Tetrahymena cells expressing ESCargo* were treated with 12.5 μM SLF for 5 min. After centrifugation, TCA-precipitated cell pellet and cell-free culture medium samples were analyzed by SDS–PAGE and immunoblotting with anti-FBKP antibody. The cargo protein was detected in whole cell lysates for induced untreated and induced SLF-treated cells and in the medium only for induced SLF-treated cells. No cargo protein was detected in noninduced cells. A representative result is shown.

Similar articles

Cited by

References

    1. Barlowe C, Helenius A (2016). Cargo capture and bulk flow in the early secretory pathway. Annu Rev Cell Dev Biol 32, 197–222. - PubMed
    1. Barrero JJ, Papanikou E, Casler JC, Day KJ, Glick BS (2016). An improved reversibly dimerizing mutant of the FK506-binding protein FKBP. Cell Logist 6, e1204848. - PMC - PubMed
    1. Bevis BJ, Hammond AT, Reinke CA, Glick BS (2002). De novo formation of transitional ER sites and Golgi structures in Pichia pastoris . Nat Cell Biol 4, 750–756. - PubMed
    1. Boncompain G, Divoux S, Gareil N, de Forges H, Lescure A, Latreche L, Mercanti V, Jollivet F, Raposo G, Perez F (2012). Synchronization of secretory protein traffic in populations of cells. Nat Methods 9, 493–498. - PubMed
    1. Boncompain G, Perez F (2013). Fluorescence-based analysis of trafficking in mammalian cells. Methods Cell Biol 118, 179–194. - PubMed

Publication types