. 2021 Apr;68(4):1131-1143.
doi: 10.1109/TUFFC.2020.3034518. Epub 2021 Mar 26.

Resolution and Speckle Reduction in Cardiac Imaging

Resolution and Speckle Reduction in Cardiac Imaging

Nick Bottenus et al. IEEE Trans Ultrason Ferroelectr Freq Control. 2021 Apr.

Abstract

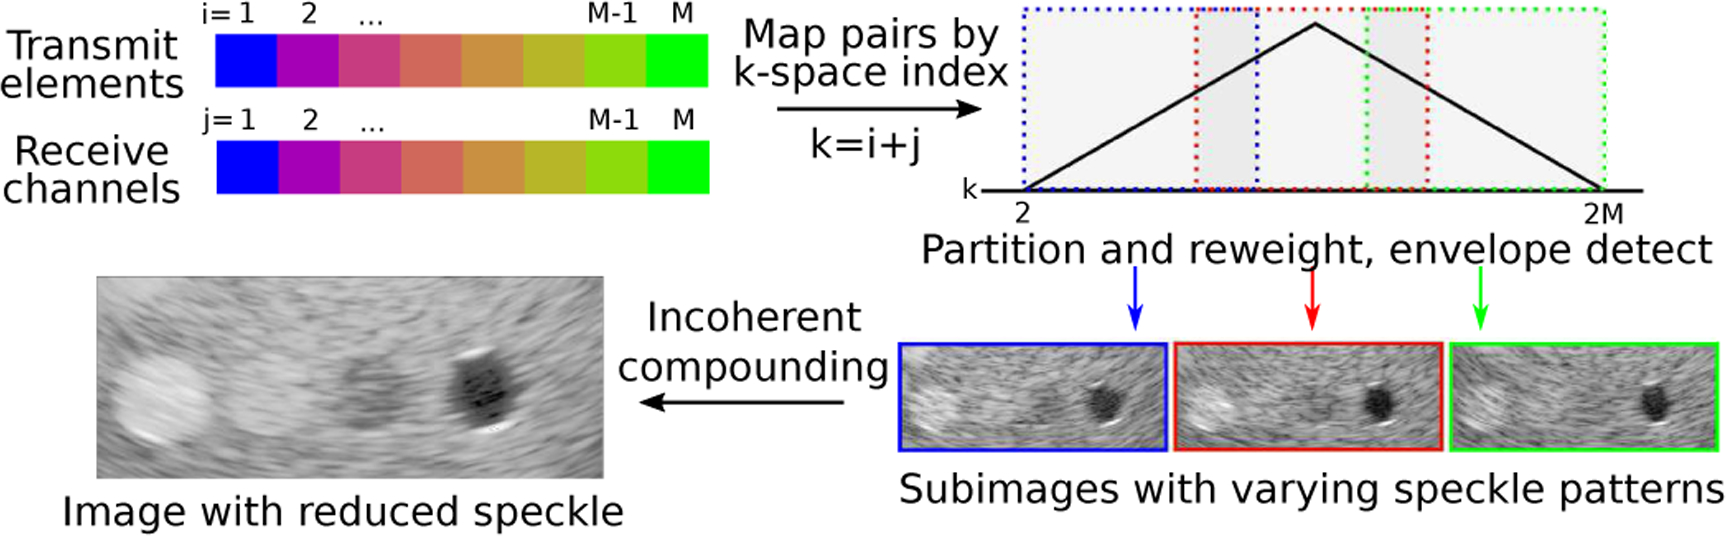
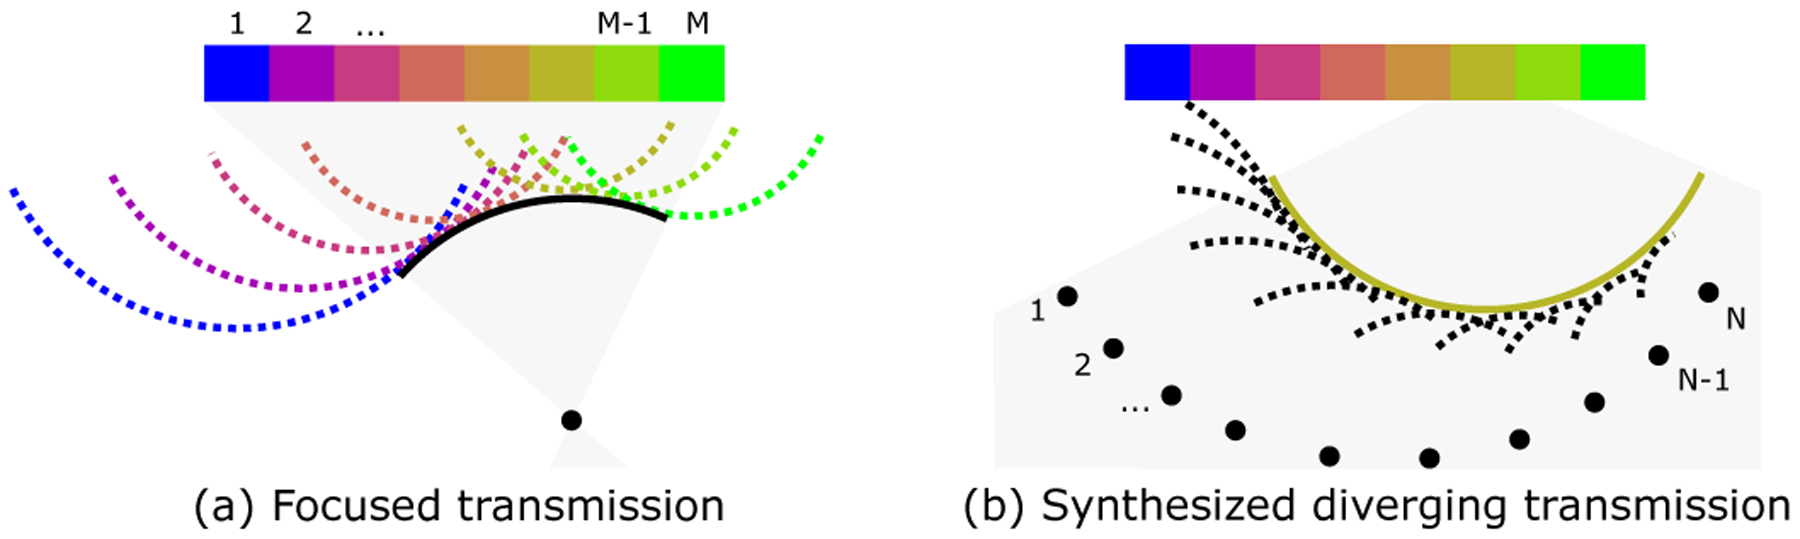
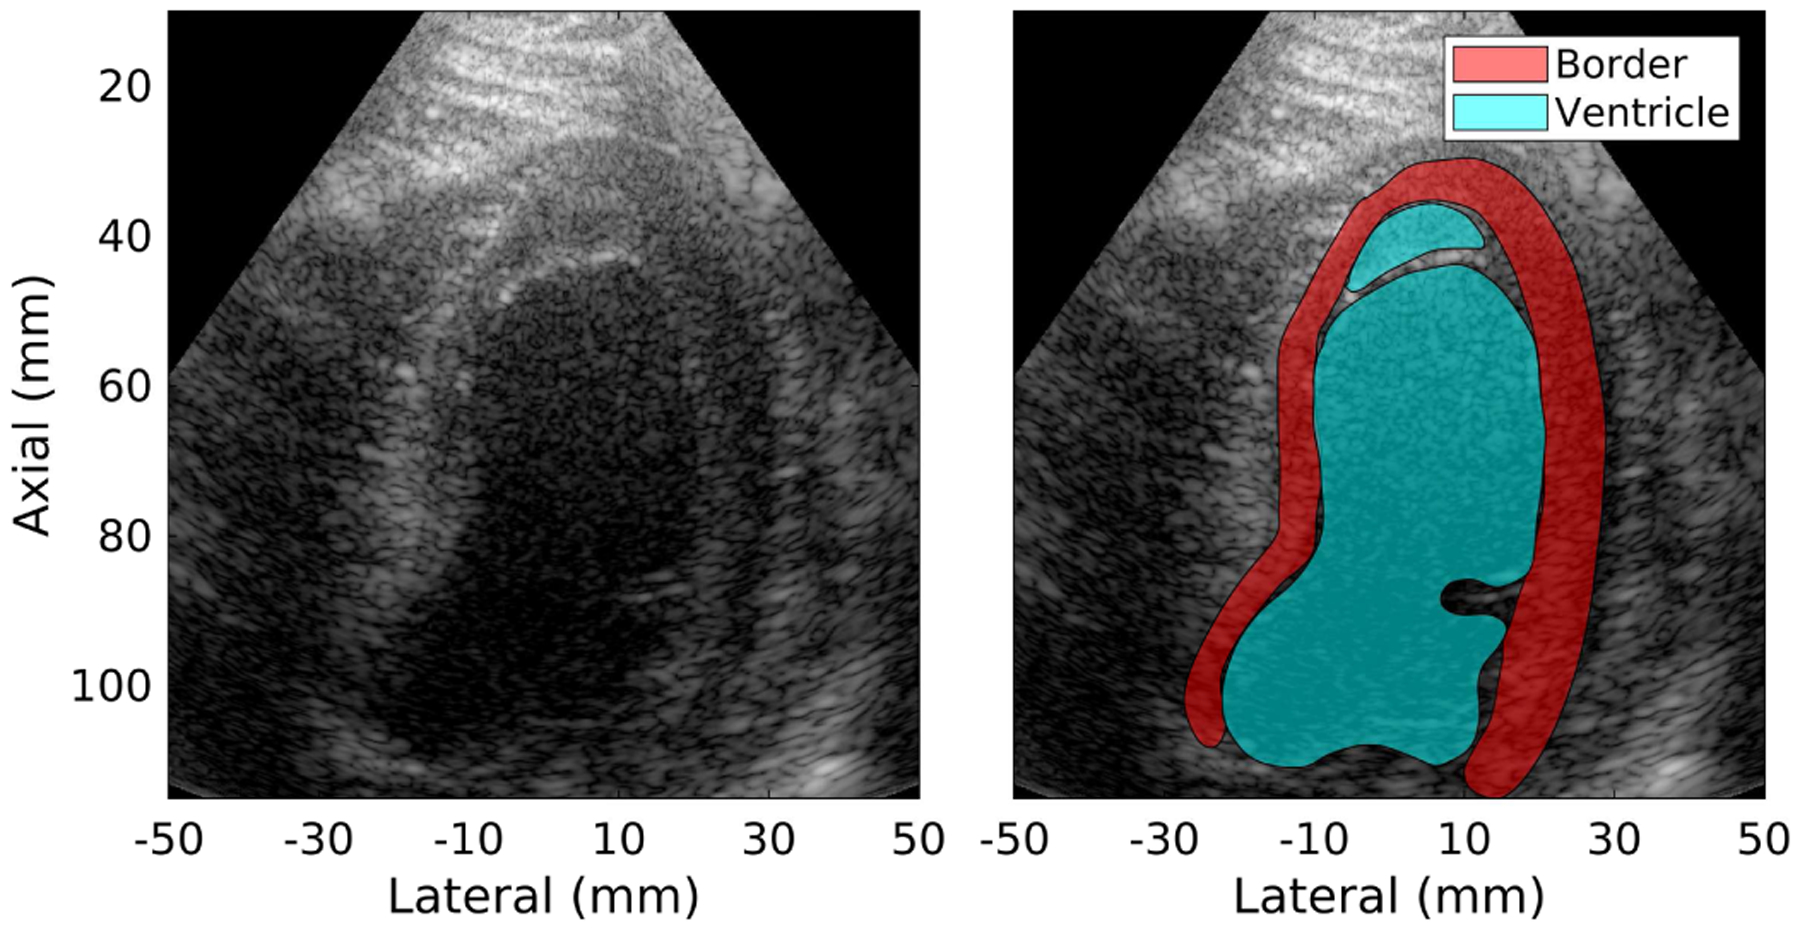
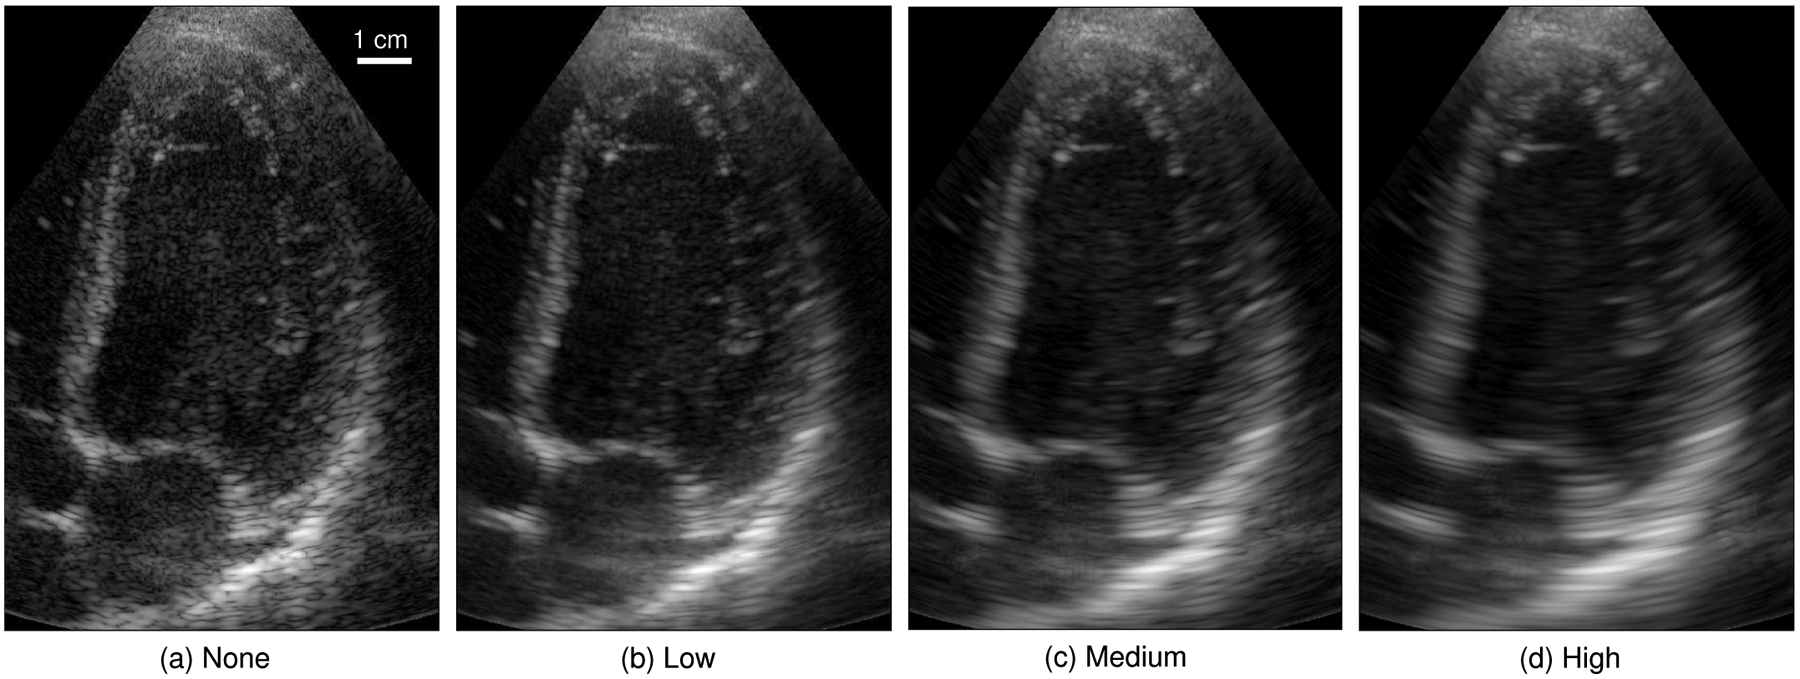
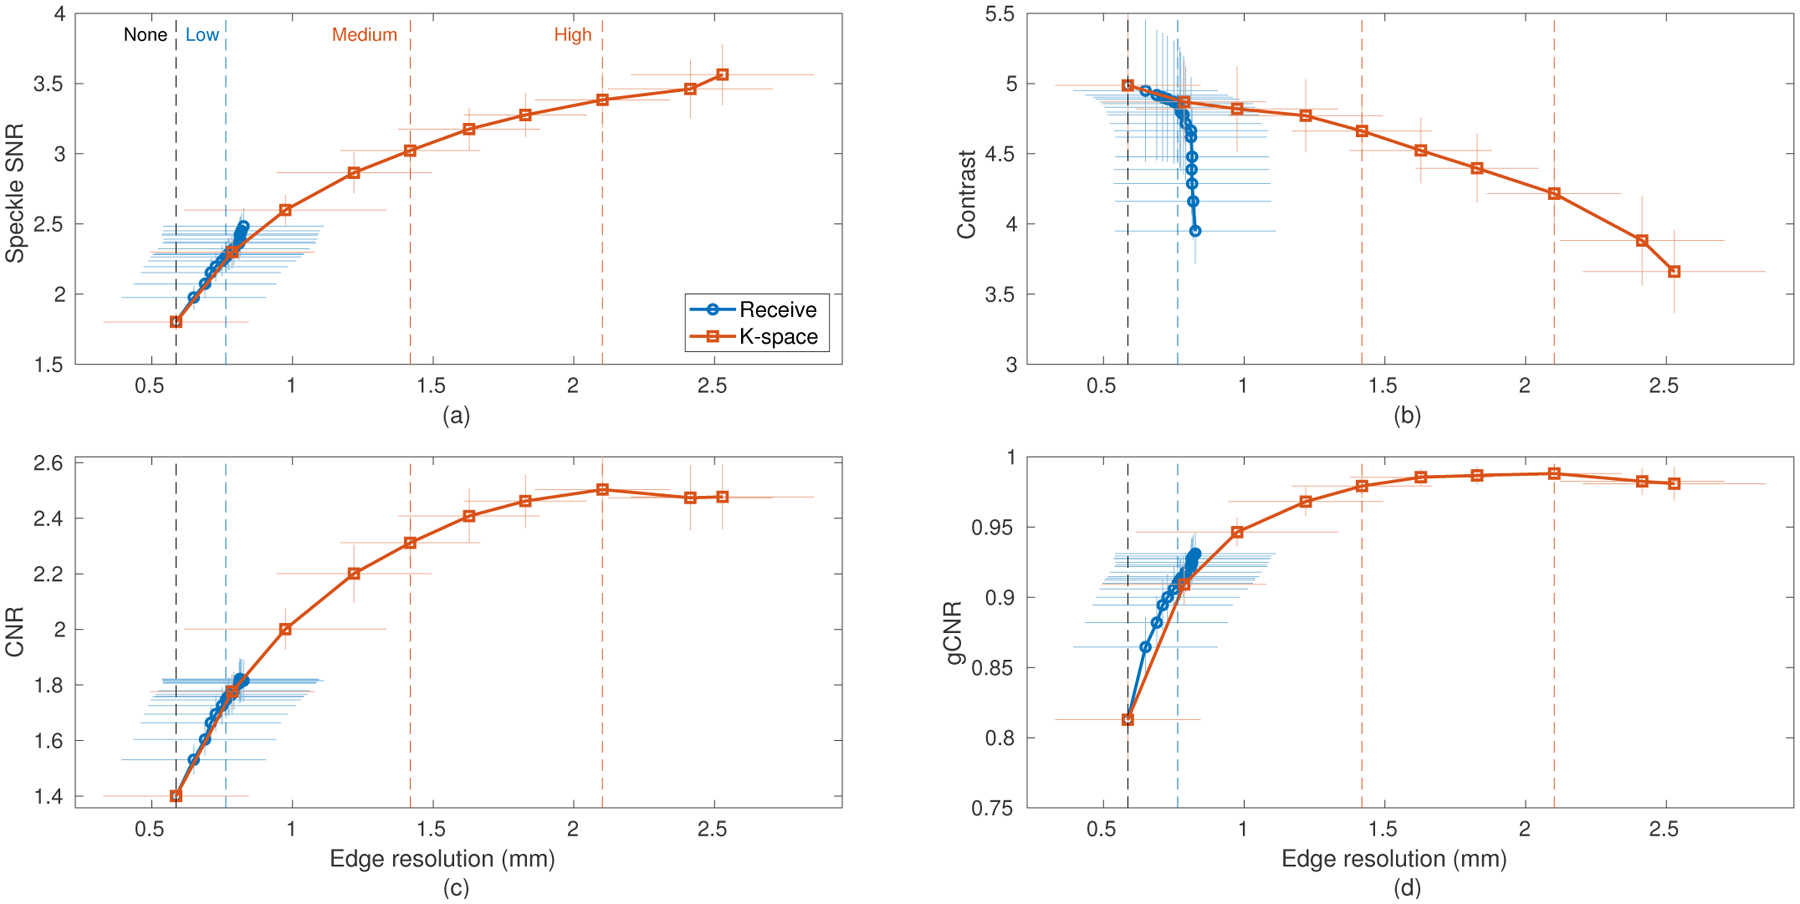
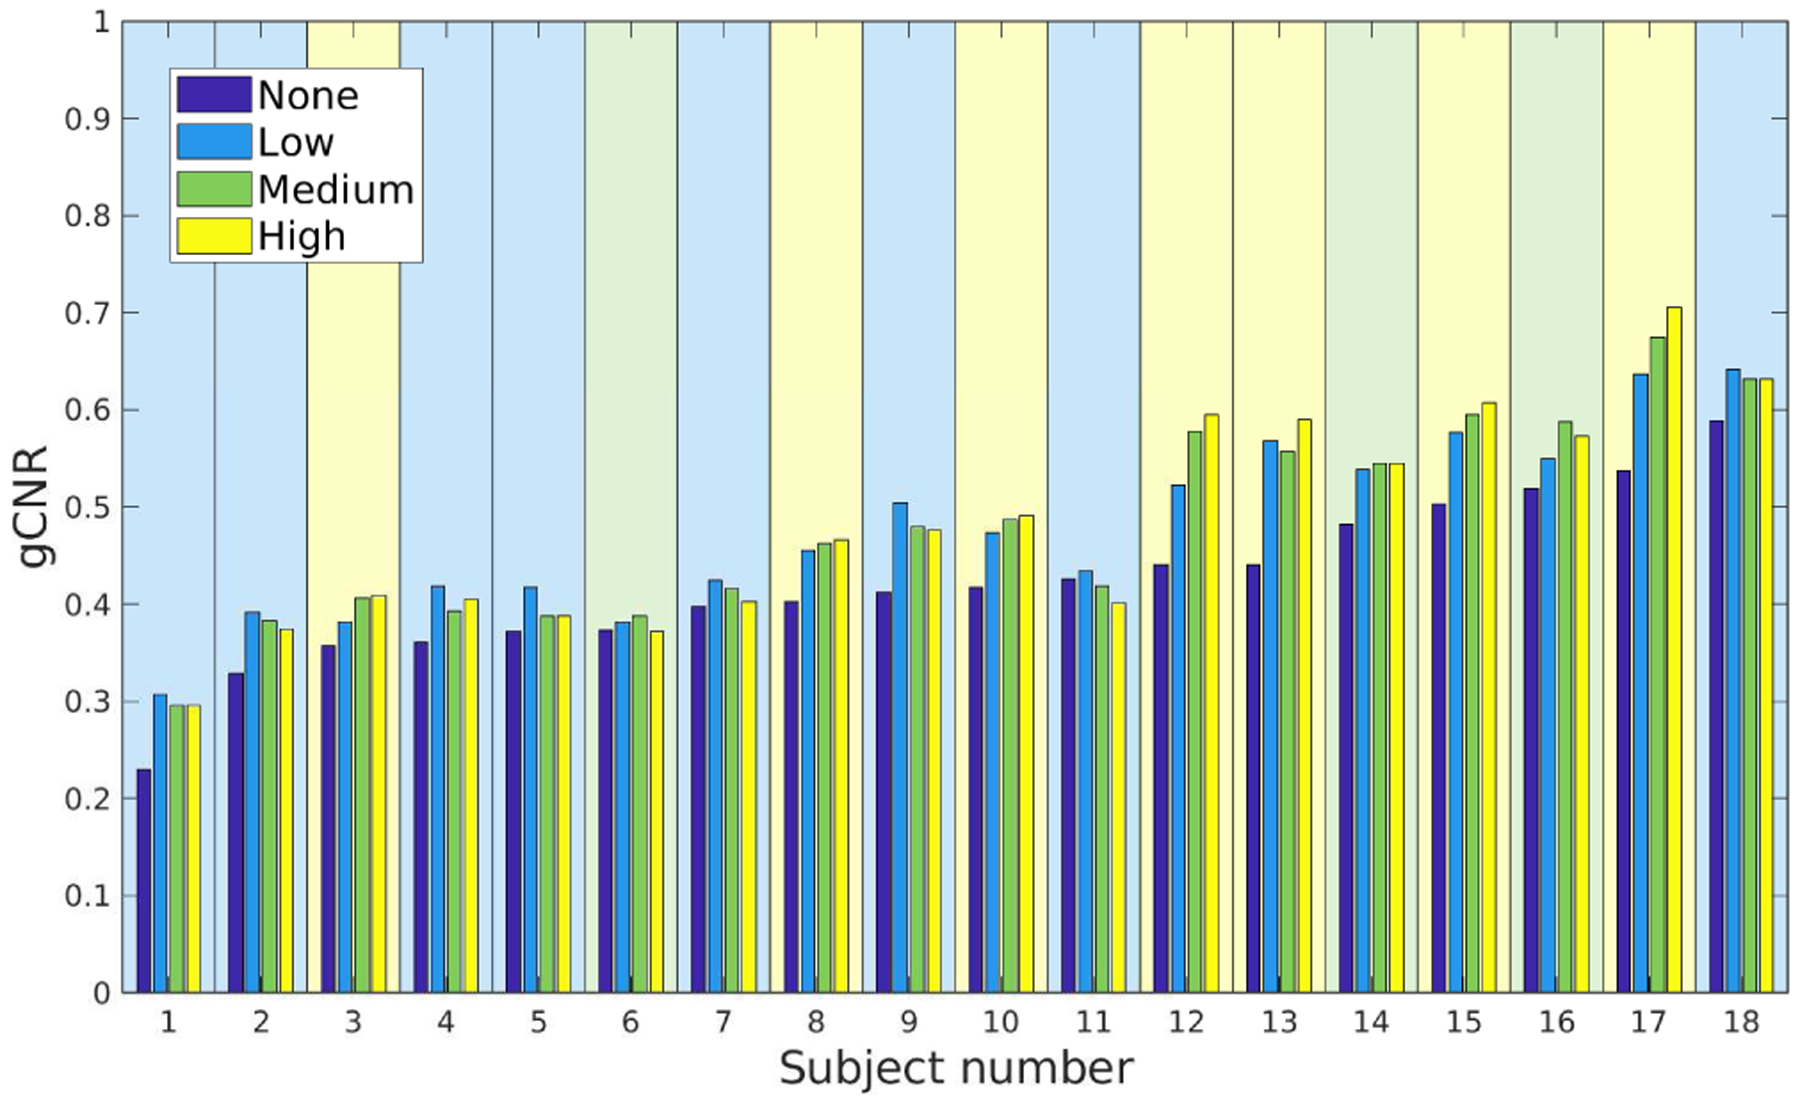
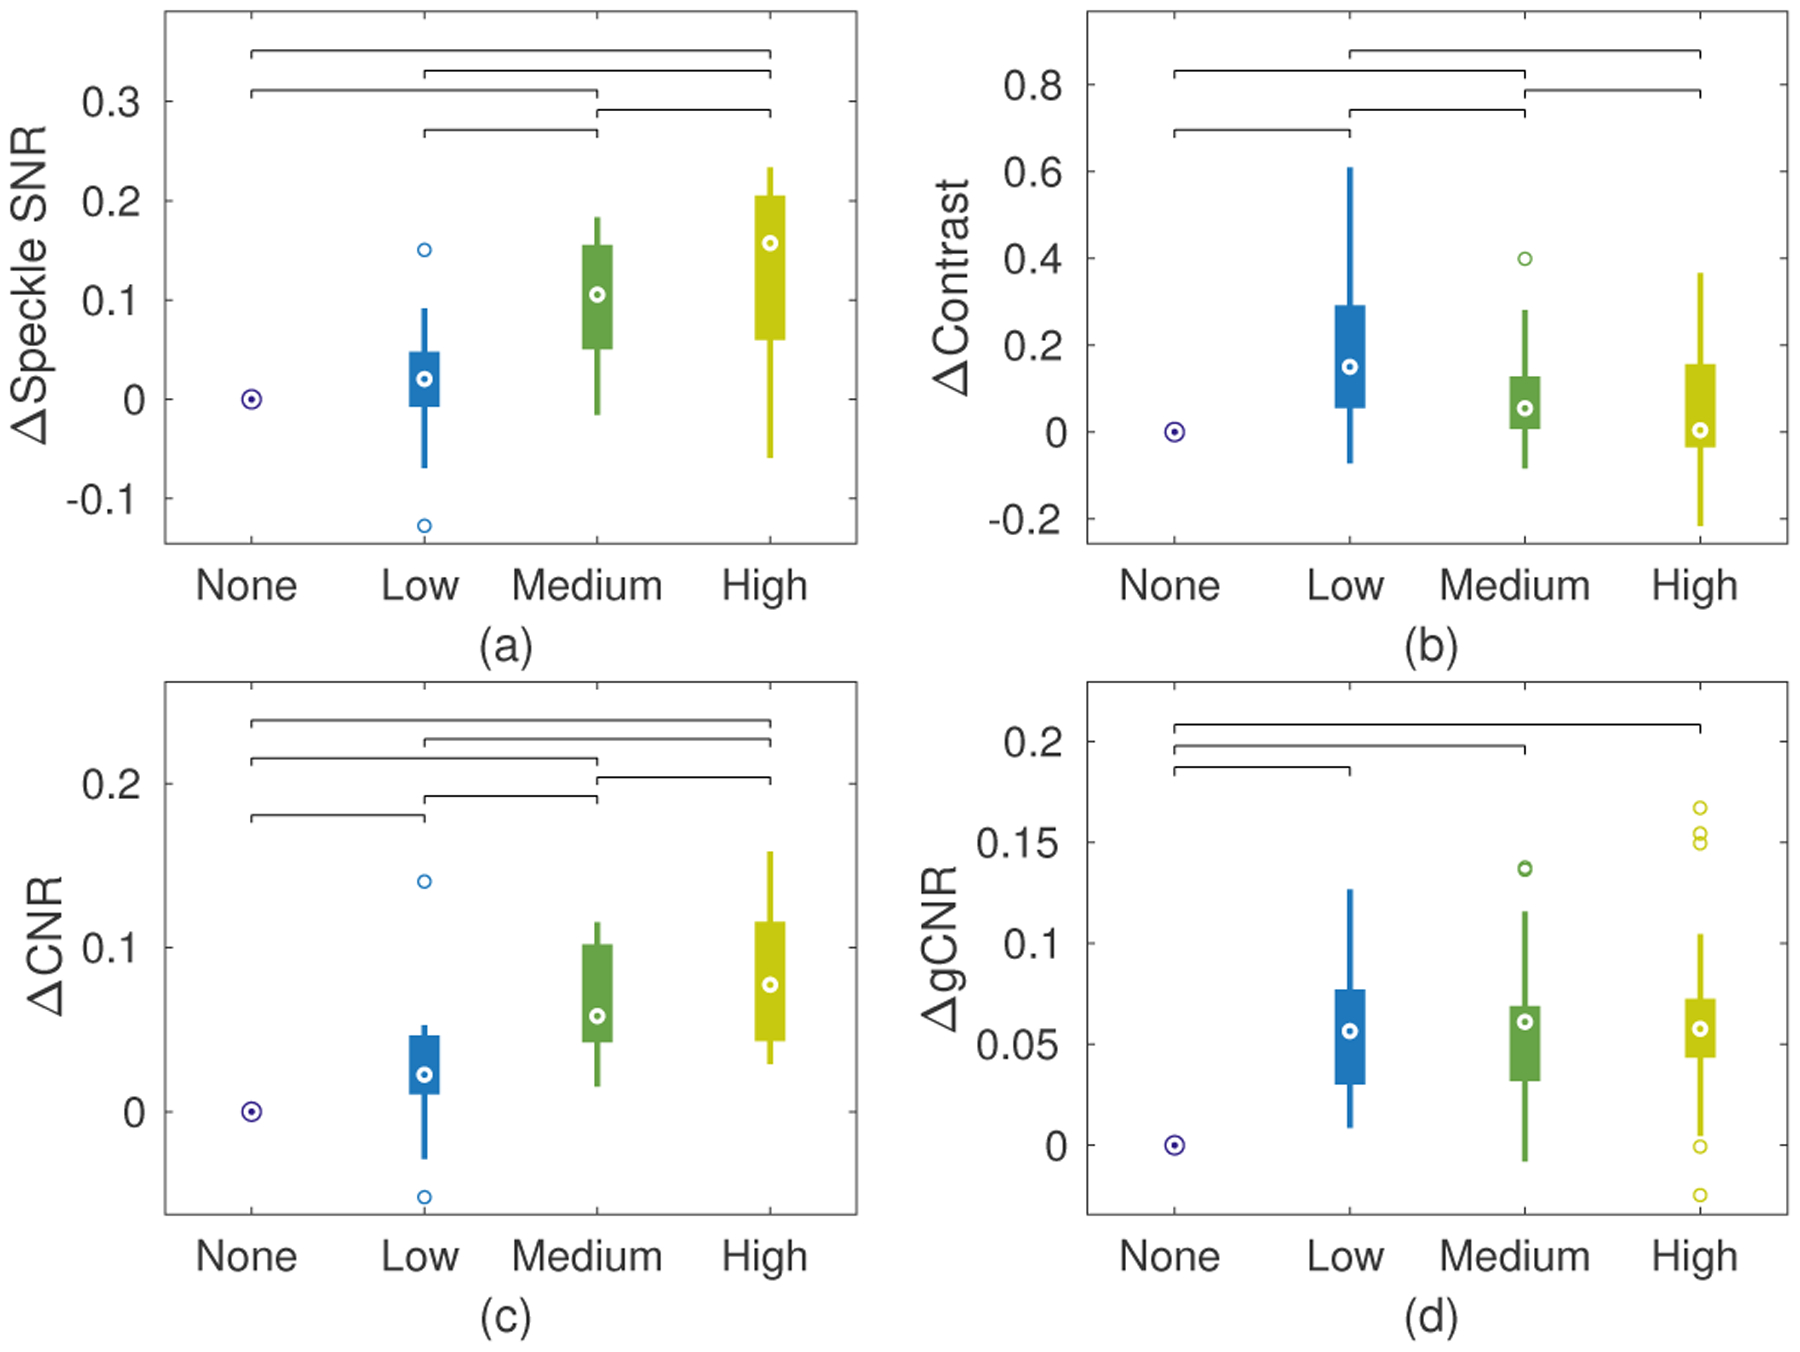
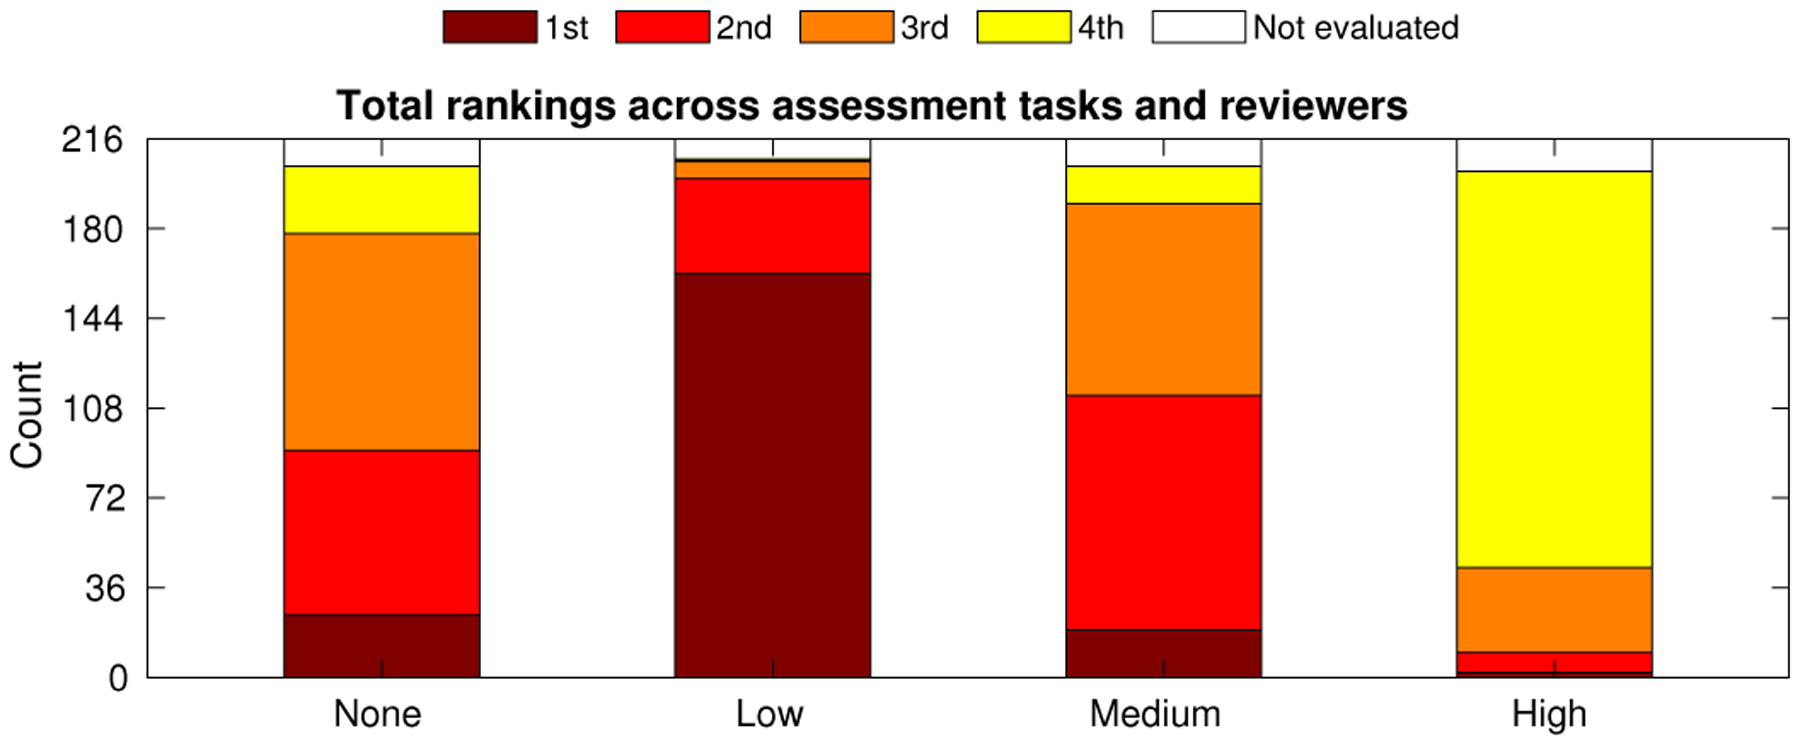
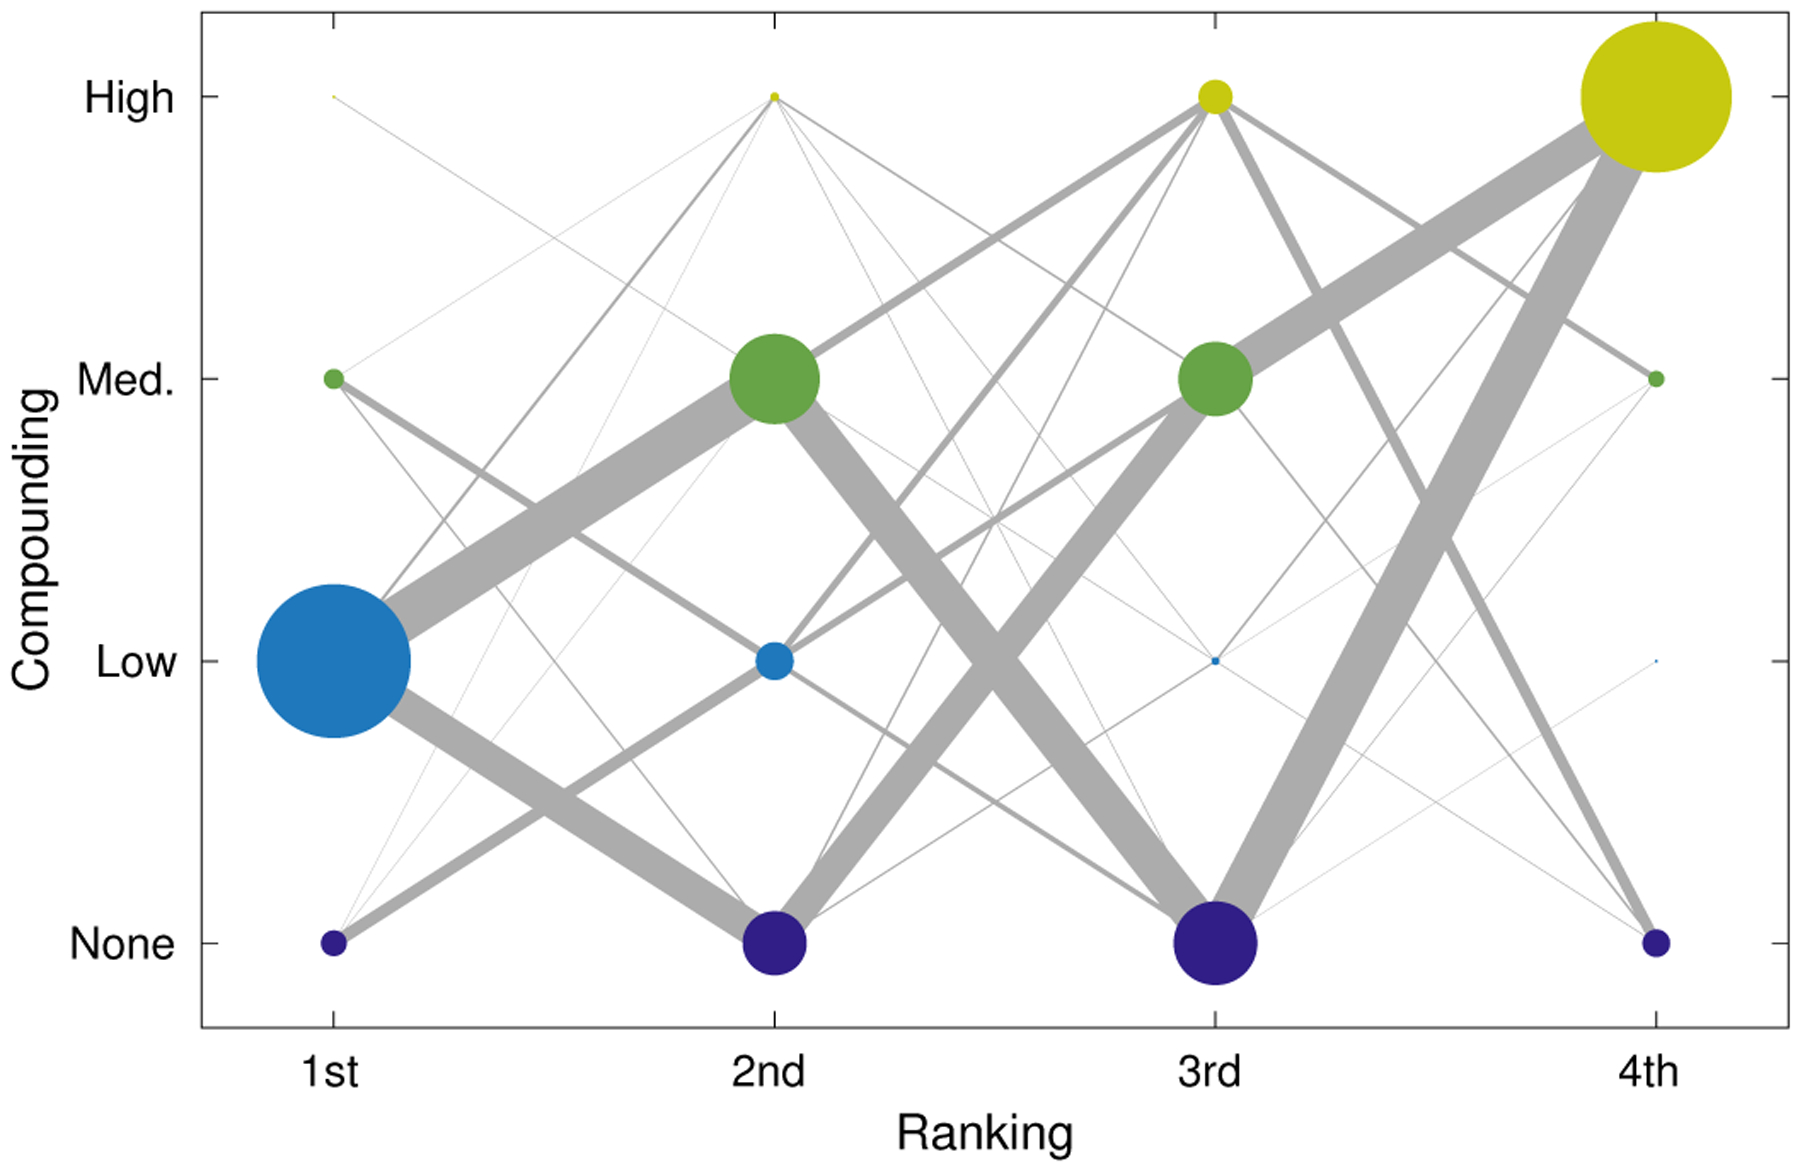
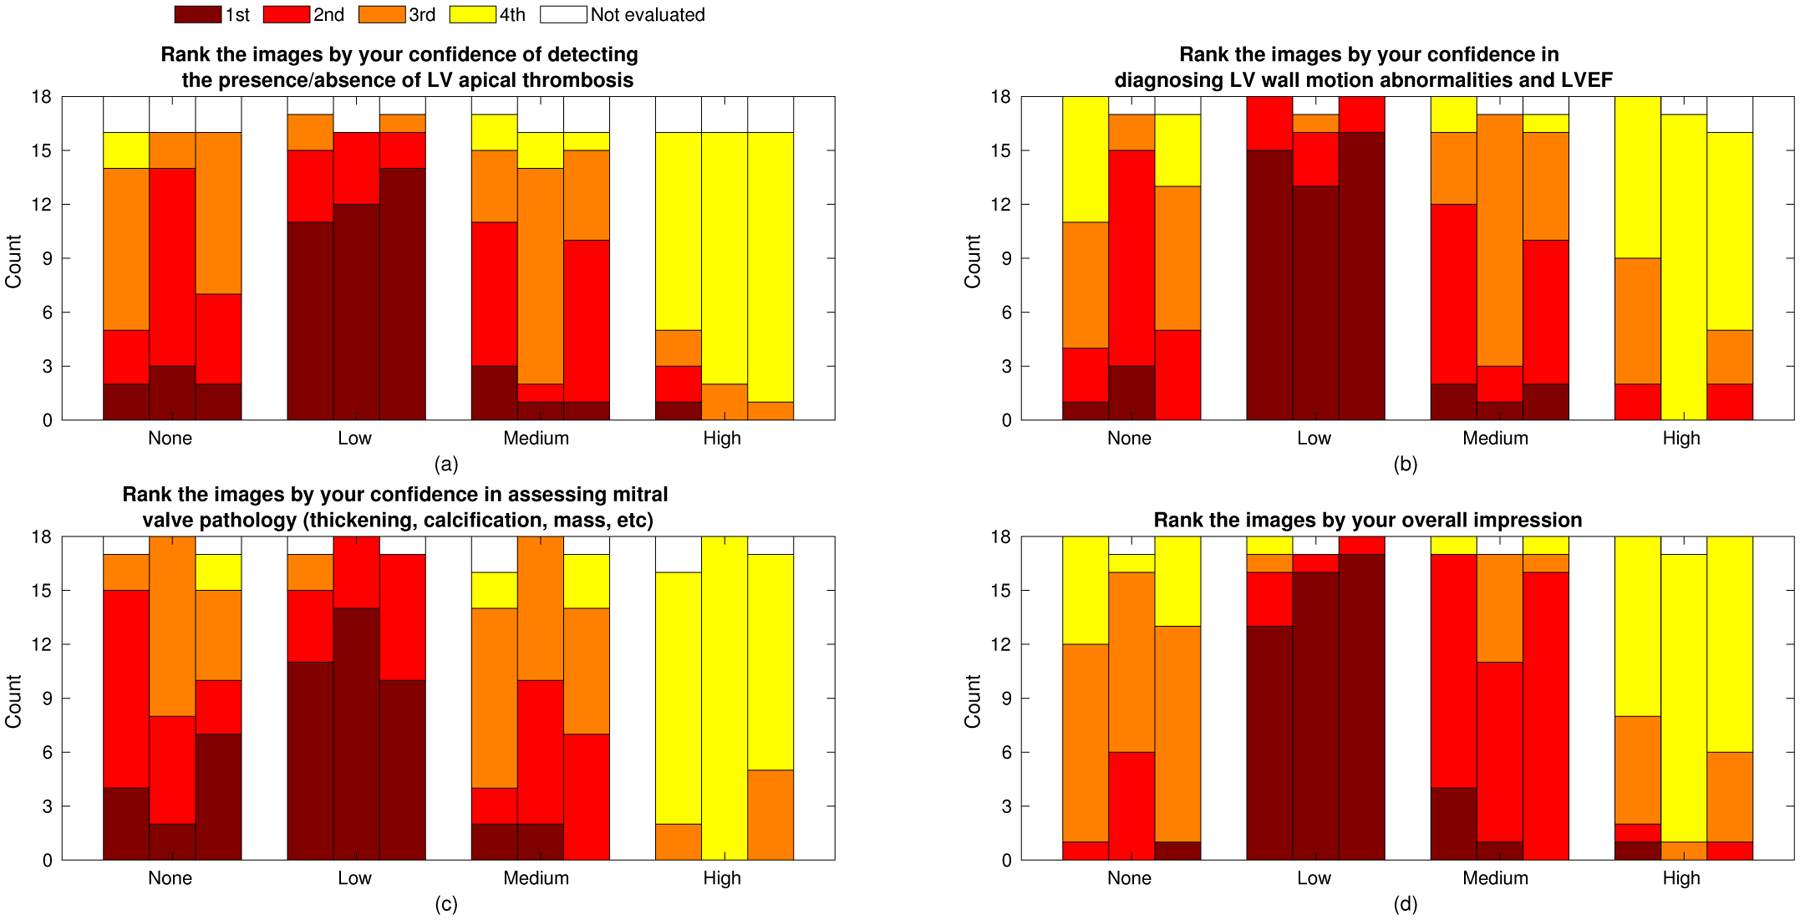
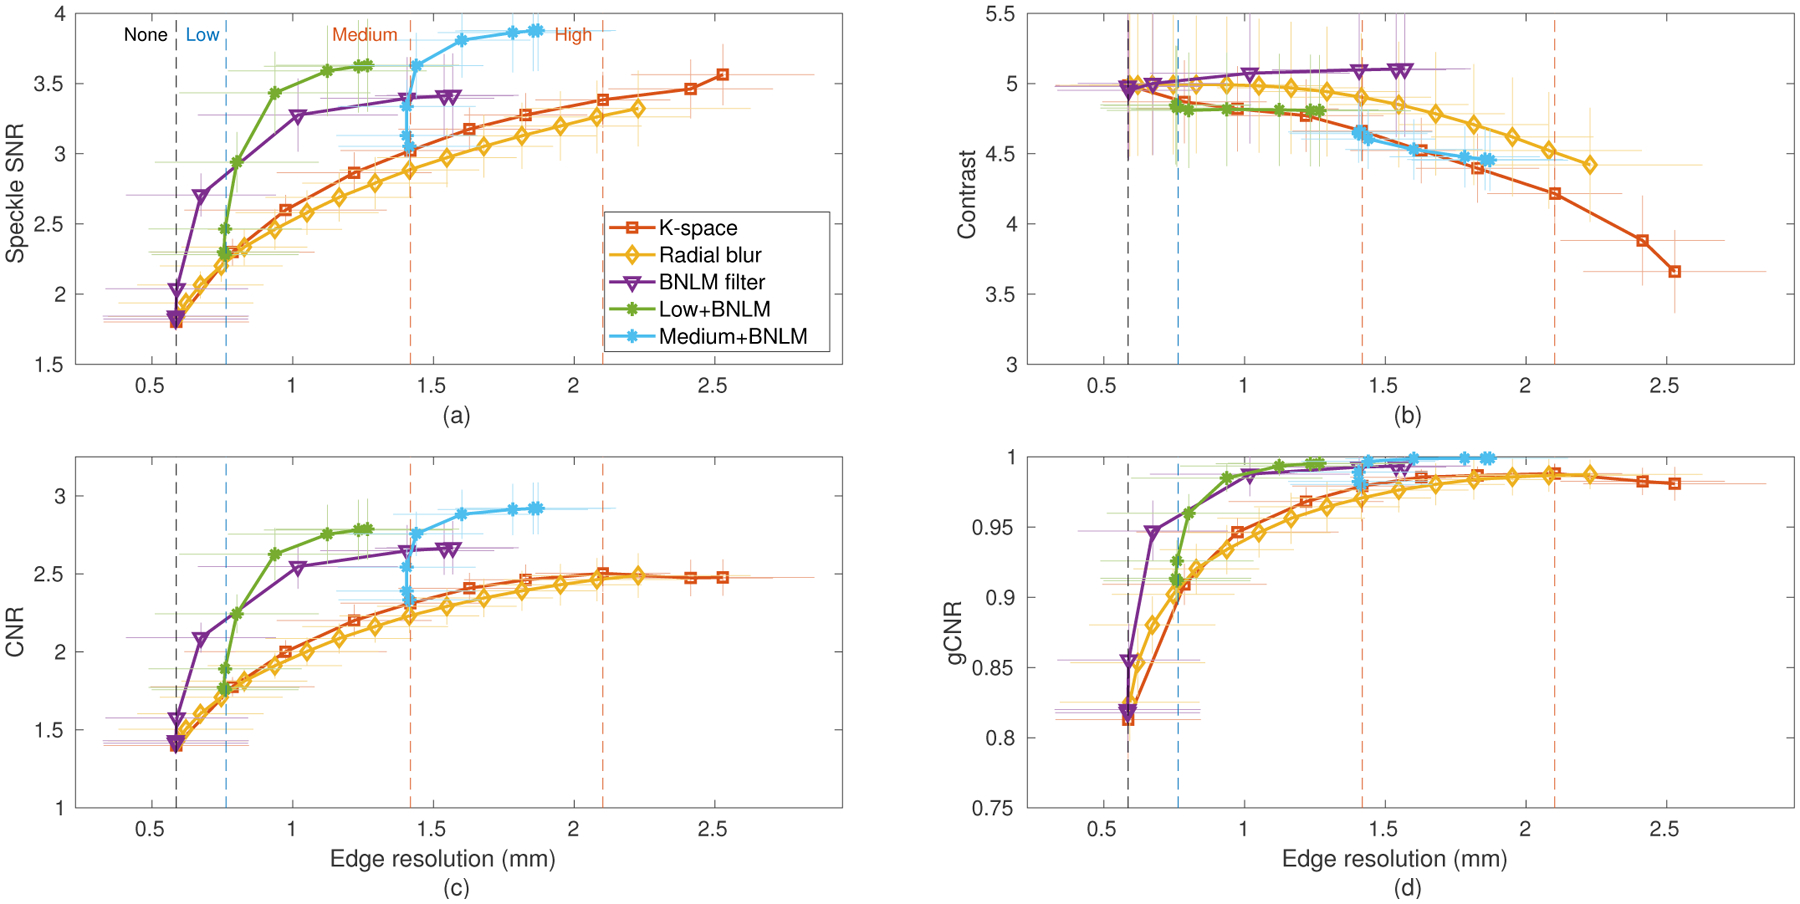
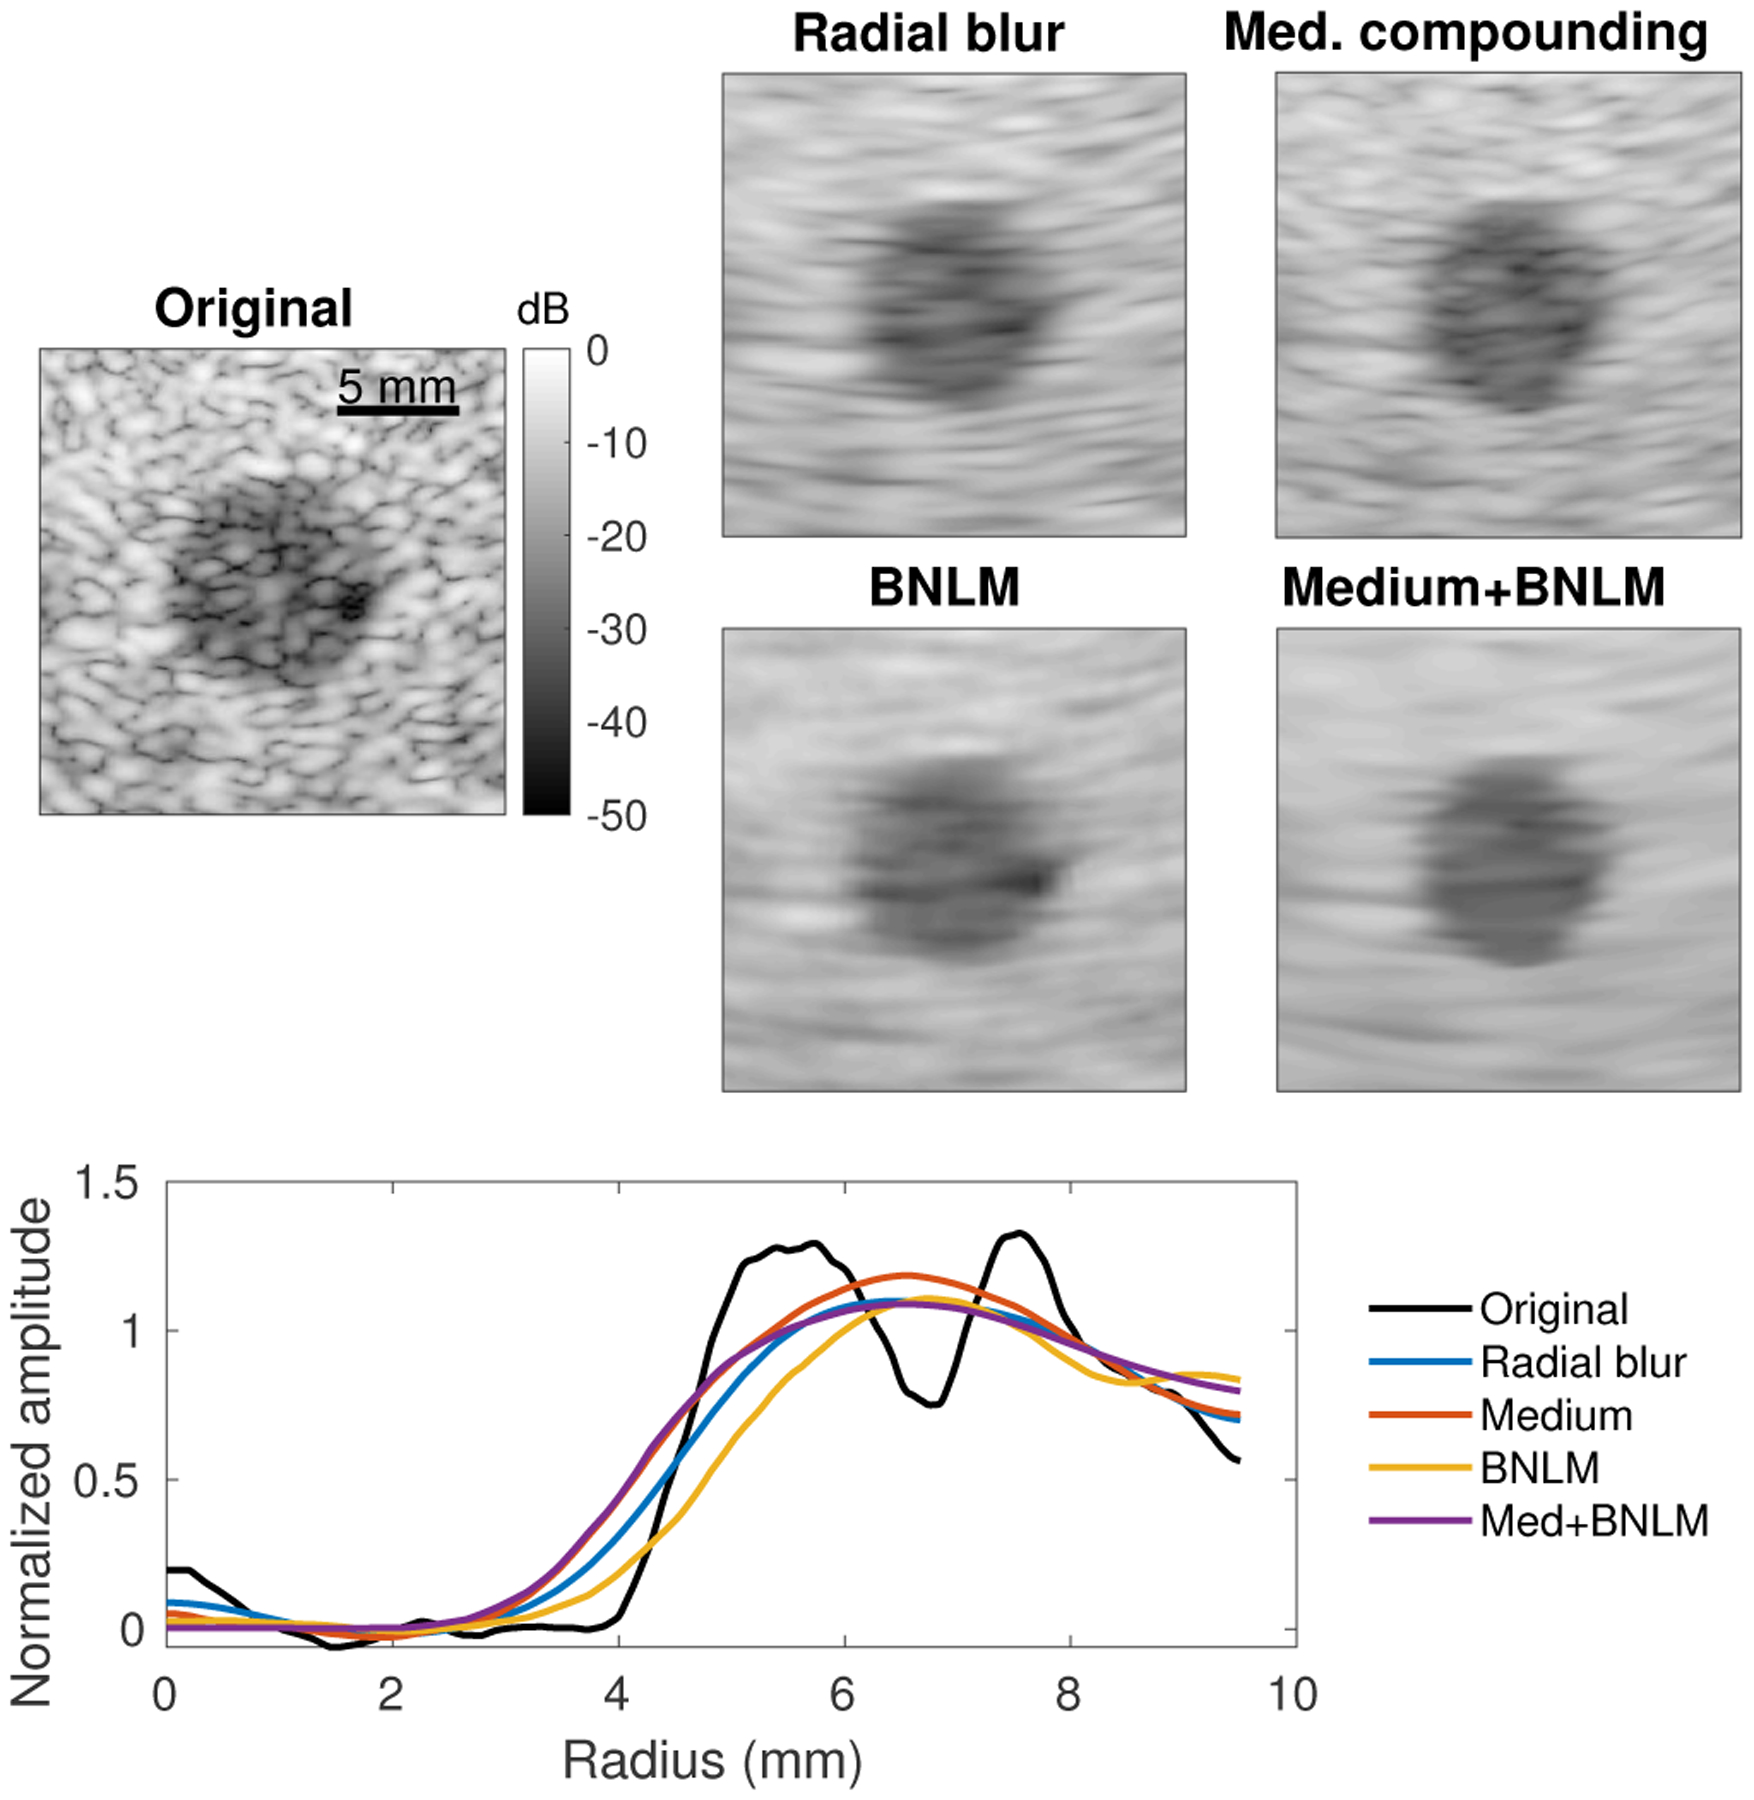
Cardiac imaging depends on clear visualization of several different structural and functional components to determine left ventricular and overall cardiac health. Ultrasound imaging is confounded by the characteristic speckle texture resulting from subwavelength scatterers in tissues, which is similar to a multiplicative noise on underlying tissue structure. Reduction of this texture can be achieved through physical means, such as spatial or frequency compounding, or through adaptive image processing. Techniques in both categories require a tradeoff of resolution for speckle texture reduction, which together contribute to overall image quality and diagnostic value. We evaluate this tradeoff for cardiac imaging tasks using spatial compounding as an exemplary speckle reduction method. Spatial compounding averages the decorrelated speckle patterns formed by views of a target from multiple subaperture positions to reduce the texture at the expense of active aperture size (and, in turn, lateral resolution). We demonstrate the use of a novel synthetic aperture focusing technique to decompose harmonic backscattered data from focused beams to their aperture-domain spatial frequency components to enable combined transmit and receive compounding. This tool allows the evaluation of matched data sets from a single acquisition over a wide range of spatial compounding conditions. We quantified the tradeoff between resolution and texture reduction in an imaging phantom and demonstrated improved lesion detectability with increasing levels of spatial compounding. We performed a cardiac ultrasound on 25 subjects to evaluate the degree of compounding useful for diagnostic imaging. Of these, 18 subjects were included in both qualitative and quantitative analysis. We found that compounding improved detectability of the endocardial border according to the generalized contrast-to-noise ratio in all cases, and more aggressive compounding made further improvements in ten out of 18 cases. Three expert reviewers evaluated the images for their usefulness in several diagnostic tasks and ranked four compounding conditions ("none," "low," "medium," and "high"). Contrary to the quantitative metrics that suggested the use of high levels of compounding, the reviewers determined that "low" was usually preferred (77.9%), while "none" or "medium" was selected in 21.2% of cases. We conclude with a brief discussion of the generalization of these results to other speckle reduction methods using the imaging phantom data.


Figures

Fig. 1.
Fig. 1.
K-space compounding. (from top left, clockwise) Individual element data are focused and combined according to their k-space index – the sum of their transmit and receive array positions. K-space is partitioned into overlapping regions, each of which forms a low resolution subimage. Subimages are incoherently combined by averaging envelope data to produce an image with reduced texture and improved detectability.
Fig. 2.
Fig. 2.
REFoCUS beamforming. (a) Focused transmission from M elements. Array elements produce individual diverging waves delayed to form a coherent converging wavefront. (b) One sample diverging wave synthesized by REFoCUS using N transmissions, coherently reinforcing the desired component from different focused waves by applying time delays to the recorded data.
Fig. 3.
Fig. 3.
To measure edge resolution in phantom imaging, (left) radial lines from the center of the lesion were averaged over ±10° from lateral. (right) The radial average was normalized by the mean values inside and outside the lesion, and resolution was defined by the 20–80% rise distance.
Fig. 4.
Fig. 4.
(left) Sample B-mode image for subject 11. (right) Regions of interest – LV endocardial border and chamber of the LV – drawn by an experienced sonographer using the B-mode image. ROIs may contain multiple sections as necessary, in this example excluding a visible chord.
Fig. 5.
Fig. 5.
Sample cardiac frame from subject 12 across the four selected compounding conditions. For each subject, all 90 image frames were processed and shown as a 3 second (real-time) video clip. The mean and standard deviation of each image were normalized to match a reference frame in order to reduce the visual impact of differences in normalization and grayscale mapping between frames and compounding conditions.
Fig. 6.
Fig. 6.
Experimental data of a −15 dB lesion phantom demonstrating the resolution-image quality trade-off produced by spatial compounding using both receive and k-space compounding with varying numbers of subapertures. Horizontal and vertical error bars are drawn to represent one standard deviation (N=10). The four imaging conditions used in the cardiac study are labeled by vertical dashed lines. (a) Speckle SNR, (b) Contrast, (c) CNR, and (d) gCNR plotted against edge resolution. Increased compounding (larger edge resolution) corresponds to reduced speckle texture and increased target detectability, but lower contrast.
Fig. 7.
Fig. 7.
Detectability of LV endocardial border versus chamber of the LV measured by gCNR across subjects and compounding conditions. The background of each subject is shaded to reflect the best-performing compounding condition (“None”: 0, “Low”: 8, “Medium”: 3, “High”: 7). Subjects were sorted from lowest to highest gCNR in the “None” case.
Fig. 8.
Fig. 8.
Paired data boxplots of image quality metrics from LV endocardial border and chamber of the LV: (a) speckle SNR, (b) contrast, (c) CNR, and (d) gCNR. Data are presented relative to the “None” condition by subtracting each set of paired data points. Brackets between conditions represent statistical significance (p<.05) using a paired t-test.
Fig. 9.
Fig. 9.
Expert reviewer ranked preferences of compounding conditions tabulated across all four cardiac assessment tasks and three reviewers. Counts for each bar are found in Table II.
Fig. 10.
Fig. 10.
Weighted graph showing ordering of preferences across all tasks and reviewers. Marker size indicates relative frequency of a ranking for a particular compounding condition and matches the counts provided in Table II. Edges between markers represent a sequential ranking of two compounding conditions and the thickness of the line indicates relative frequency of the ordering. For example, reviewers most commonly selected “Low” first and approximately equally selected “Medium” and “None” second.
Fig. 11.
Fig. 11.
Expert reviewer ranked preferences for the four individual assessment tasks. Adjoining bars represent the independent rankings of three reviewers (order maintained across graphs). The sum of counts across the three reviewers and four tasks is given in Table II.
Fig. 12.
Fig. 12.
Comparison of the resolution-image quality trade-off of radial blur and Bayesian nonlocal means image processing against spatial compounding using the data of Fig. 6. The Bayesian nonlocal means (BNLM) filter was also combined with the “Low” receive compounding and “Medium” k-space compounding configurations using various values of the smoothing parameter.
Fig. 13.
Fig. 13.
Comparison of spatial compounding and image processing (radial blur, BNLM filter) of a −15 dB lesion phantom. All texture reduction methods were tuned to produce an edge resolution of approximately 1.3 mm (equivalent to the “Medium” compounding case) and images are displayed with matched background and lesion means (matched contrast). Edge resolution for each is plotted as in Fig. 3.

References

    1. Chengode S, “Left ventricular global systolic function assessment by echocardiography,” Annals of Cardiac Anaesthesia, vol. 19, no. 5, pp. S26–S34, 2016. - PMC - PubMed
    1. Chirillo F, “Impact of harmonic imaging on transthoracic echocardiographic identification of infective endocarditis and its complications,” Heart, vol. 91, no. 3, pp. 329–333, 2005. - PMC - PubMed
    1. Wagner R, Smith S, Sandrik J, and Lopez H, “Statistics of Speckle in Ultrasound B-Scans,” IEEE Transactions on Sonics and Ultrasonics, vol. 30, no. 3, pp. 156–163, 1983.
    1. Smith SW, Wagner RF, Sandrik JM, and Lopez H, “Low contrast detectability and contrast/detail analysis in medical ultrasound,” IEEE Transactions on Sonics and Ultrasonics, vol. 3, no. 3, pp. 164–173, 1983.
    1. Massay RJ, Logan-Sinclair RB, Bamber JC, and Gibson DG, “Quantitative effects of speckle reduction on cross sectional echocardiographic images,” British Heart J, vol. 62, pp. 298–304, 1989. - PMC - PubMed

Publication types