. 2020 Dec;9(12):1202-1211.
doi: 10.1530/EC-20-0373.

lncRNA:mRNA expression profile in CD4+ T cells from patients with Graves' disease

Affiliations

lncRNA:mRNA expression profile in CD4+ T cells from patients with Graves' disease

Qinglei Yin et al. Endocr Connect. 2020 Dec.

Abstract

Graves' disease (GD) is a common autoimmune disease that affects the thyroid gland. As a new class of modulators of gene expression, long noncoding RNAs (lncRNAs) have been reported to play a vital role in immune functions and in the development of autoimmunity and autoimmune disease. The aim of this study is to identify lncRNAs in CD4+ T cells as potential biomarkers of GD. lncRNA and mRNA microarrays were performed to identify differentially expressed lncRNAs and mRNAs in GD CD4+ T cells compared with healthy control CD4+ T cells. Quantitative PCR (qPCR) was used to validate the results, and correlation analysis was used to analyze the relationship between these aberrantly expressed lncRNAs and clinical parameters. The microarray identified 164 lncRNAs and 93 mRNAs in GD CD4+ T cells differentially expressed compared to healthy control CD4+ T cells (fold change >2.0 and a P < 0.05). Further analysis consistently showed that the expression of HMlincRNA1474 (P < 0.01) and TCONS_00012608 (P < 0.01) was suppressed, while the expression of AK021954 (P < 0.01) and AB075506 (P < 0.01) was upregulated from initial GD patients. In addition, their expression levels were recovered in euthyroid GD patients and GD patients in remission. Moreover, these four aberrantly expressed lncRNAs were correlated with GD clinical parameters. Moreover, the areas under the ROC curve were 0.8046, 0.7579, 0.8115 for AK021954, AB075506, HMlincRNA1474, respectively. The present work revealed that differentially expressed lncRNAs were associated with GD, which might serve as novel biomarkers of GD and potential targets for GD treatment.

Keywords: CD4+ T cells; Graves’ disease; expression profile; lncRNA.


Figures

Figure 1
Figure 1
lncRNA and mRNA expression profile in GD CD4+ T cells. (A) Hierarchical clustering of differentially expressed lncRNAs between GD CD4+ T cells and healthy control CD4+ T cells (n = 3). (B) Hierarchical clustering of differentially expressed mRNAs between GD CD4+ T cells and healthy control CD4+ T cells (n = 3). Each column indicates a different sample. Each row indicates one mRNA or lncRNA. Relatively high expression is indicated by red shading and relatively low expression is indicated by green shading. (C) Volcano plots of lncRNA expression levels between GD CD4+ T cells and healthy control CD4+ T cells (n = 3). (D) Volcano plots of mRNA expression levels between GD CD4+ T cells and healthy control CD4+ T cells (n = 3). Red squares represent genes upregulated in GD CD4+ T cells and blue squares represent genes downregulated in GD CD4+ T cells.
Figure 2
Figure 2
GO analysis and pathway analysis. Results of functional enrichment analysis in GD CD4+ T cells compared with HC CD4+ T cells. (A) GO analysis of differentially expressed genes according to biological process, cellular component and molecular function (n = 3). (B) Pathway analysis for differentially expressed mRNAs (n = 3).
Figure 3
Figure 3
Validation of differentially expressed lncRNAs. (A) The relative expression levels of 8 lncRNAs were validated by qRT-PCR. White, microarray; black, qRT-PCR (n = 45 for GD, n = 30 for HC). (B) Differential AK021954 expression verified by qRT-PCR in CD4+ T cells from healthy controls (n = 30), initial GD patients (n = 45), euthyroid GD patients (n = 30) and GD patients in remission (n = 12). (C) Differential AB075506 expression verified by qRT-PCR in CD4+ T cells from healthy controls (n = 30), initial GD patients (n = 45), euthyroid GD patients (n = 30) and GD patients in remission (n = 12). (D) Differential TCONS_00012608 expression verified by qRT-PCR in CD4+ T cells from healthy controls (n = 30), initial GD patients (n = 45), euthyroid GD patients (n = 30) and GD patients in remission (n = 12). (E) Differential HMlincRNA1474 expression verified by qRT-PCR in CD4+ T cells from healthy controls (n = 30), initial GD patients (n = 45), euthyroid GD patients (n = 30) and GD patients in remission (n = 12). White bar represents healthy control; light grey bar represents initial GD patients; grey bar represents euthyroid GD patients; black bar represents GD patients in remission. Data represent means ± s.d. *P < 0.05, **P < 0.01 by Student’s t test and one-way ANOVA.
Figure 4
Figure 4
Evaluation of the selective lncRNAs as biomarkers for the diagnosis of GD. The receiver operating characteristic (ROC) curve analysis of AK021954 (A), AB075506 (B), HMlincRNA1474 (C) in the discrimination of Graves’ disease (GD) patients from healthy controls.
Figure 5
Figure 5
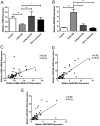
Potential targets of the differentially expressed lncRNAs are integrated with differentially expressed mRNAs. (A) The expression levels of JUNB in initial GD patients (n = 45), euthyroid GD patients (n = 30), GD in remission patients (n = 12) and healthy controls (n = 30) CD4+ T cells by qRT-PCR. (B) The expression levels of NRCAM in initial GD patients (n = 45), euthyroid GD patients (n = 30), GD in remission patients (n = 12) and healthy controls (n = 30) CD4+ T cells by qRT-PCR. White bar represents healthy control; light grey bar represents initial GD patients; grey bar represents euthyroid GD patients; black bar represents GD patients in remission. (C) The expression levels of JUNB correlated with HMlincRNA1474. (D) The expression levels of NRCAM correlated with AK0219554. (E) The expression levels of NRCAM correlated with AB075506. Data represent means ± s.d. *P < 0.05, **P < 0.01 by one-way ANOVA.

References

    1. Smith TJ, Hegedus L.Graves’ disease. New England Journal of Medicine 2016. 375 1552–1565. (10.1056/NEJMra1510030) - DOI - PubMed
    1. Hemminki K, Li X, Sundquist J, Sundquist K.The epidemiology of Graves’ disease: evidence of a genetic and an environmental contribution. Journal of Autoimmunity 2010. 34 J307–J. (10.1016/j.jaut.2009.11.019) - DOI - PubMed
    1. Lichiardopol C, Mota M.The thyroid and autoimmunity. Romanian Journal of Internal Medicine 2009. 47 207–215. - PubMed
    1. Fallahi P, Ferrari SM, Ragusa F, Ruffilli I, Elia G, Paparo SR, Antonelli A.Th1 chemokines in autoimmune endocrine disorders. Journal of Clinical Endocrinology and Metabolism 2020. 105 dgz289. (10.1210/clinem/dgz289) - DOI - PubMed
    1. Zhu C, Ma J, Liu Y, Tong J, Tian J, Chen J, Tang X, Xu H, Lu L, Wang S.Increased frequency of follicular helper T cells in patients with autoimmune thyroid disease. Journal of Clinical Endocrinology and Metabolism 2012. 97 943–950. (10.1210/jc.2011-2003) - DOI - PubMed