. 2020 Oct 28;15(10):e0240237.
doi: 10.1371/journal.pone.0240237. eCollection 2020.

Fabrication routes via projection stereolithography for 3D-printing of microfluidic geometries for nucleic acid amplification

Affiliations

Fabrication routes via projection stereolithography for 3D-printing of microfluidic geometries for nucleic acid amplification

Charalampos Tzivelekis et al. PLoS One. .

Abstract

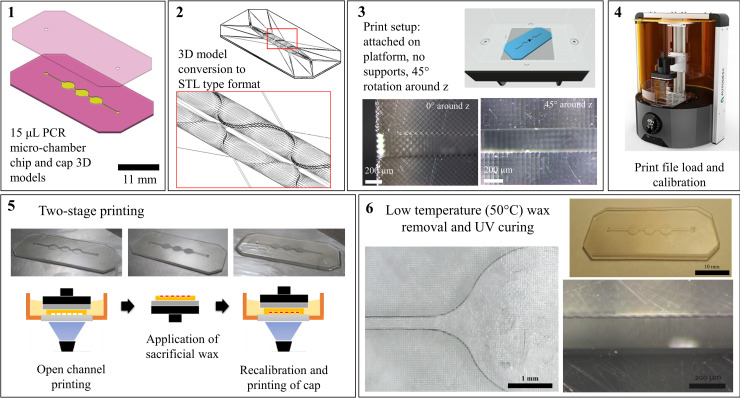
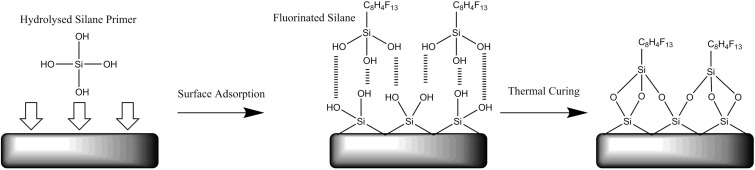
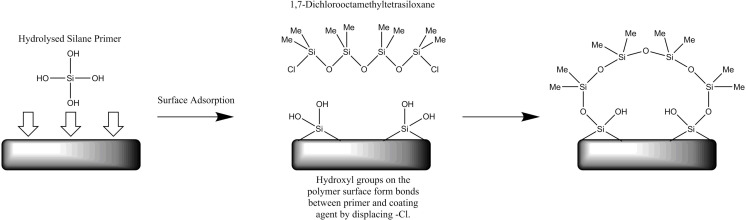
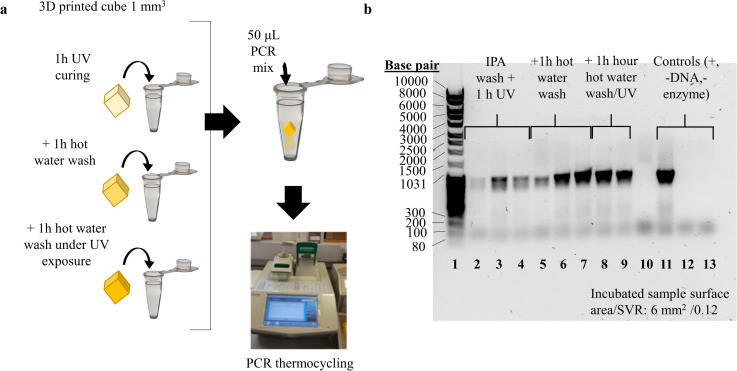
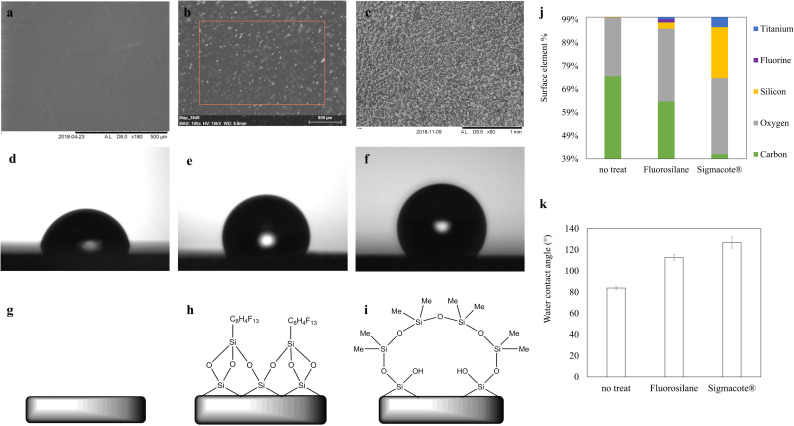
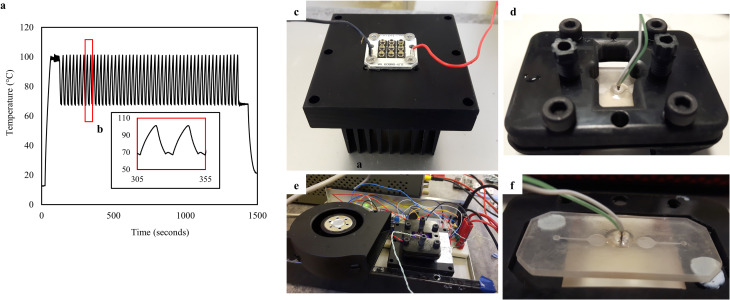
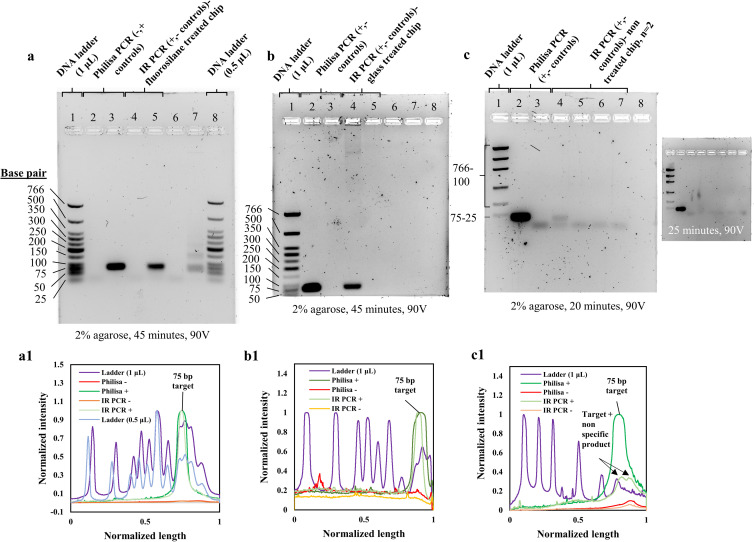
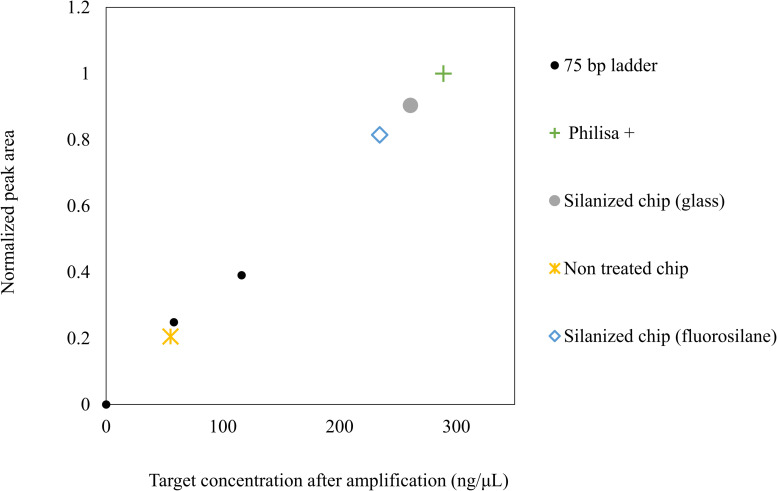
Digital Light Processing (DLP) stereolithography (SLA) as a high-resolution 3D printing process offers a low-cost alternative for prototyping of microfluidic geometries, compared to traditional clean-room and workshop-based methods. Here, we investigate DLP-SLA printing performance for the production of micro-chamber chip geometries suitable for Polymerase Chain Reaction (PCR), a key process in molecular diagnostics to amplify nucleic acid sequences. A DLP-SLA fabrication protocol for printed micro-chamber devices with monolithic micro-channels is developed and evaluated. Printed devices were post-processed with ultraviolet (UV) light and solvent baths to reduce PCR inhibiting residuals and further treated with silane coupling agents to passivate the surface, thereby limiting biomolecular adsorption occurences during the reaction. The printed devices were evaluated on a purpose-built infrared (IR) mediated PCR thermocycler. Amplification of 75 base pair long target sequences from genomic DNA templates on fluorosilane and glass modified chips produced amplicons consistent with the control reactions, unlike the non-silanized chips that produced faint or no amplicon. The results indicated good functionality of the IR thermocycler and good PCR compatibility of the printed and silanized SLA polymer. Based on the proposed methods, various microfluidic designs and ideas can be validated in-house at negligible costs without the requirement of tool manufacturing and workshop or clean-room access. Additionally, the versatile chemistry of 3D printing resins enables customised surface properties adding significant value to the printed prototypes. Considering the low setup and unit cost, design flexibility and flexible resin chemistries, DLP-SLA is anticipated to play a key role in future prototyping of microfluidics, particularly in the fields of research biology and molecular diagnostics. From a system point-of-view, the proposed method of thermocycling shows promise for portability and modular integration of funcitonalitites for diagnostic or research applications that utilize nucleic acid amplification technology.


Conflict of interest statement

The authors have read the journal’s policy and have the following potential competing interests: QuantumDx had a role in the study design. This does not alter our adherence to PLOS ONE policies on sharing data and materials. There are no patents, products in development or marketed products associated with this research to declare.

Figures

Fig 1
Fig 1. Two-stage printing protocol schematic for printing monolithic microfluidic cartridges with DLP® SLA.
An open channel chip and a cap CAD model are developed and converted into STL type format. In AM software environment, the open-channel part is printed virtually positioned onto the printing platform and without support structures. The chip is then cleaned, and the channel cavities are filled with low melting point and viscosity sacrificial wax. The whole process takes place, while the chip is held on the platform by vacuum built during printing of the first layer. A cap part is then printed on the existing chip creating a monolithic channel. The chip is then removed from the platform, cleaned from excessive resin and dried. It is then heated at ~60° and the wax is flushed out with isopropanol and hot water. The printed chip can then be further post-processed and treated.
Fig 2
Fig 2. Schematic representation of the consecutive treatment with siloxane and fluorosilane agents to functionalize a 3D printed acrylate surface with fluorosilane.
The siloxane treated acrylate surface is dipped into hydrolysed fluorosilane agent. Hydrogen bonds are initially formed between the primer and the coating agent, which are covalently bonded to each other after thermal treatment.
Fig 3
Fig 3. Schematic representation of the consecutive treatments with siloxane and glass agents to functionalize a 3D printed acrylate surface with glass.
The siloxane treated surface is dipped into Sigmacote® glass in heptane solution, and bonds are formed between the primer and the glass agent by displacing -CL.
Fig 4
Fig 4. Schematic of an infrared (IR) PCR thermocycler for a 3D printed microchamber PCR chip.
CAD assembly of chip bracket, chip, IR LED cluster and heatsink and a centrifugal fan. The sides of the bracket exposed the bottom chip surface allowing cooling of both the chip and the LED cluster by the fan and insulating the area around the temperature sensor. Copper tape was used to cover internal surfaces of the bracket, reflecting IR towards the chip, and improving the heating rate. The system provided excellent repeatability in thermocycling for PCR, enabling the characterisation of the PCR inhibition exclusively owed to the performance of the printed polymer, eliminating inhibition owed to temperature control. The developed thermocycling platform and its modular character based on open-source electronics additionally provides a basis further exploration of resin-3D printed microfluidic geometries for Point-of-Care analysis of nucleic acids.
Fig 5
Fig 5. Mock PCR experiments for characterisation of printed resin interference with PCR.
(a) Schematic illustration of mock PCR experiments for low SVR incubated prints. Printed samples representative of consecutive post-processing steps including isopropanol (IPA) wash, UV curing and hot water baths were incubated into the PCR mixture and remained until the completion of the reaction, (b) Gel electrophoresis imaging of separated PCR amplicons from mock reactions: low SVR printed samples incubated in PCR mixture during PCR. Samples post-processed with high intensity UV light and hot water washes (bands 5–9) showed minimum interaction with DNA amplification, unlike the ones post-processed only with isopropanol washes and/or UV curing (bands 2–4) (S1A_raw_images in S1 File (DOI: 10.25405/data.ncl.12320501)).
Fig 6
Fig 6. Characterisation of silane-functionalized 3D-printed disk specimens.
SEM images, contact angle visualizations and surface chemistry schematics of (a, d, g) a non-treated, (b, e, h) a fluorosilane and (c, f, i) a glass modified printed 2D surface, with wetting contact angle values of (d) 80°, (e) 115° and (f) 135° for each respective condition for a 0,05 μL deionised water droplet, (j) SEM-EDS surface elemental composition estimation for two silane treatment conditions, compared to a non-treated printed surface. (k) contact angle results summary. (S2A_SEM_contact_angle in S1 File (DOI: 10.25405/data.ncl.12320837), S2B_contact_angle in S1 File (DOI: 10.25405/data.ncl.12320849), S3_Fig_6_SEM_EDS in S1 File (DOI: 10.25405/data.ncl.12320861)).
Fig 7
Fig 7. IR PCR thermocycling performance and system configuration.
(a) A two-step PCR thermocycling profile for 50 cycles and one-minute initial denaturation and final extension steps for 15 μL on-chip reactions. The temperature profile was recorded on a thermocouple embedded 3D printed PCR chip in real-time during PCR thermocycling on a fluorosilane modified chip, (b) zoom-in one two-step PCR cycle temperature profile, (c) a 3D printed chip modified with fluorosilane and fitted with an embedded thermocouple, mounted on the bottom chip bracket prior to PCR, (d) A 3D printed and post-processed, non-treated PCR chip, (e) the IR thermocycler, (f) PCR chip assembled on the IR chip bracket prior to reaction. (S4_ 2_step_PCR-temperature_profile in S1 File (DOI: 10.25405/data.ncl.12320864)).
Fig 8
Fig 8. On-chip nucleic acid amplification reactions on 3D-printed and silane-functionalized micro-chamber chips.
(a) Band intensity analysis of positive and negative (no DNA template) control reactions on Philisa (Lane 2,3) and IR PCR thermocycler on fluorinated 3D printed chips (Lane 4,5,6,7). Loading of 1 (Lane 1) and 0.5 μL (Lane 8) low molecular weight DNA marker allowed accurate quantification of amplicon based on band-intensity. (a1) Agarose gel intensity profile plots generated in ImageJ. Base pair lengths of DNA marker have been tagged for reference to target specificity. (b) Band intensity analysis of positive and negative (no DNA template) control reactions on Philisa (Lane 2,3) and IR PCR thermocycler on glass-coated 3D printed chips (Lane 4,5), run with 1 μL (Lane 1) loading of low molecular weight DNA marker. (b1) Agarose gel intensity profile plots generated in ImageJ. PCR product bands for positive and IR PCR reaction representative peaks were tagged. (c) Band intensity analysis of positive and negative (no DNA template) control reactions on Philisa (Lane 2, 3) and IR PCR thermocycler on non-treated 3D printed chips (Lane 4,5,6,7), run with 1 μL (Lane 1) loading of low molecular weight DNA marker. The gel run for approximately 20 minutes less than the time for the gels with amplicons from treated chips, to visualize the faint amplicon, as the latter was fully absorbed in longer gel electrophoresis runs (inset in c). As a result, the ladder in this gel image is not fully separated. (c1) Agarose gel intensity profile plots generated in ImageJ. PCR product and primer bands for positive and IR PCR reaction representative peaks were tagged. (S1A_raw_images in S1 File (DOI: 10.25405/data.ncl.12320501), S1B_Amplicon_band_intensities_plots in S1 File (DOI: 10.25405/data.ncl.12320396)).
Fig 9
Fig 9. Band intensity-based estimation of amplicon concentration for on-chip reactions.
Calculations of concentration were based on calibration bands obtained from low molecular weight (25-766bp) DNA ladder of 0.5 and 1 μL loadings, resolved in 2% agarose (45 min, 90V) (S1B_Fig_8_Amplicon_band_intensity_plots in S1 File (DOI: 10.25405/data.ncl.12320396)).

Similar articles

Cited by

References

    1. Ahrberg C. D., Manz A. and Chung B. G., “Polymerase chain reaction in microfluidic devices,” Lab on a chip, vol. 16, pp. 3866–3884, 2016. 10.1039/c6lc00984k - DOI - PubMed
    1. Zhang Y. and Ozdemir P., “Microfluidic DNA amplification- A review,” Analytica Chimica Acta, vol. 638, no. 2, pp. 115–125, 2009. 10.1016/j.aca.2009.02.038 - DOI - PubMed
    1. Northup M., Ching M., White R. and Watson R., “DNA amplification with a microfabricated reaction chamber.,” 1993.
    1. Wilding P., Schoffner M. and Kricka L., “PCR in a silicon microstructure,” Clinical Chemistry, vol. 40, no. 9, pp. 1815–8, 1994. - PubMed
    1. Münchow G. and Drese K., “Chapter 13: Nucleic acid amplification in Microsystems,” in Microfluidic Technologies for Miniaturized Analysis Systems, Hardt S., Ed., Boston, MA, Springer, 2007, pp. 523–567. 10.1039/b612669n - DOI

Publication types

MeSH terms