. 2020 Oct 28;15(10):e0240552.
doi: 10.1371/journal.pone.0240552. eCollection 2020.

A new perfusion culture method with a self-organized capillary network

Affiliations

A new perfusion culture method with a self-organized capillary network

Kei Sugihara et al. PLoS One. .

Abstract

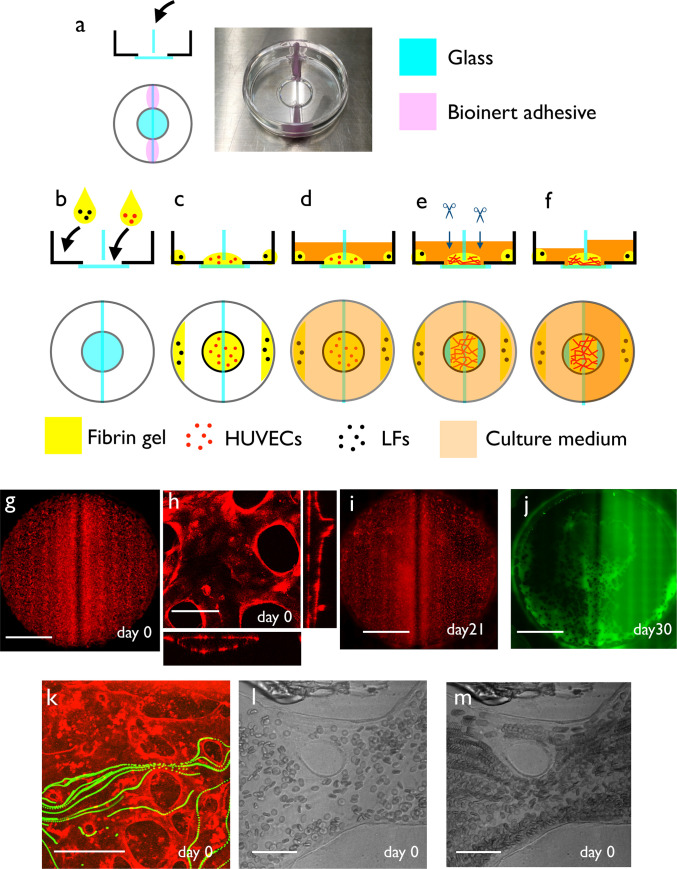
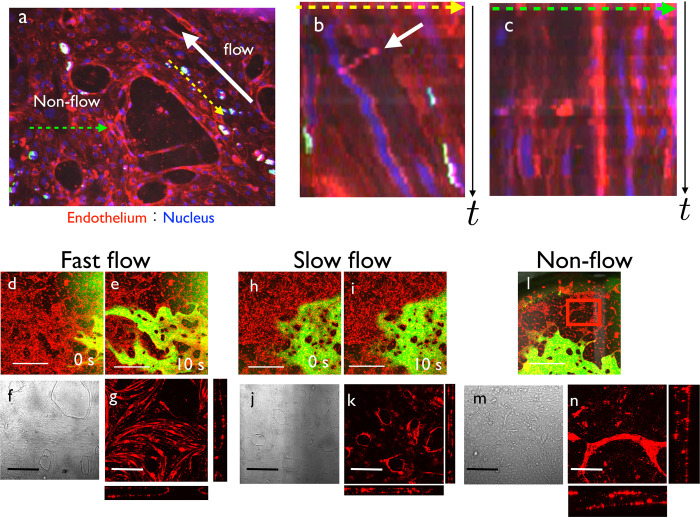
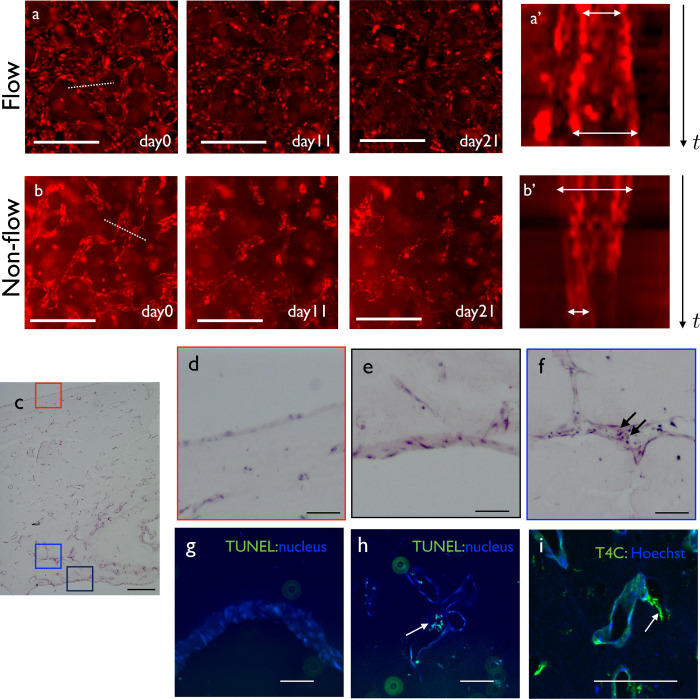
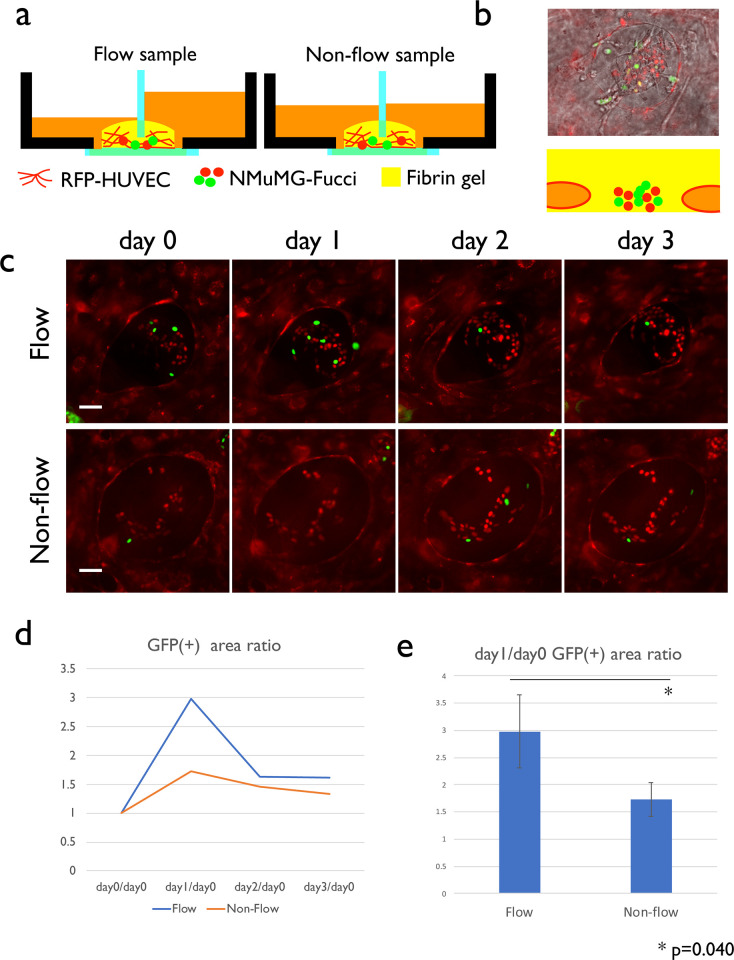
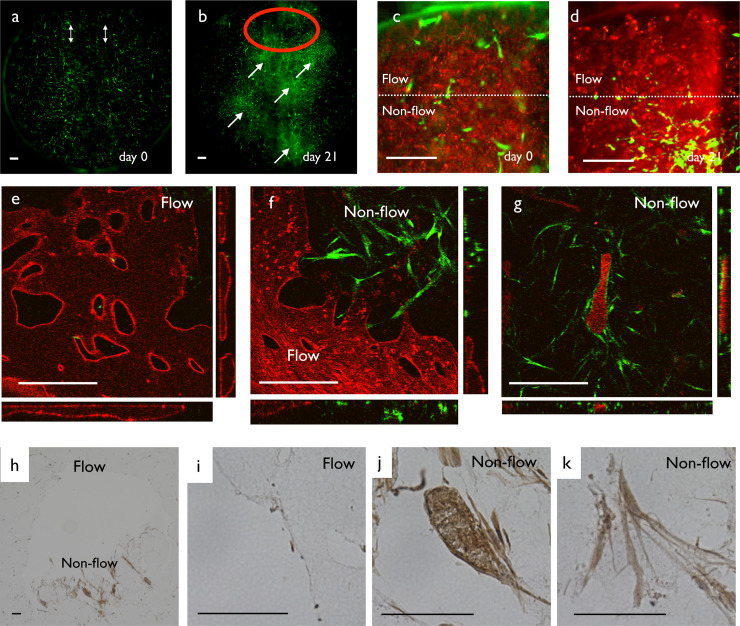
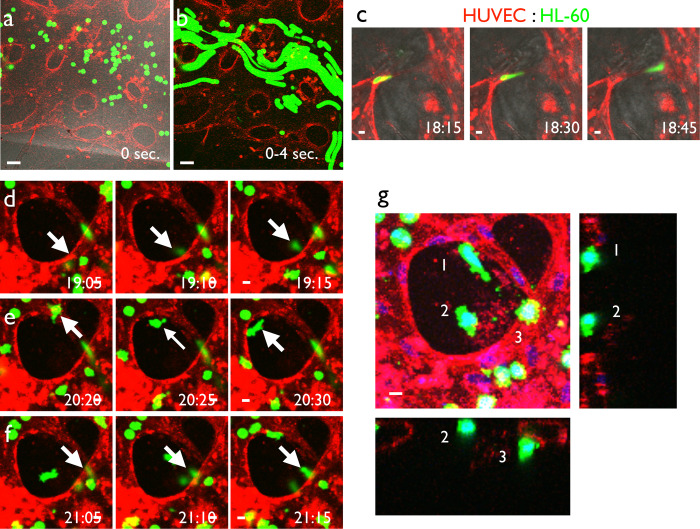
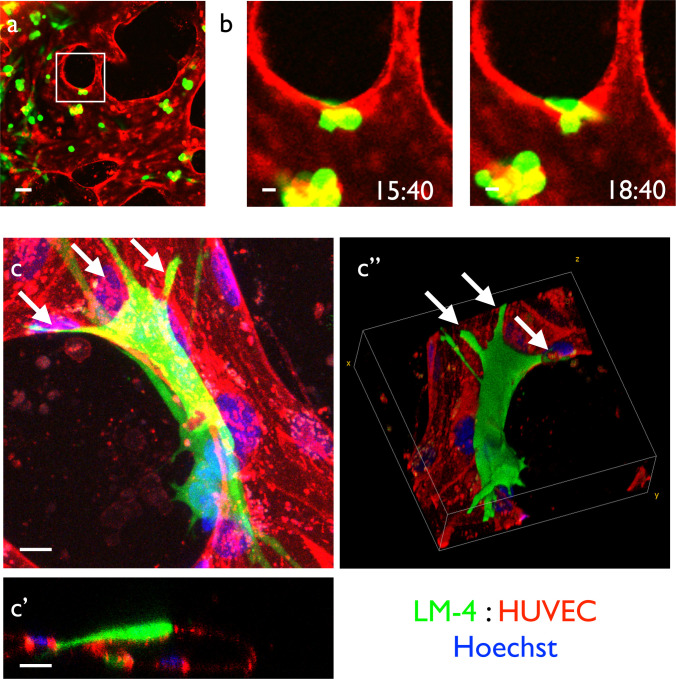
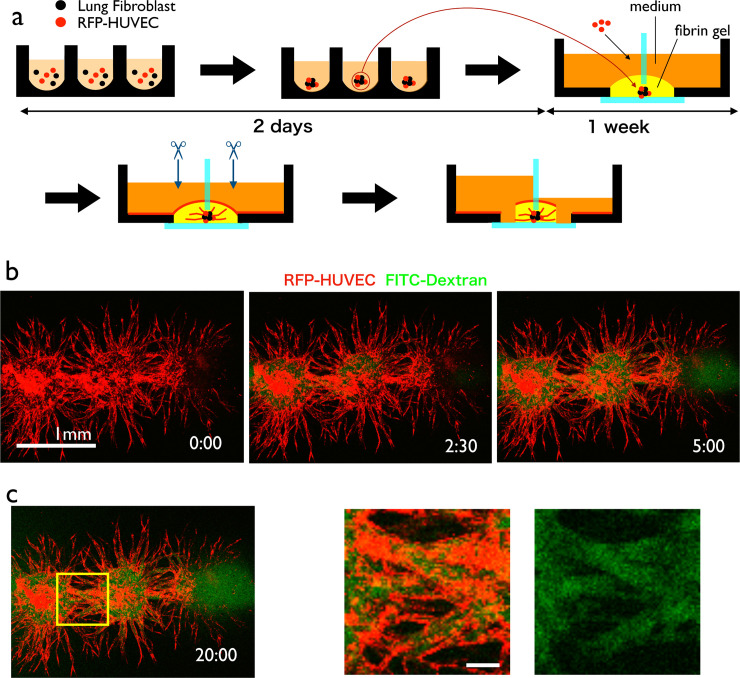
A lack of perfusion has been one of the most significant obstacles for three-dimensional culture systems of organoids and embryonic tissues. Here, we developed a simple and reliable method to implement a perfusable capillary network in vitro. The method employed the self-organization of endothelial cells to generate a capillary network and a static pressure difference for culture medium circulation, which can be easily introduced to standard biological laboratories and enables long-term cultivation of vascular structures. Using this culture system, we perfused the lumen of the self-organized capillary network and observed a flow-induced vascular remodeling process, cell shape changes, and collective cell migration. We also observed an increase in cell proliferation around the self-organized vasculature induced by flow, indicating functional perfusion of the culture medium. We also reconstructed extravasation of tumor and inflammatory cells, and circulation inside spheroids including endothelial cells and human lung fibroblasts. In conclusion, this system is a promising tool to elucidate the mechanisms of various biological processes related to vascular flow.


Conflict of interest statement

The authors have declared that no competing interests exist.

Figures

Fig 1
Fig 1. Culture system setup.
(a) Side and top views of the culture dish before setup. The dish was a normal 12-phi glass-bottom dish. A glass separator was set at the center of the dish with a bioinert adhesive. (b) First, we placed 150 μl fibrin gel mixed with HUVECs in the center of the glass plate, so that two sides of the dish were separated by the glass separator and fibrin gel. We also added LF-containing fibrin gel at the edge of the dish. (c) We incubated the dish for 30 min to solidify the fibrin gel. (d) We added 1 ml culture medium to both wells and incubated the dish for 1 week. (e) After 1 week of culture, a vascular network with a perfusable lumen was formed in the glass-bottom region. Then, we cut both edges of the regions to make openings. (f) After the cuts, we increased the amount of culture medium on one side of the dish. This caused a static pressure difference between both openings of the self-organized capillary network, resulting in steady flow inside the apparatus. (g) Low magnification view of the self-organized vascular network. RFP-HUVECs were cultivated in the fibrin gel, and we observed the vascular network formation. (h) High magnification view of (g). Vascular network with a lumen was generated in the fibrin gel region. (i) Low magnification view of the self-organized vascular network after long-term culture with flow. (j) Visualization of the perfusable area by FITC-dextran. Perfusable regions existed near the inlet and outlet, near the glass separator and edge of the well. (k) Flow inside the lumen was visualized using fluorescent beads. (l) Snapshot of the culture system when using whole blood as a tracer. Red blood cells were flowing inside the self-organized vasculature. (m) Projection of multiple frames of (l). Movements of red blood cells were visualized as a stream. Scale bars: 3 mm (g, i, j); 100 μm (h); 500 μm (k); 50 μm (l, m).
Fig 2
Fig 2. Flow-induced collective cell migration and cell shape changes.
(a) Initial shape of the vascular network. HUVECs were stained with UEA1 and nuclei were stained with Hoechst 33342. There was a flow-positive region (yellow-dashed line) and non-flow region (green-dashed line). Direction of flow is indicated by a white allow. (b) Kymograph of the yellow-dashed line region. Horizontal direction represents space, and vertical direction represents time. Collective movement toward upstream of the flow was observed. White arrow indicates the flow of cell debris. (c) Kymograph of the green-dashed line region. Cell movement was random. (d–n) Cell shape changes induced by flow: (d, e) Fast flow. When FITC dextran was perfused, the vessel regions near the inlet or outlet showed fast flow. (f) Brightfield view of the fast flow region. Endothelial cells became shaped as spindles aligned parallel to the flow direction. (g) Fluorescence view of the fast flow region. At the floor of the lumen, we observed spindle-shaped cells parallel to the flow direction. (h, i) Slow flow. When FITC dextran was perfused, the vessel regions far from the inlet or outlet showed slow flow. (j) Brightfield view and (k) confocal view of the slow flow region. Endothelial cells did not show any polarity. (l) Low magnification view of the non-flow region. (m) Brightfield view and (n) confocal view of the non-flow region. Vasculatures were disconnected and became thin endothelial cysts with cell debris inside. Scale bars: 1 mm (d, e, h, i, l); 200 μm (f, g, j, k, m, n).
Fig 3
Fig 3. Reconstruction of flow-induced remodeling.
(a) Remodeling process at the high flow region from day 0 to 21. (a’) Kymograph of the dotted line region in (a). Vasculature dilated gradually. (b) Remodeling process at the non-flow region from day 0 to 21. (b’) Kymograph of the dotted line region in (b). The vascular diameter decreased. (c) Low magnification view of a hematoxylin-eosin-stained EC monoculture sample. (d) Magnified view of the upper surface of the gel. The surface of the gel was covered by endothelial cells. (e) Magnified view of the large lumen inside the gel. The lumen was also covered by endothelial cells. (f) Magnified view of the small lumen inside the gel. Small necrotic cells were observed inside the lumen (arrows). (g) TUNEL staining of the flow region. No dead cells were observed. (h) TUNEL staining of the non-flow region. Dead cells were observed inside the vasculature. (i) Type IV collagen staining of the long-term culture sample. There were some lumens positive for type IV collagen without cells (arrows), indicating the ECM sheath of the degraded vasculatures in non-flow regions. Scale bars: 500 μm (a–c); 100 μm (d–i).
Fig 4
Fig 4. Effect of flow on cell proliferation.
(a) Experiment setup. We prepared two groups of dishes in which a mixture of RFP-HUVECs and NMuMG-Fucci cells were seeded in the fibrin gel. After the perfusable network was formed, we made openings to both groups but transferred medium in only one group of the dishes. (b) Typical appearance of the NMuMG cell colony and its schematic representation. NMuMG-Fucci cells (red and green nuclei) forms colonies outside the vascular lumen. (c) Time course of the cell division monitored by Fucci reporter. (d) Time course of GFP(+) area ratio. 20 NMuMG-Fucci colonies were observed, and the area of GFP(+) areas was obtained using Fiji. (e) GFP(+) area ratio between day 1 and day 0. Statistically significant difference was detected (Student t-test). Scale bars: 50 μm.
Fig 5
Fig 5. Dynamics of pericytes in the HUVEC-pericyte coculture system.
(a) Low magnification view of the distribution of pericytes at day 0 (green). White arrows indicate the inlet and outlet. (b) Distribution of pericytes after 21 days of perfusion culture. We observed a high density region of pericytes (arrows) in the non-flow region and a low density region (red circle) in the flow region. (c) High magnification view of pericyte distribution at the flow region (day 0). (d) High magnification view of the pericyte distribution at the flow region (day 21). Pericyte cell density was decreased in flow region and increased in non-flow region. (e) 3D structure of the flow region at day 30. Endothelial cells (red) formed vasculature with a perfusable lumen. Pericytes were virtually absent. (f) Boundary between flow and non-flow regions. Pericytes resided in the non-flow region. (g) 3D structure of the non-flow region. Vasculature was degraded and flat cysts of endothelial cells with cell debris inside remained. Pericytes appeared to surround the degraded structure. (h) Low magnification view of PDGFBB immunohistochemistry. A positive signal was observed in the non-flow region. (i) High magnification view of the flow region. No positive signal was observed. (j) High magnification view of the non-flow region. The cell cyst and surrounding pericytes had a high staining intensity. (k) High magnification view of pericytes in the non-flow region. A positive signal was observed in the cytoplasm. Scale bars: 500 μm (a–g); 100 μm (h–k).
Fig 6
Fig 6. Extravasation of leukocytes using the self-organized vascular network.
(a) HL-60 cells, an acute myelogenous leukemia cell line, were labeled with CellTracker Green and introduced into the self-organized vascular system visualized by UEA-I lectin. (b) Projection image of a time-lapse movie for 4 seconds. Movement of HL-60 cells inside the vascular network was observed. (c) DMSO-induced differentiated HL-60 cells (dHL-60), which mimicked neutrophils, passed through thin vessels with large deformation under the presence of TNFα. (d–f) Representative time-course of extravasation. Extravasation occurred within a short time period (10 min.). Extravasating cells (white arrows) extended protrusions toward the outside of the blood vessel when emigrating from the blood vessel lumen. (g) Three-dimensional structure of extravasated cells (white arrows) shown as max projection x-y and x-z/y-z single slice images. We clearly observed extravasated cells outside of the vasculature. Time separated with colons indicates hours and minutes. Scale bars: 50 μm (a, b); 10 μm (c–g).
Fig 7
Fig 7. Reproduction of hematogenous metastasis of cancer cells from the capillary network.
(a) LM4-GFP cells were introduced into the self-organized capillary network consisting of HUVECs visualized by UEA-1 lectin. (b) High magnification time-lapse view of (a). We observed cancer cells emigrating out of the blood vessels. (c) Detailed morphology of cancer cells on the endothelial cells. Emigrated LM4 cells attached to the blood vessel with highly polarized morphology and multiple protrusions. (c) Max projection image, (c') orthogonal section, and (c'') 3D-reconstructed image. White arrows: cancer cell protrusions. Scale bars: 50 μm (a); 10 μm (b, c).
Fig 8
Fig 8. Perfusion of vascularized spheroids.
(a) Experimental procedure. Spheroids containing RFP-HUVECs and lung fibroblast were generated and embedded in fibrin gel. After 1 week, sprouts from the spheroids became sufficiently long. Then, we cut the tip of the sprouts from both sides of the well and exerted static pressure to one side of the well. (b) Visualization of the perfusion inside the spheroid using FITC-dextran. (c) High-magnification view of the sprouts connecting two spheroids. FITC-dextran is running through the sprout structure. Scale bar: 1 mm (b); 100 μm (c).

Similar articles

Cited by

References

    1. Gilbert SF, Michael J. Barresi. Developmental Biology. 11th ed. Sinauer; 2018.
    1. Wolpert L, Tickle C. Principles of development. 4th ed. New York, New York, USA: Oxford University Press; 2011.
    1. Sadler TW. Langmanʼs Medical Embryology. 10th ed. Baltimore: Lippincott Williams & Wilkins; 2006. 10.1097/00006534-198801000-00024 - DOI
    1. Shamir ER, Ewald AJ. Three-dimensional organotypic culture: Experimental models of mammalian biology and disease [Internet]. Nature Reviews Molecular Cell Biology. 2014. pp. 647–664. 10.1038/nrm3873 - DOI - PMC - PubMed
    1. Clevers H. Modeling Development and Disease with Organoids. Cell. 2016;165: 1586–1597. 10.1016/j.cell.2016.05.082 - DOI - PubMed

Publication types