. 2020 Dec 3;27(6):951-961.e5.
doi: 10.1016/j.stem.2020.10.001. Epub 2020 Oct 13.

SARS-CoV-2 Infects the Brain Choroid Plexus and Disrupts the Blood-CSF Barrier in Human Brain Organoids

Affiliations

SARS-CoV-2 Infects the Brain Choroid Plexus and Disrupts the Blood-CSF Barrier in Human Brain Organoids

Laura Pellegrini et al. Cell Stem Cell. .

Abstract

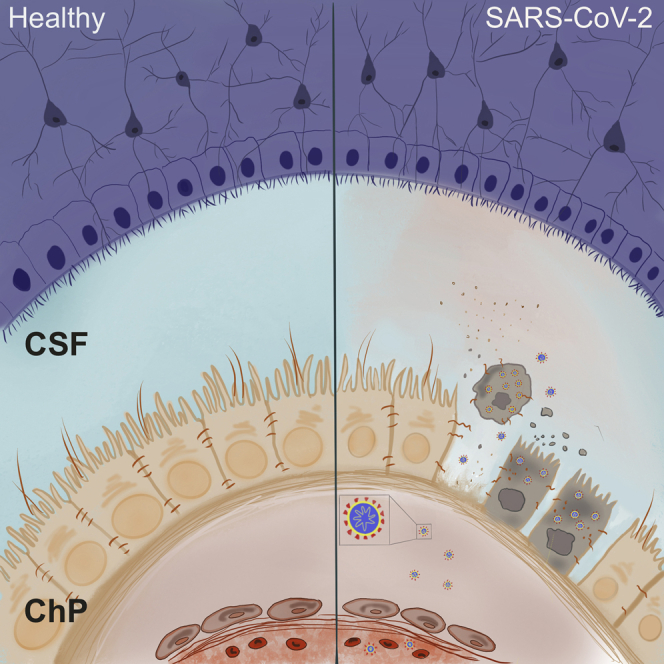
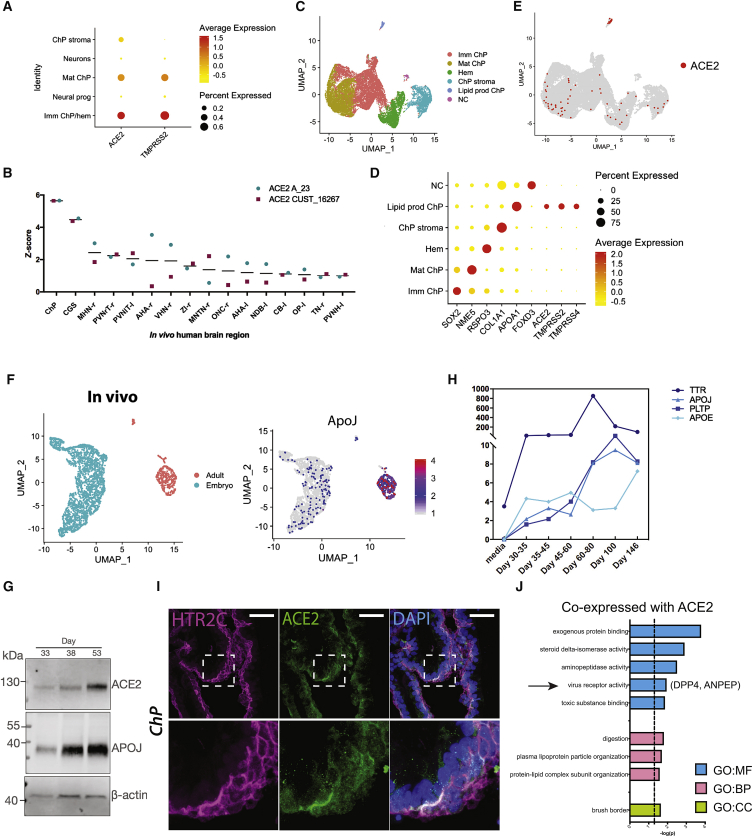
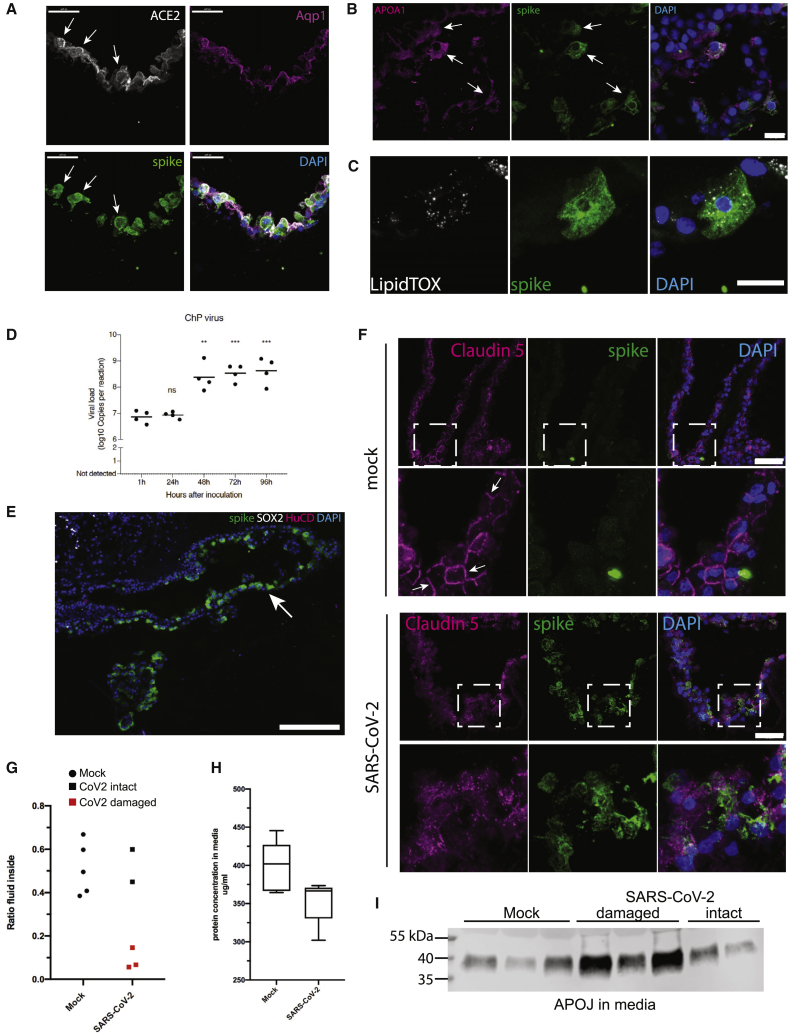
Coronavirus disease 2019 (COVID-19), caused by the severe acute respiratory syndrome coronavirus 2 (SARS-CoV-2) virus, leads to respiratory symptoms that can be fatal. However, neurological symptoms have also been observed in some patients. The cause of these complications is currently unknown. Here, we use human-pluripotent-stem-cell-derived brain organoids to examine SARS-CoV-2 neurotropism. We find expression of viral receptor ACE2 in mature choroid plexus cells expressing abundant lipoproteins, but not in neurons or other cell types. We challenge organoids with SARS-CoV-2 spike pseudovirus and live virus to demonstrate viral tropism for choroid plexus epithelial cells but little to no infection of neurons or glia. We find that infected cells are apolipoprotein- and ACE2-expressing cells of the choroid plexus epithelial barrier. Finally, we show that infection with SARS-CoV-2 damages the choroid plexus epithelium, leading to leakage across this important barrier that normally prevents entry of pathogens, immune cells, and cytokines into cerebrospinal fluid and the brain.

Keywords: COVID-19; SARS-CoV-2; apolipoprotein; blood-CSF-barrier; cerebral organoids; choroid plexus organoids.


Conflict of interest statement

Declaration of Interests L.P. and M.A.L. declare that they have filed a patent based on the ChP organoid protocol.

Figures

None
Graphical abstract
Figure 1
Figure 1
ACE2 and Other Entry Factors Are Expressed in the Choroid Plexus (A) Dot plot showing average expression and percentage of cells expressing SARS-CoV-2 entry factors ACE2 and TMRPSS2 in the five main clusters identified by scRNA-seq of days 27–53 ChP and day 55 telencephalic organoids (Pellegrini et al., 2020). (B) Allen Brain Atlas expression data of ACE2 (probe names: ACE2 A_23 and ACE2 CUST_16267) in different adult human brain regions, with highest expression in the ChP. Regions with an average Z score across the two probes (black line) of greater than 1 are shown. (C) Uniform Manifold Approximation and Projection (UMAP) plot showing subclustering of all ChP cell types identified by scRNA-seq. Imm ChP, immature ChP; lipid prod ChP, lipoprotein-producing ChP; Mat ChP, maturing ChP; NC, neural crest. (D) Dot plot showing average expression and percentage of cells for key marker genes present in the subclusters identified by scRNA-seq. Lipoprotein-producing ChPs express SARS-CoV-2 entry genes ACE2, TMPRSS2, and TMPRSS4. (E) Feature plot showing all cells expressing any level of ACE2. (F) UMAP plot of mouse embryonic and adult ChP cells (left) and feature plot for ApoJ (clusterin). (G) Immunoblot for ACE2, APOJ, and the loading control β-actin of days 33–53 ChP organoid protein lysates. (H) Exponentially Modified Protein Abundance Index (emPAI) values for lipid-related proteins in a previously published dataset (Pellegrini et al., 2020) of organoid CSF samples until day 146. (I) Representative confocal images of day 40 ChP tissue immunostained for the ChP epithelial marker HTR2C (serotonin receptor 2C) in magenta and ACE2 in green. Nuclei in blue are stained with DAPI. Scale bar: 50 μm. (J) gProfileR (Reimand et al., 2011) analysis of genes co-expressed with ACE2 showing significant enrichment (p < 0.05) for GO categories cellular component (GO:CC), molecular function (GO:MF), and biological process (GO:BP).
Figure 2
Figure 2
SARS-CoV-2 Spike Pseudovirus Infects ChP Cells, but Not Other Brain Cells, of Cerebral Organoids (A) Representative confocal images of ChP epithelial tissue from organoids-infected SARS-CoV-2 spike pseudovirions. GFP-positive cells, as detected by GFP antibody, are shown from three independent experiments with organoids aged 56 days (infection 1), 73 days (infection 2), and 78 days (infection 3). Nuclei in blue are stained with DAPI. Scale bar: 50 μm. (B) Representative confocal images of ChP epithelial tissue from organoids infected with VSV-G lentivirus. Scale bar: 50 μm. (C) Representative confocal images of ChP epithelial tissue from organoids infected with lentivirus pseudovirions lacking viral glycoprotein of the envelope (Δenv). Scale bar: 50 μm. (D) Quantification of mean GFP-positive cells over total counted cells for VSV-G, SARS-CoV-2 spike, and Δenv-lentiviral-infected ChP epithelial cells from organoids (n = 100 cells counted for each of the three independent experimental repeats, error bars are SD). (E) Representative confocal image of a cortical lobe of a day 78 cerebral organoid infected with SARS-CoV-2 pseudovirions showing an example of a false-positive signal due to GFP autofluorescence and stained with anti-GFP antibody (in magenta). Nuclei in blue are stained with DAPI. Scale bar: 50 μm. (F) Representative images of a day 78 ALI-CO infected with SARS-CoV-2 spike pseudovirions and immunostained with axonal marker SMI312 in magenta, anti-GFP antibody in green, and DAPI in blue. Scale bar: 100 μm. (G) Representative images of a day 78 ALI-CO infected with VSV lentivirus and immunostained with axonal marker SMI312 in magenta, anti-GFP antibody in green, and DAPI in blue. Scale bar: 100 μm. (H) Higher magnification image of ChP epithelial tissue from organoid immunostained for ACE2 in magenta, GFP, and DAPI. Scale bar: 20 μm.
Figure 3
Figure 3
Live SARS-CoV-2 Specifically Infects ChP Epithelium (A) 1 day post-infection (dpi) of day 110 ChP organoids with either live SARS-CoV-2 or mock and staining for two independent antibodies (Abcam ab252690 spike glycoprotein in magenta and GeneTex GTX632604 in green) directed to the viral spike protein. Specific staining is only seen in the SARS-CoV-2 infection condition, with co-staining for ACE2 (arrows). Scale bars: 100 μm. (B) Quantification of infected cells staining positive for viral spike protein in ChP tissue infected with SARS-CoV-2 (n = 3 independent infections) compared with mock (n = 2 independent infections). Data are shown as mean with error bars representing SD. (C) Staining for viral spike protein in mixed identity day 117 telencephalic organoids at 1 dpi showing staining only in ChP tissue. Scale bar: 100 μm. (D) Staining for viral spike protein in day 124 mixed identity telencephalic organoids displaying adjacent cortical and ChP tissues at 2 dpi and 4 dpi. Scale bars: 100 μm. (E) Staining for viral spike protein in pure day 48 cortical organoids infected with either SARS-CoV-2 or mock showing no specific staining in either condition. Scale bars: 100 μm. (F) Staining for viral spike protein in day 156 ALI-COs infected for 2 days with 10 times the dose used for ChP or mixed-identity organoids. Note sparse staining of a neuron (white arrow) that is positive for MAP2 and a glial cell (yellow arrow) that is positive for GFAP. Scale bars: 50 μm.
Figure 4
Figure 4
SARS-CoV-2 Disrupts ChP Epithelial Integrity and Barrier Function (A) Co-staining for ACE2 in infected cells of day 124 ChP tissue (arrows) with co-staining for the apical marker Aquaporin 1 (Aqp1). Scale bars: 50 μm. (B) Co-staining for APOA1 and viral spike protein in ChP epithelium after 1 dpi. Scale bar: 20 μm. (C) Co-staining for LipidTOX and viral spike in a ChP epithelial cell after 1 dpi. Scale bars: 20 μm. (D) qRT-PCR using primers and probes against the CDC N1 amplicon of SARS-CoV-2 in infected ChP organoids (days 117 and 124) over the course of 4 dpi. n = 4 organoids from 2 independent infections. ∗∗p = 0.002; ∗∗∗p < 0.001; two-tailed unpaired Student’s t test. (E) Staining for viral spike protein in a day 117 telencephalic organoid with intact CSF-like fluid-filled cysts (arrow) showing infection after application of virus on the basal (outer) surface. Scale bar: 200 μm. (F) Staining for tight-junction protein claudin 5 in day 117 ChP epithelium infected with SARS-CoV-2 or mock at 2 dpi. Note the presence of clearly demarcated junctions (arrows) in mock versus infection with SARS-CoV-2. Green fluorescent signal in mock represents typical nonspecific background, which does not label a cell. Scale bars: 50 μm. (G) Internal fluid volume as a ratio of the total excess volume in the final media and lysates collected at 4 dpi. Red data points are SARS-CoV-2-infected day 77 ChP organoids with damaged morphology as shown in Figure S4E. n = 5 organoids for each condition. (H) Total protein concentration in the media, as measured by Bradford assay, of organoids at 4 dpi with mock or SARS-CoV-2. n = 5 day 77 organoids for each condition. Whiskers are min and max. (I) Immunoblot for APOJ of media samples at 4 dpi of day 77 ChP organoids. Three mock samples were run alongside all five SARS-CoV-2-infected samples. Those labeled damaged refer to those organoids with damaged morphology (samples 1, 4, and 5) as shown in Figure S4E.

References

    1. Aizawa Y., Seki N., Nagano T., Abe H. Chronic hepatitis C virus infection and lipoprotein metabolism. World J. Gastroenterol. 2015;21:10299–10313. - PMC - PubMed
    1. Besler C., Lüscher T.F., Landmesser U. Molecular mechanisms of vascular effects of High-density lipoprotein: alterations in cardiovascular disease. EMBO Mol. Med. 2012;4:251–268. - PMC - PubMed
    1. Cantuti-Castelvetri L., Ohja R., Pedro L.D., Djannatian M., Franz J., Kuivanen S., Kallio K., Kaya T., Anastasina M., Smura T. Neuropilin-1 facilitates SARS-CoV-2 cell entry and provides a possible pathway into the central nervous system. bioRxiv. 2020 doi: 10.1101/2020.06.07.137802. - DOI - PMC - PubMed
    1. Cao J., Spielmann M., Qiu X., Huang X., Ibrahim D.M., Hill A.J., Zhang F., Mundlos S., Christiansen L., Steemers F.J. The single-cell transcriptional landscape of mammalian organogenesis. Nature. 2019;566:496–502. - PMC - PubMed
    1. Chen R., Wang K., Yu J., Howard D., French L., Chen Z., Wen C., Xu Z. The spatial and cell-type distribution of SARS-CoV-2 receptor ACE2 in human and mouse brain. bioRxiv. 2020 doi: 10.1101/2020.04.07.030650. - DOI - PMC - PubMed

Publication types

Substances